Отчет об исследовании настроений на рынке криптовалют (16–23 августа 2024 г.): биткоин растет на фоне разворота в сторону снижения процентной ставки
Bitcoin rises as dovish stance turns to imminent rate cut
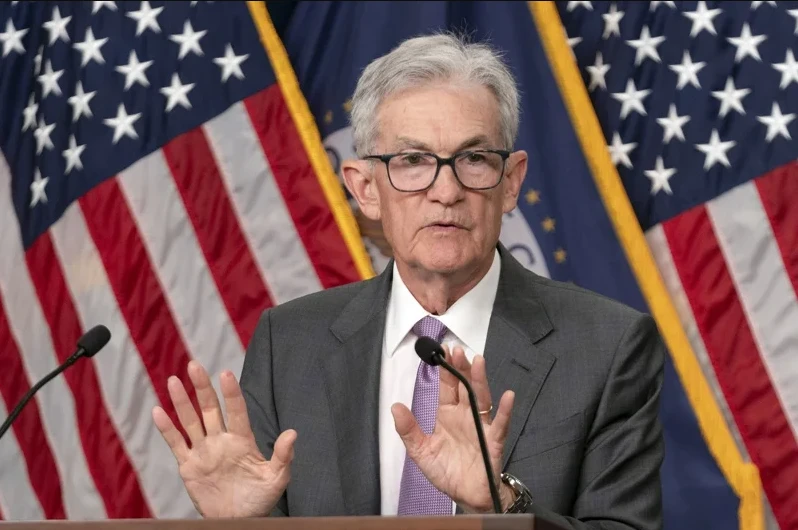
At 10 a.m. Eastern Time on Friday, August 23, Federal Reserve Chairman Powell made an important speech at the Jackson Hole Global Central Bank Annual Meeting.
**It is worth noting that Powell stated quite clearly: The time for policy adjustment has come. The policy direction is clear, and the timing and pace of interest rate cuts will depend on subsequent data, changes in the outlook and the balance of risks.
Some analysts said that although Powell confirmed the markets widespread expectation of starting interest rate cuts in September, this speech was also dovish, providing a certain clarity to the financial market in the short term, but did not provide many clues about how the Fed will act after the September meeting.
For example, if there is another negative employment report, whether there will be a sharp 50 basis point rate cut, and whether rate cuts will continue in the coming months. However, Powells speech at least confirmed that the Feds fight against inflation over the past two years is about to reach a critical turning point.
After the annual meeting, Bitcoin rose from US$61,000 to a high of US$65,000, an increase of 6.5%.
There are about 26 days until the next Federal Reserve interest rate meeting (September 19, 2024)
https://hk.investing.com/economic-calendar/interest-rate-decision-168
Технический анализ рынка и аналитика настроений

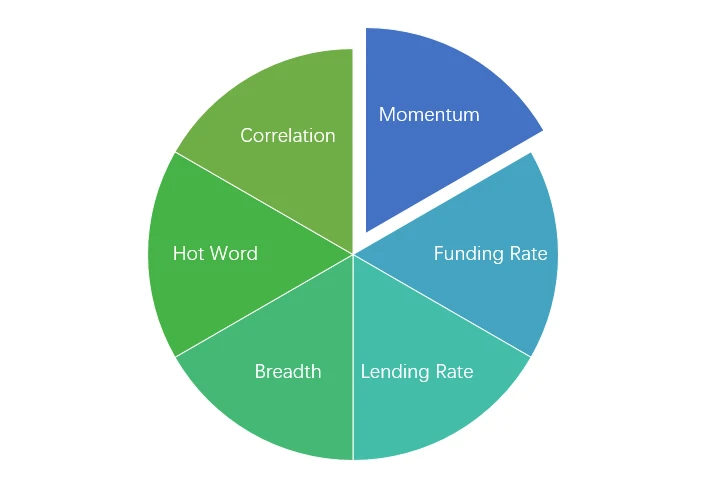
Компоненты анализа настроений

Технические индикаторы
Price Trends
In the past week, BTC prices rose 8.77% and ETH prices rose 6.55%.
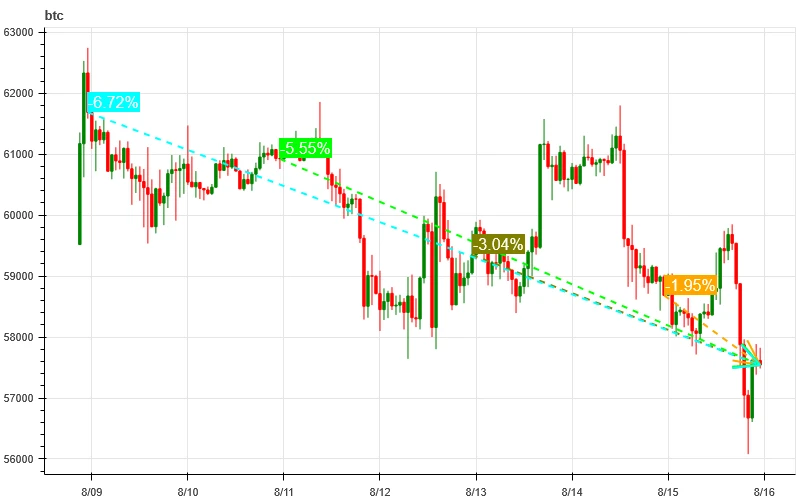
На изображении выше показан график цены BTC за последнюю неделю.
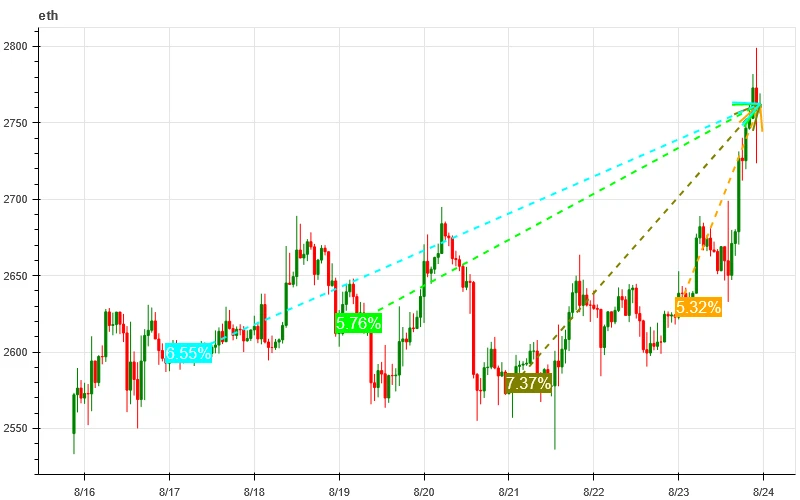
На изображении выше показан график цены ETH за последнюю неделю.

В таблице представлена скорость изменения цен за прошедшую неделю.
График распределения цены и объема (поддержка и сопротивление)
In the past week, both BTC and ETH broke through the concentrated trading area and formed an upward trend.
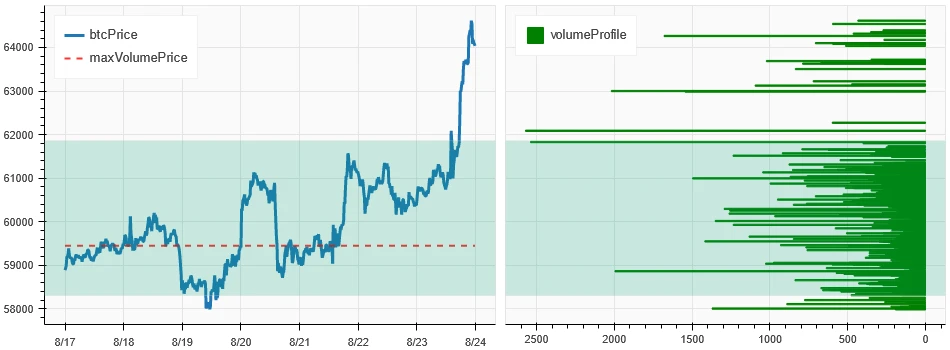
На рисунке выше показано распределение зон с плотной торговлей BTC на прошлой неделе.
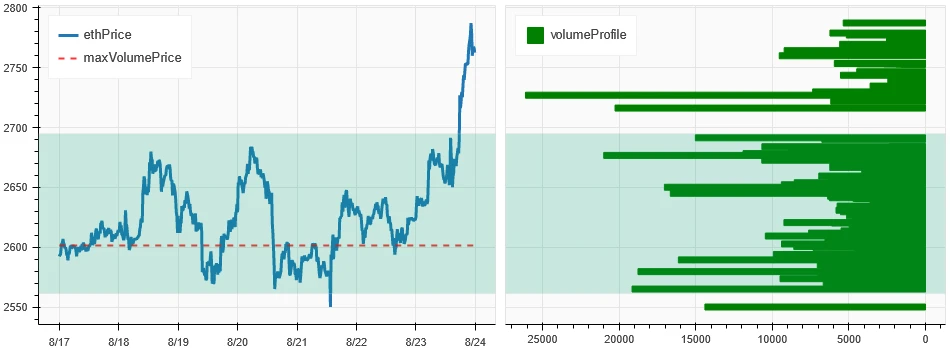
На рисунке выше показано распределение зон с плотной торговлей ETH за последнюю неделю.

В таблице показан недельный интенсивный торговый диапазон BTC и ETH за прошедшую неделю.
Объем и открытый интерес
In the past week, the trading volume of BTC and ETH was the largest when they rose to 8.23; the open interest of BTC and ETH both increased slightly.
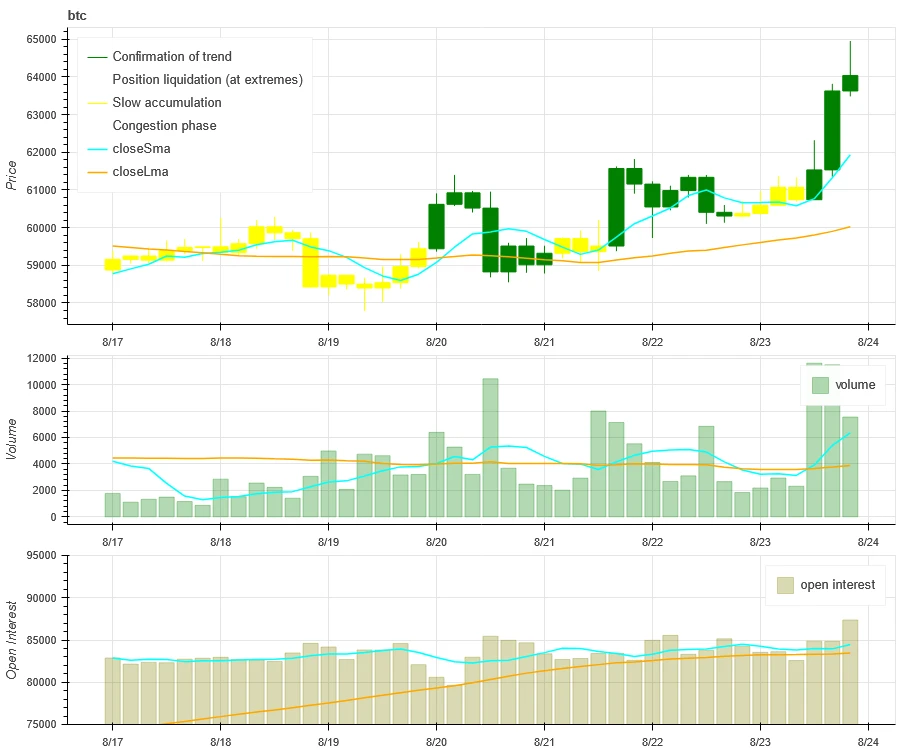
Верхняя часть изображения выше показывает ценовой тренд BTC, середина показывает объем торгов, нижняя часть показывает открытый интерес, голубой цвет — среднее значение за 1 день, а оранжевый — среднее значение за 7 дней. Цвет K-линии представляет текущее состояние, зеленый означает, что рост цены поддерживается объемом торгов, красный означает закрытие позиций, желтый означает медленное накопление позиций, а черный означает состояние переполненности.
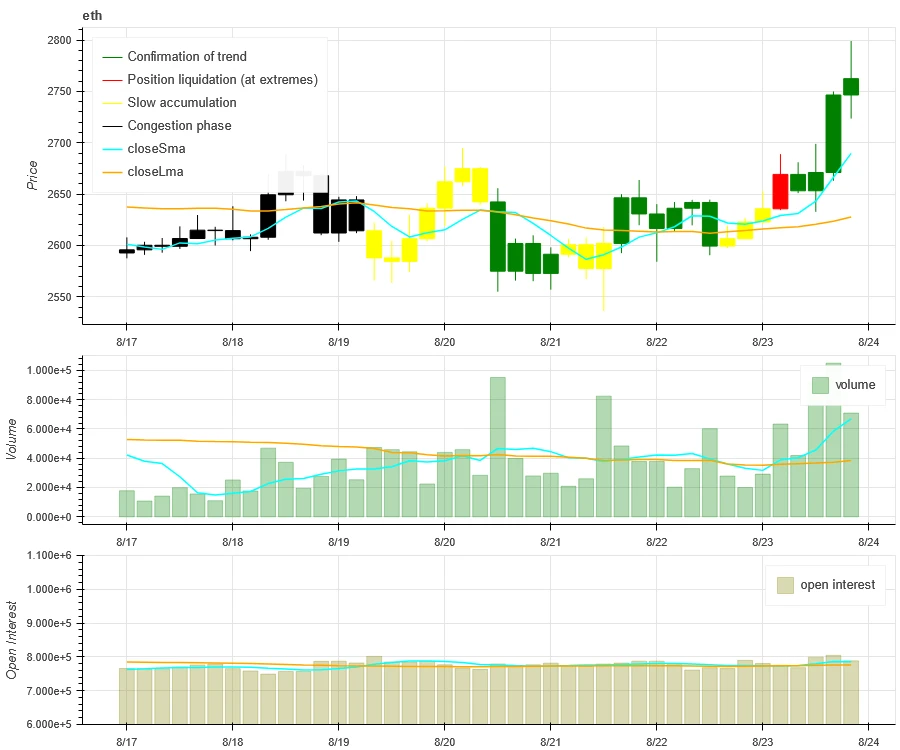
Верхняя часть изображения выше показывает ценовой тренд ETH, середина — объем торгов, нижняя часть — открытый интерес, голубой цвет — среднее значение за 1 день, а оранжевый — среднее значение за 7 дней. Цвет К-линии представляет текущее состояние, зеленый означает, что рост цены поддерживается объемом торгов, красный — закрытие позиций, желтый — медленное накопление позиций, черный — переполненность.
Историческая волатильность против подразумеваемой волатильности
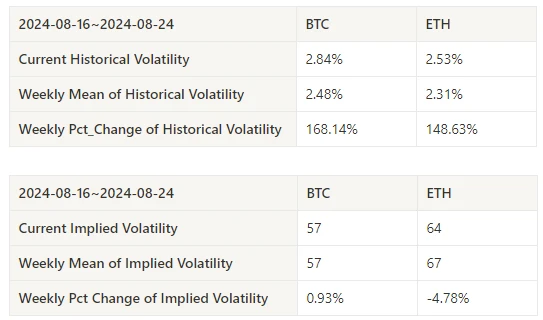
In the past week, the historical volatility of BTC and ETH was highest when they fluctuated in a wide range of 8.20; the implied volatility of BTC increased while that of ETH decreased.
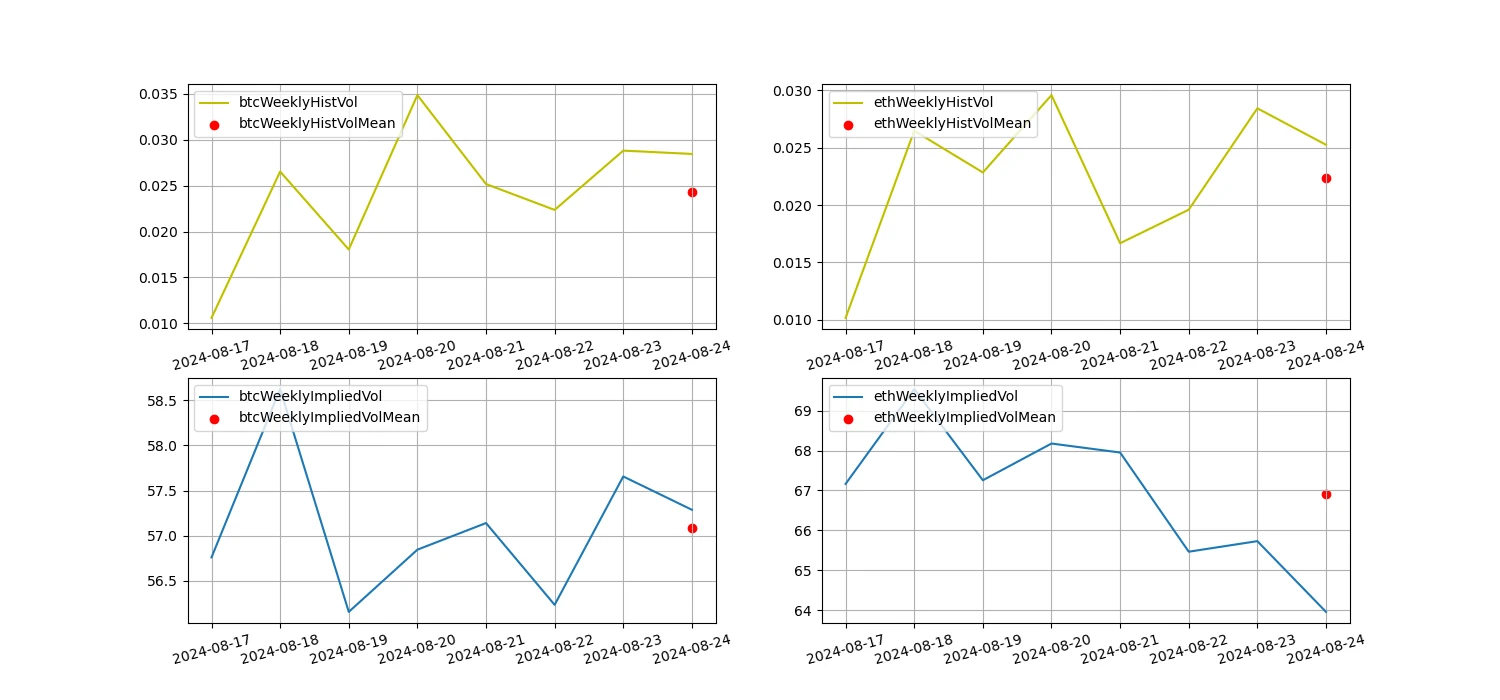
Желтая линия — это историческая волатильность, синяя линия — подразумеваемая волатильность, а красная точка — ее среднее значение за 7 дней.
Управляемый событиями
This past week, the Federal Reserve’s annual meeting hinted at an upcoming rate cut, and Bitcoin rose 6.5% in response.
Индикаторы настроений
Импульс Настроения
На прошлой неделе среди пар Bitcoin/Gold/Nasdaq/Hang Seng Index/CSI 300 биткоин показал самые сильные результаты, а CSI 300 показал самые плохие результаты.
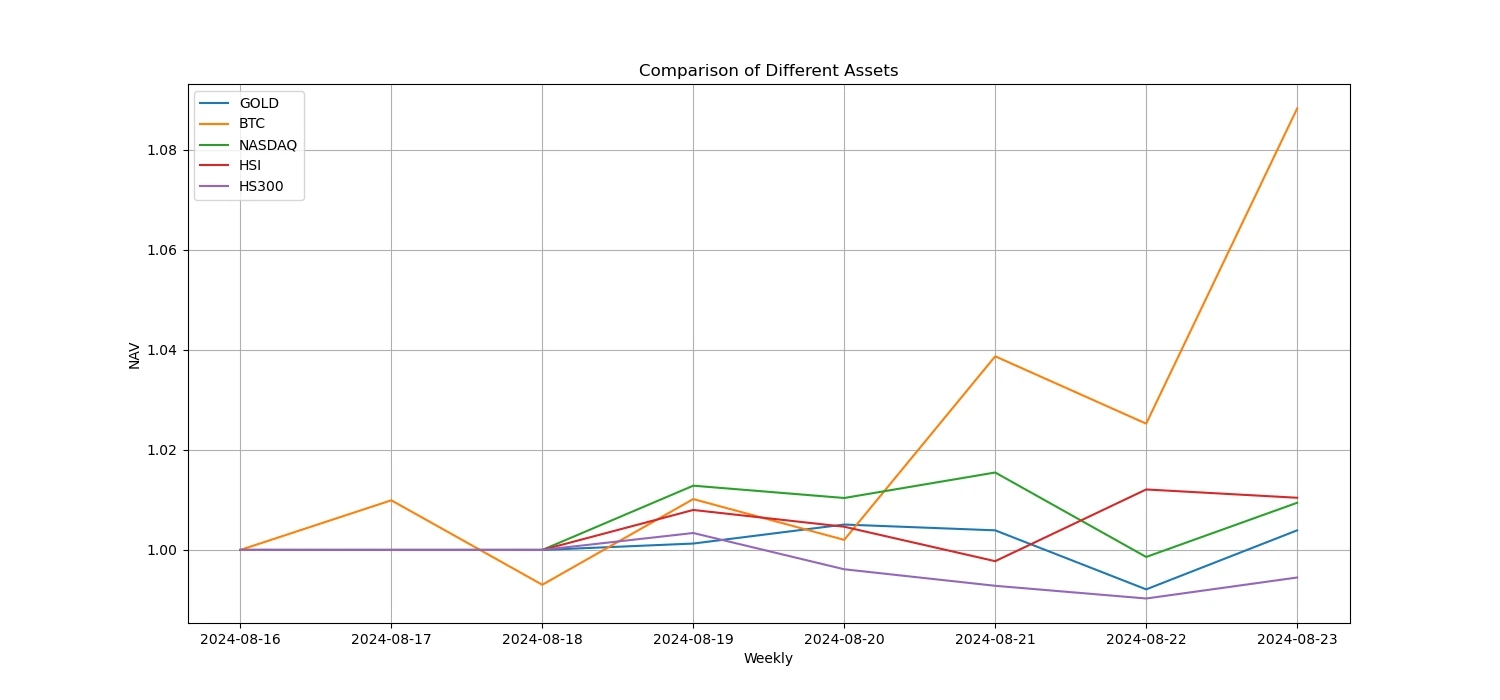
На картинке выше показана динамика различных активов за последнюю неделю.

Кредитная ставка_Настроение по кредитованию
The average annualized return on USD lending over the past week was 6.6%, and short-term interest rates rose to 10.1%.
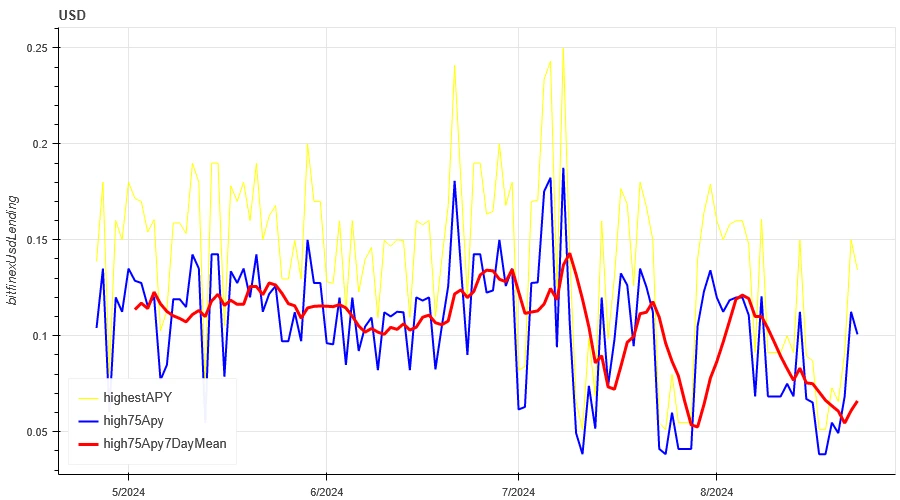
Желтая линия — это самая высокая цена процентной ставки в долларах США, синяя линия — 75% самой высокой цены, а красная линия — 7-дневное среднее значение 75% самой высокой цены.

В таблице показана средняя доходность процентных ставок в долларах США в разные дни владения в прошлом.
Ставка финансирования_Настроение по кредитному плечу по контракту
The average annualized return on BTC fees in the past week was -1.4%, and contract leverage sentiment is turning pessimistic.

Синяя линия — это ставка финансирования BTC на Binance, а красная линия — ее среднее значение за 7 дней.

В таблице показана средняя доходность комиссий BTC за разные дни владения в прошлом.
Рыночная корреляция_консенсус-настроение
The correlation among the 129 coins selected in the past week was around 0.85, and the consistency between different varieties has increased from a low level.

На картинке выше синяя линия — это цена биткоина, а зеленая линия — [1000 floki, 1000 lunc, 1000 pepe, 1000 shib, 100 0x ec, 1inch, aave, ada, agix, algo, ankr, ant, ape, apt, arb, ar, astr, atom, audio, avax, axs, bal, band, bat, bch, bigtime, blur, bnb, btc, celo, cfx, chz, ckb, comp, crv, cvx, cyber, dash, doge, dot, dydx, egld, enj, ens, eos и т. д., eth, fet, fil, flow, ftm, fxs, gala, gmt, gmx, grt, hbar, hot, icp, icx , imx, inj, iost, iotx, jasmy, kava, klay, ksm, ldo, link, loom, lpt, lqty, lrc, ltc, luna 2, магия, мана, matic, мем, мина, mkr, рядом, нео, океан, один, ont, op, pendle, qnt, qtum, rndr, роза, руна, rvn, песок, sei, sfp, snx , sol, ssv, stg, storj, stx, sui, sushi, sxp, theta, tia, trx, t, uma, uni, vet, waves, wld, woo, xem, xlm, xmr, xrp, xtz, yfi, zec, zen, zil, zrx] общая корреляция
Широта рынка_Общее настроение
Among the 129 coins selected in the past week, 89% of them were priced above the 30-day moving average, 75% of them were above the 30-day moving average relative to BTC, 66% of them were more than 20% away from the lowest price in the past 30 days, and 48% of them were less than 10% away from the highest price in the past 30 days. The market breadth indicator in the past week showed that most coins in the overall market returned to an upward trend.
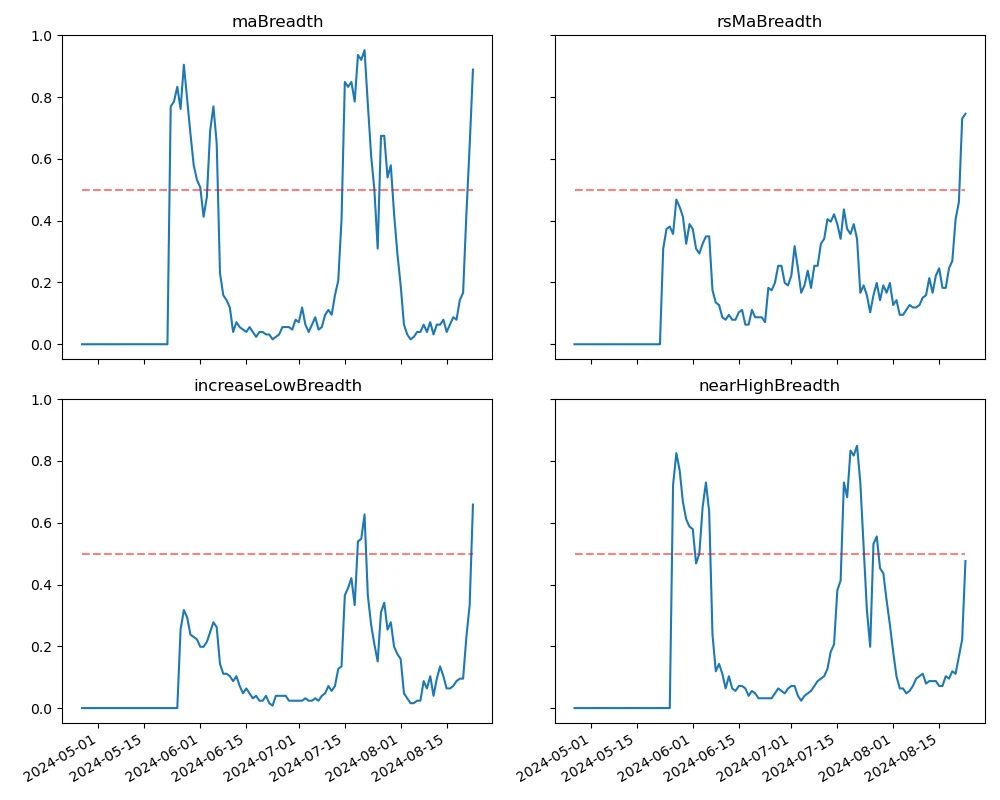
Картинка выше [bnb, btc, sol, eth, 1000 floki, 1000 lunc, 1000 pepe, 1000 sats, 1000 shib, 100 0x ec, 1inch, aave, ada, agix, ai, algo, alt, ankr, ape, apt, arb, ar, astr, atom, avax, axs, bal, band, bat, bch, bigtime, blur, cake, celo, cfx, chz, ckb, comp, crv, cvx, cyber, dash, doge, dot, dydx, egld, enj, ens, eos и т. д., fet, fil, flow, ftm, fxs, gala, gmt, gmx, grt, hbar, hot, icp, icx, Idu, imx, inj, iost, iotx, jasmy, jto, jup, kava, klay, ksm, ldo, ссылка, ткацкий станок, lpt, lqty, lrc, ltc, luna 2, магия, мана, манта, маска, matic, мем, мина, mkr, рядом, нео, nfp, океан, один, ont, op, ordi, pendle, pyth, qnt, qtum, rndr, Robin, Rose, Rune, RVN, Sand, Sei, sfp, skl, snx, ssv, stg, storj, stx, sui, sushi, sxp, theta, tia, trx, t, uma, uni, vet, waves, wif, wld, woo,xai, xem, xlm, xmr, xrp, xtz, yfi, zec, zen, zil, zrx ] 30-дневная пропорция каждого индикатора ширины

Подведем итог
In the past week, the price of Bitcoin (BTC) and Ethereum (ETH) fluctuated and then rose. The historical volatility peaked on August 20 when the market fluctuated widely, and the trading volume peaked on August 23 when the market rose. The open interest of both BTC and ETH increased. The implied volatility of BTC increased while that of ETH decreased. Bitcoin performed the best in comparison with gold, Nasdaq, Hang Seng Index and CSI 300, while CSI 300 performed the weakest. Bitcoins funding rate fell to negative, reflecting the pessimistic sentiment of market participants. The correlation between the selected 129 currencies remained at around 0.85, showing that the consistency between different varieties has risen from a low level. The market breadth indicator shows that most cryptocurrencies in the overall market are still back to an upward trend. The Federal Reserves annual meeting hinted at an upcoming rate cut, and Bitcoin rose 6.5% in response.
Твиттер: @ https://x.com/CTA_ChannelCmt
Веб-сайт: channelcmt.com
This article is sourced from the internet: Crypto Market Sentiment Research Report (2024.08.16–08.23): Bitcoin rises as dovish turn to impending rate cut
Оригинальный автор: Crypto, Distilled Оригинальный перевод: TechFlow Coinbase только что опубликовала отчет о том, как криптохедж-фонды генерируют избыточную прибыль. Вот самые ценные идеи. Обзор отчета В отчете раскрываются основные стратегии, используемые активными криптохедж-фондами. Он предоставляет ценную информацию для любого инвестора, который хочет: Лучше управлять рисками Получить избыточную прибыль Углубить свое понимание шифрования Предоставить ценную информацию. Пассивная или активная стратегия? Независимо от вашего уровня опыта, всегда сравнивайте свои результаты с $BTC. Если вы не можете превзойти $BTC в течение года или более, рассмотрите пассивную стратегию. Для большинства инвесторов DCAing $BTC на регулярной основе обычно является лучшим вариантом во время медвежьего рынка. Биткоин – эталон $BTC является предпочтительным эталоном для бета-версии криптовалютного рынка. С 2013 года $BTC имеет годовую доходность…


