My XP
0
Login

Растущая вероятность победы Трампа сделала рискованные активы, такие как биткоин, популярными. В частности, Республиканская партия упомянула в своей последней предвыборной платформе, что если Трамп вступит в должность, он прекратит подавление криптовалют, что значительно повысило доверие к рынку криптовалют.
«Сделка Трампа» оказалась хитом.
После того, как на Трампа напали в выходные, ряд активов, связанных с Трампом, таких как доходность казначейских облигаций США и биткоин, взлетели. Это все благодаря тому, что он пережил покушение, и поддержка Трампа американским народом резко возросла.
Среди них биткоин рос шесть дней подряд, при этом общий рост на этой неделе составил 11,59%, достигнув максимума в US$66,000.
До следующего заседания ФРС (1 августа 2024 г.) осталось около 11 дней.
https://hk.investing.com/economic-calendar/interest-rate-decision-168

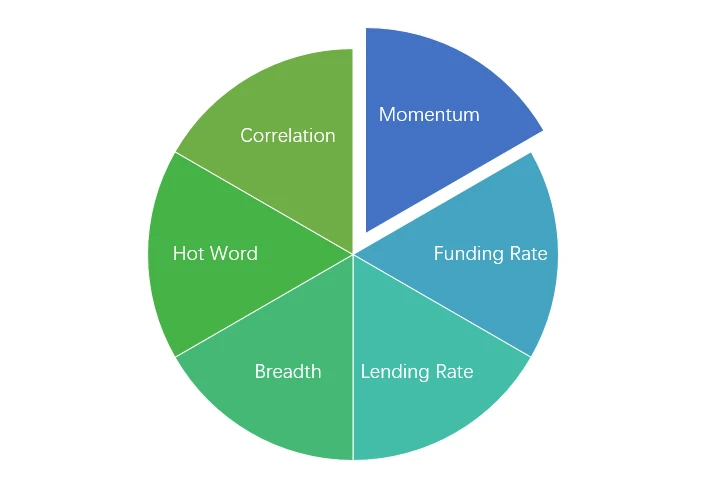
Компоненты анализа настроений
За последнюю неделю цена BTC выросла на 11,59%, а цена ETH выросла на 10,55%.
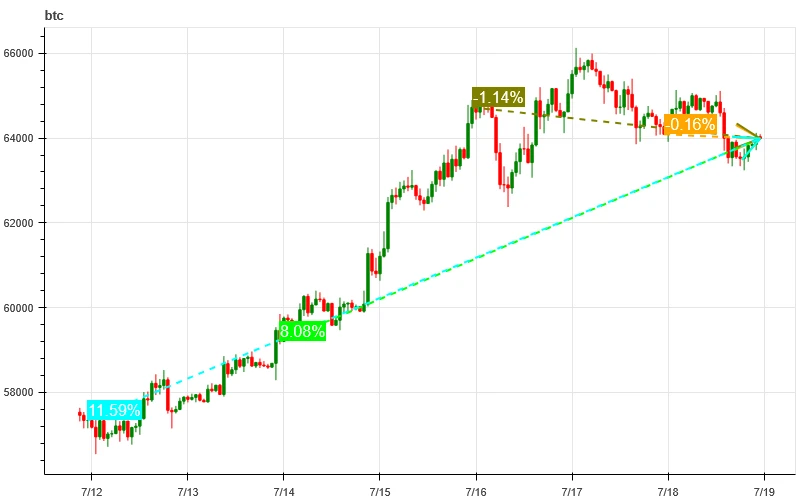
На изображении выше показан график цены BTC за последнюю неделю.

На изображении выше показан график цены ETH за последнюю неделю.
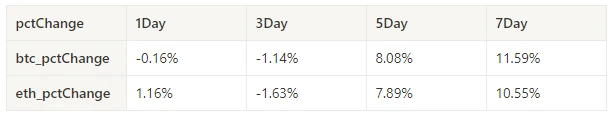
В таблице представлена скорость изменения цен за прошедшую неделю.
На прошлой неделе BTC и ETH сформировали новую интенсивную торговую зону, поскольку они выросли до высоких уровней и увеличились в объеме.
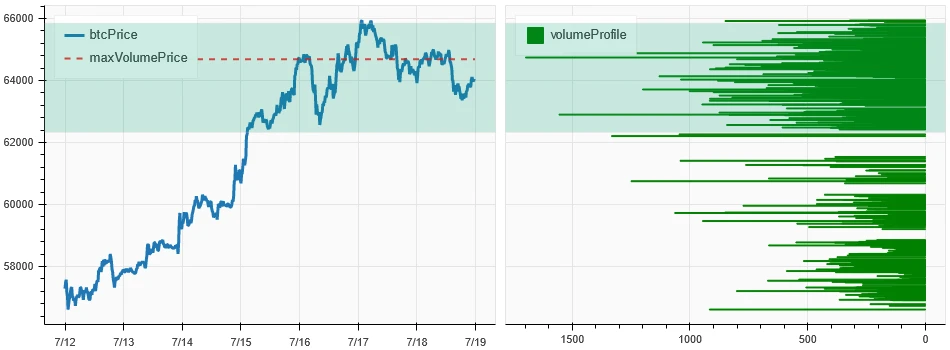
На рисунке выше показано распределение зон с плотной торговлей BTC на прошлой неделе.

На рисунке выше показано распределение зон с плотной торговлей ETH за последнюю неделю.
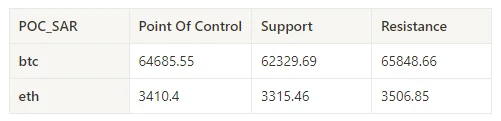
В таблице показан недельный интенсивный торговый диапазон BTC и ETH за прошедшую неделю.
На прошлой неделе наибольший объем торгов был у BTC и ETH, когда они росли с 15 по 16 июля; открытый интерес по BTC и ETH немного снизился.

Верхняя часть изображения выше показывает ценовой тренд BTC, середина показывает объем торгов, нижняя часть показывает открытый интерес, голубой цвет — среднее значение за 1 день, а оранжевый — среднее значение за 7 дней. Цвет K-линии представляет текущее состояние, зеленый означает, что рост цены поддерживается объемом торгов, красный означает закрытие позиций, желтый означает медленное накопление позиций, а черный означает состояние переполненности.

Верхняя часть изображения выше показывает ценовой тренд ETH, середина — объем торгов, нижняя часть — открытый интерес, голубой цвет — среднее значение за 1 день, а оранжевый — среднее значение за 7 дней. Цвет К-линии представляет текущее состояние, зеленый означает, что рост цены поддерживается объемом торгов, красный — закрытие позиций, желтый — медленное накопление позиций, черный — переполненность.
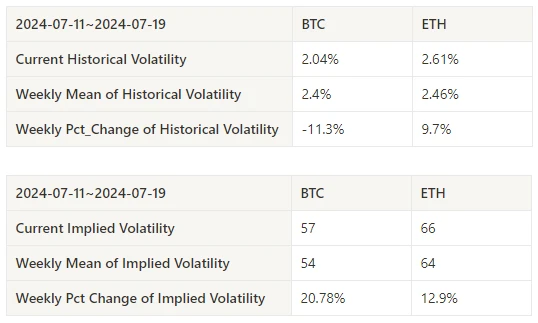
На прошлой неделе историческая волатильность BTC и ETH достигла самого высокого значения, составив 7,16; подразумеваемая волатильность BTC и ETH выросла синхронно.
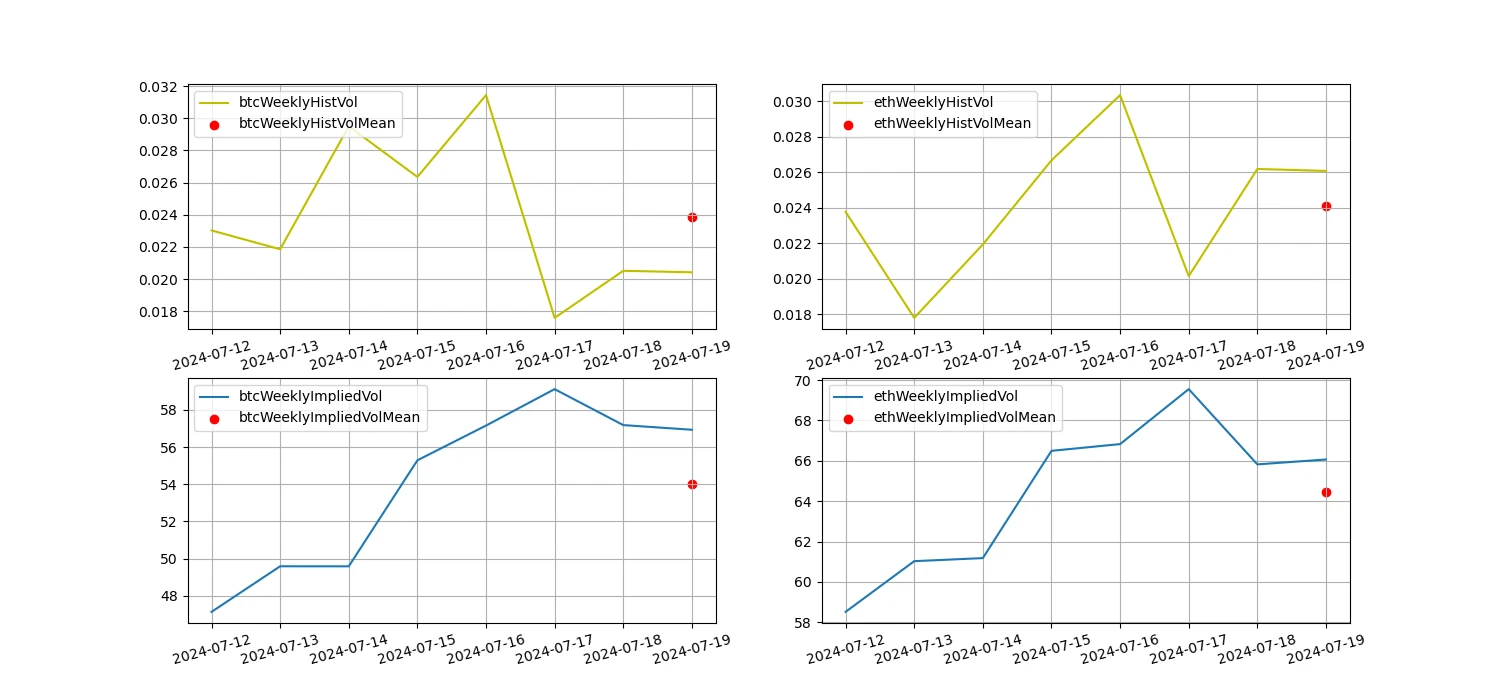
Желтая линия — это историческая волатильность, синяя линия — подразумеваемая волатильность, а красная точка — ее среднее значение за 7 дней.
За прошедшую неделю не было опубликовано никаких важных данных.
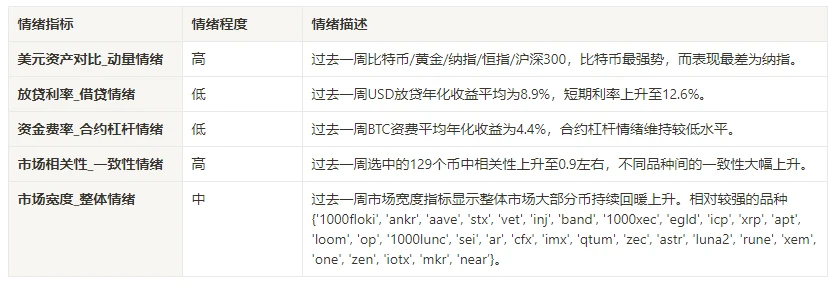
На прошлой неделе среди пар Bitcoin/Gold/Nasdaq/Hang Seng Index/SSE 300 биткоин показал самые сильные результаты, а Nasdaq показал наихудшие результаты.

На картинке выше показана динамика различных активов за последнюю неделю.

Средняя годовая доходность кредитования в долларах США за последнюю неделю составила 8,9%, а краткосрочные процентные ставки выросли до 12,6%.

Желтая линия — это самая высокая цена процентной ставки в долларах США, синяя линия — 75% самой высокой цены, а красная линия — 7-дневное среднее значение 75% самой высокой цены.
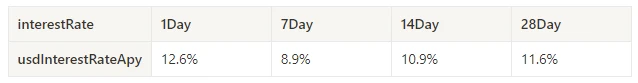
В таблице показана средняя доходность процентных ставок в долларах США в разные дни владения в прошлом.
Средняя годовая доходность комиссий BTC за последнюю неделю составила 4,4%, а настроения относительно кредитного плеча по контрактам оставались на низком уровне.
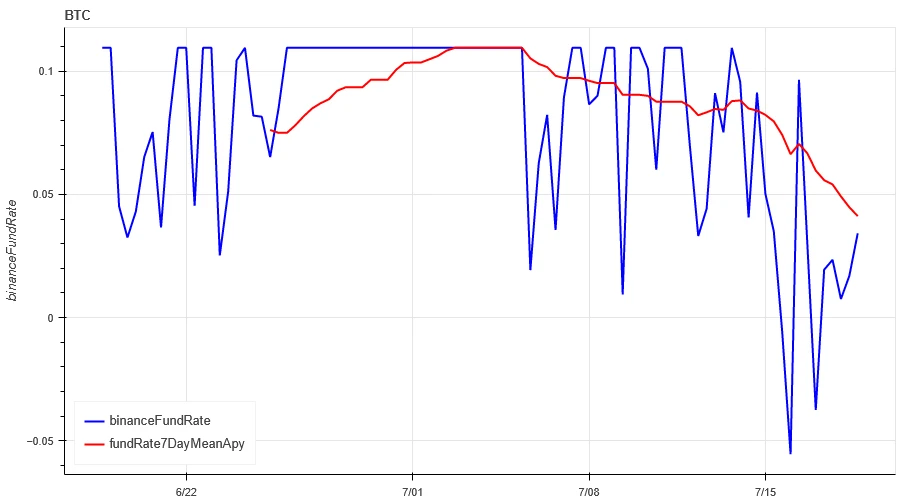
Синяя линия — это ставка финансирования BTC на Binance, а красная линия — ее среднее значение за 7 дней.

Таблица показывает средняя доходность Комиссии за хранение BTC в разные дни в прошлом.
Корреляция между 129 монетами, отобранными за последнюю неделю, осталась на уровне около 0,9, а согласованность между различными разновидностями значительно возросла.

На картинке выше синяя линия — это цена биткоина, а зеленая линия — [1000 floki, 1000 lunc, 1000 pepe, 1000 shib, 100 0x ec, 1inch, aave, ada, agix, algo, ankr, ant, ape, apt, arb, ar, astr, atom, audio, avax, axs, bal, band, bat, bch, bigtime, blur, bnb, btc, celo, cfx, chz, ckb, comp, crv, cvx, cyber, dash, doge, dot, dydx, egld, enj, ens, eos и т. д., eth, fet, fil, flow, ftm, fxs, gala, gmt, gmx, grt, hbar, hot, icp, icx , imx, inj, iost, iotx, jasmy, kava, klay, ksm, ldo, link, loom, lpt, lqty, lrc, ltc, luna 2, магия, мана, matic, мем, мина, mkr, рядом, нео, океан, один, ont, op, pendle, qnt, qtum, rndr, роза, руна, rvn, песок, sei, sfp, snx , sol, ssv, stg, storj, stx, sui, sushi, sxp, theta, tia, trx, t, uma, uni, vet, waves, wld, woo, xem, xlm, xmr, xrp, xtz, yfi, zec, zen, zil, zrx] общая корреляция
Среди 129 монет, выбранных на прошлой неделе, 78% цен были выше 30-дневной скользящей средней, 37% цен были выше 30-дневной скользящей средней относительно BTC, 33% цен были более чем на 20% от самой низкой цены за последние 30 дней, и 67.7% цен были менее чем на 10% от самой высокой цены за последние 30 дней. Индикаторы широты рынка на прошлой неделе показали, что большинство монет на общем рынке восстановились и выросли.

Картинка выше [bnb, btc, sol, eth, 1000 floki, 1000 lunc, 1000 pepe, 1000 sats, 1000 shib, 100 0x ec, 1inch, aave, ada, agix, ai, algo, alt, ankr, ape, apt, arb, ar, astr, atom, avax, axs, bal, band, bat, bch, bigtime, blur, cake, celo, cfx, chz, ckb, comp, crv, cvx, cyber, dash, doge, dot, dydx, egld, enj, ens, eos и т. д., fet, fil, flow, ftm, fxs, gala, gmt, gmx, grt, hbar, hot, icp, icx, Idu, imx, inj, iost, iotx, jasmy, jto, jup, kava, klay, ksm, ldo, ссылка, ткацкий станок, lpt, lqty, lrc, ltc, luna 2, магия, мана, манта, маска, matic, мем, мина, mkr, рядом, нео, nfp, океан, один, ont, op, ordi, pendle, pyth, qnt, qtum, rndr, Robin, Rose, Rune, RVN, Sand, Sei, sfp, skl, snx, ssv, stg, storj, stx, sui, sushi, sxp, theta, tia, trx, t, uma, uni, vet, waves, wif, wld, woo,xai, xem, xlm, xmr, xrp, xtz, yfi, zec, zen, zil, zrx ] 30-дневная пропорция каждого индикатора ширины
На прошлой неделе цены на Bitcoin (BTC) и Ethereum (ETH) росли в течение 6 дней подряд, в то время как волатильность и объем торгов этих двух криптовалют достигли самого высокого уровня, когда они выросли 16 июля. Открытый интерес к Bitcoin и Ethereum снижается. Кроме того, подразумеваемая волатильность Bitcoin и Ethereum также выросла одновременно. Ставка финансирования Bitcoin остается на низком уровне, что может отражать сохраняющиеся настроения участников рынка относительно низкого кредитного плеча по отношению к Bitcoin. Индикаторы широты рынка показывают, что большинство криптовалют восстановились и выросли, что указывает на то, что общий рынок отскочил от минимумов на прошлой неделе.
Твиттер: @ https://x.com/CTA_ChannelCmt
Веб-сайт: channelcmt.com
Эта статья взята из интернета: Отчет об исследовании настроений на рынке криптовалют (2024.07.12-07.19): Убийство Трампа привело к росту биткоина
Связанный: Декодирование Dar Open Network: Уровень инфраструктуры для следующего поколения игр Web3
В Dar Open Network мы твердо верим в преобразующую силу игр на блокчейне. Игры — это не только развлечение, но и расширение прав и возможностей игроков, революция в цифровой экономике и расширение границ технологических инноваций. По мере роста криптоиндустрии мы считаем, что игры на блокчейне станут краеугольным камнем новой парадигмы в стимулировании принятия, креативности и цифрового взаимодействия. Наша команда стремится создать игровую платформу, которая будет служить разработчикам игр и игрокам. Мы не создаем новую цепочку, а строим экосистему. Руководствуясь этим видением, мы разработали Dar Open Network как инфраструктурный слой для будущих игр. Создание Dar Open Network продолжается уже шесть месяцев. Начиная с миссии предоставления комплексного решения, мы добились прогресса во многих аспектах…


