Приток спотовых ETF в США поражает воображение, так почему же BTC не вырос резко?
Оригинальный автор: CryptoVizArt, UkuriaOC, Glassnode
Оригинальный перевод: Дэн Тун, Золотые финансы
Краткое содержание
С появлением Runes Protocol возникло противоречащее здравому смыслу расхождение между уменьшением количества активных адресов и увеличением количества транзакций.
На балансе основных токенизирующих организаций теперь находится около 4,23 млн BTC, что составляет более 271 трлн. трлн. скорректированного предложения, а на балансе спотовых ETF США теперь находится 862 000 BTC.
Спотовые и хедж-структуры, по-видимому, являются существенным источником спроса на приток ETF, при этом ETF используются в качестве инструмента для получения длинных спотовых позиций, в то время как чистые короткие позиции по биткоину на фьючерсных рынках CME Group растут.
Уменьшение количества активных адресов и увеличение объема сетевых транзакций
Показатели активности в цепочке, такие как активные адреса, транзакции и объем транзакций, представляют собой ценный инструментарий для анализа роста и производительности сетей блокчейнов. Когда в середине 2021 года были введены ограничения на майнинг биткоинов, количество активных адресов в сети биткоинов резко сократилось с более чем 1,1 миллиона в день до всего лишь около 800 000 в день.
В настоящее время сеть Bitcoin переживает похожее сокращение сетевой активности, хотя и вызванное совершенно другими факторами. В следующих разделах мы рассмотрим, как появление надписей, ординалов, BRC-20 и рун может существенно изменить то, как аналитики на цепочке рассматривают будущие показатели активности.
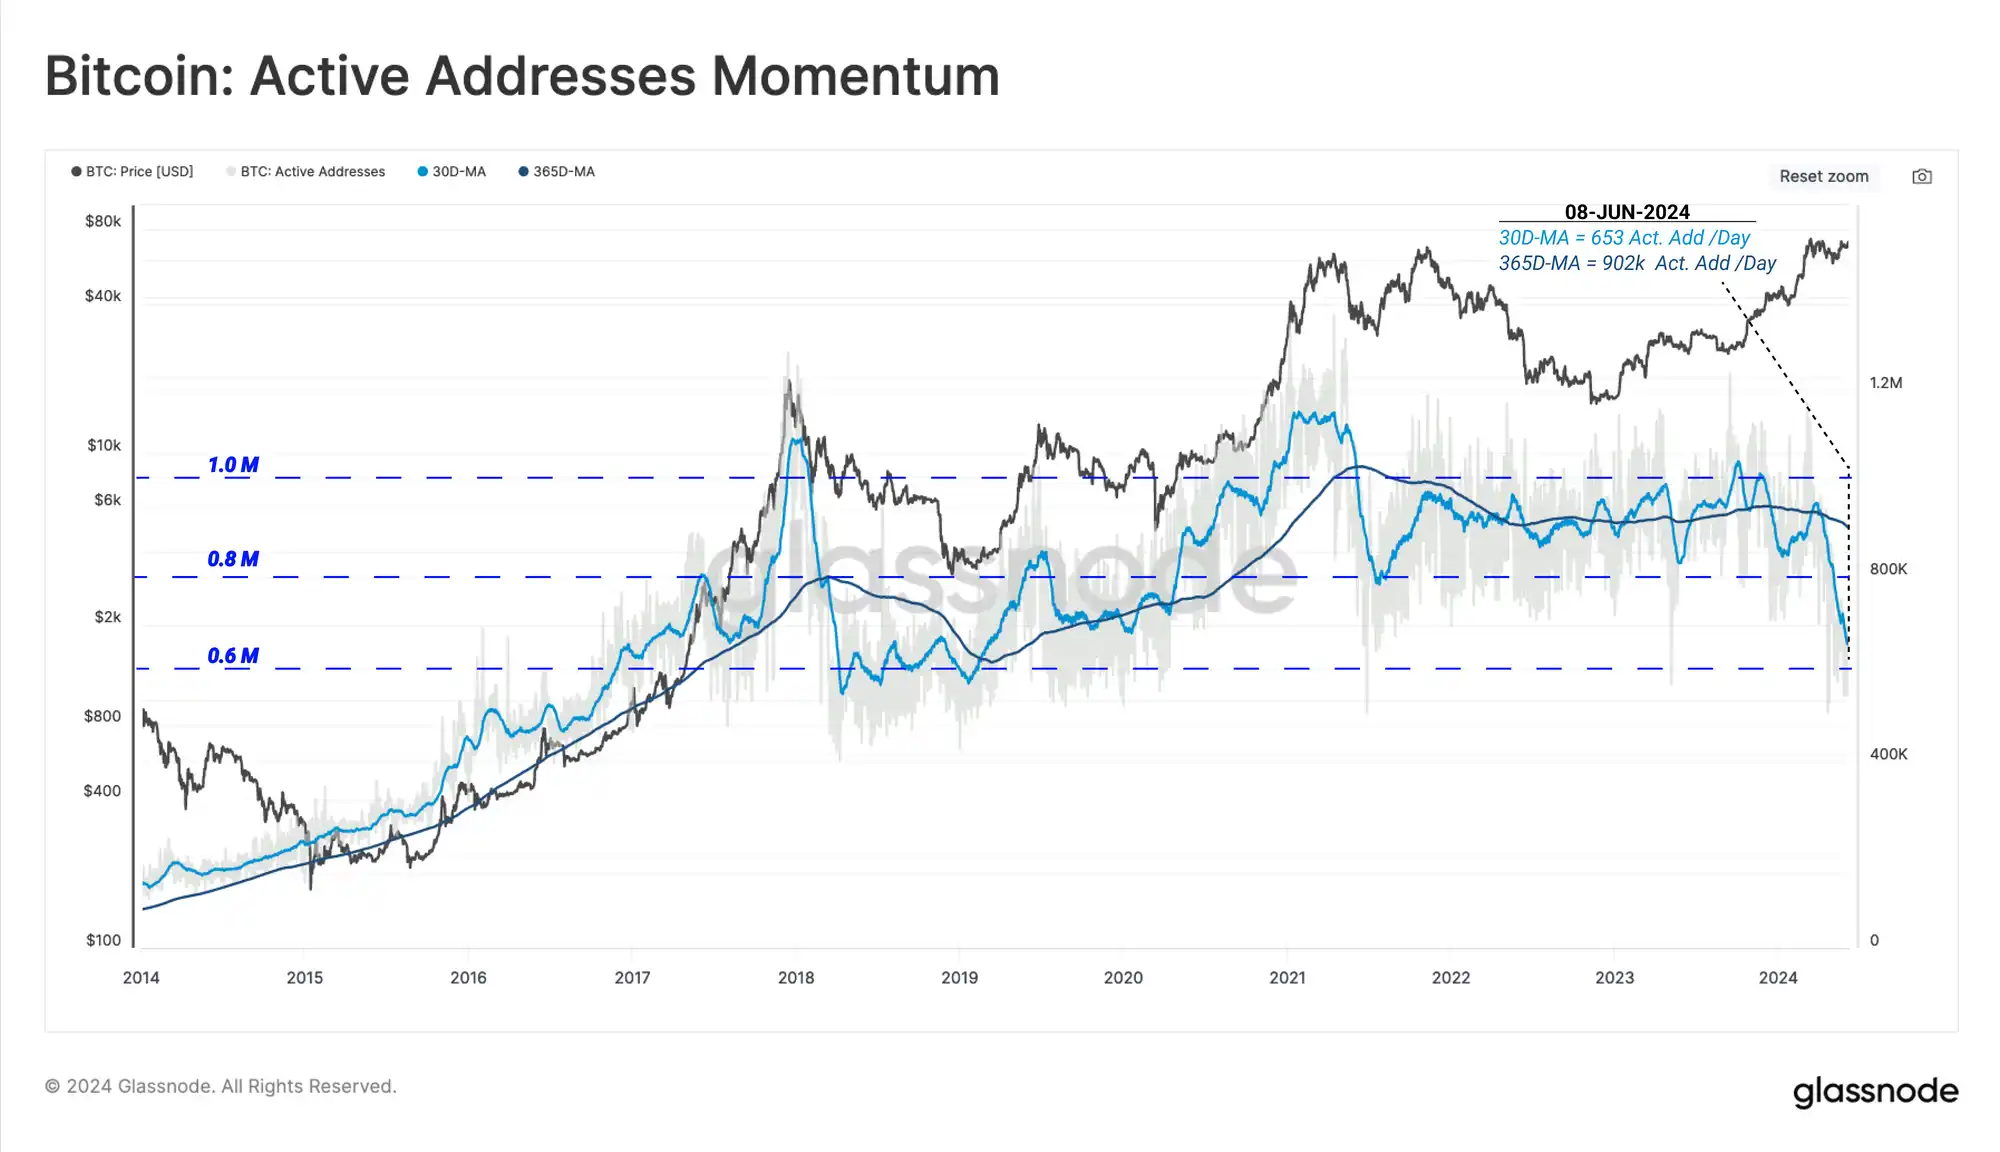
Несмотря на сильную рыночную динамику, рост активных адресов и ежедневного объема транзакций, эта тенденция отклоняется.
В то время как активные адреса, по-видимому, снижаются, количество транзакций, обработанных сетью, приближается к рекордным максимумам. Текущее среднемесячное значение в 617 тыс. транзакций в день на 31% выше среднегодового значения, что указывает на относительно высокий спрос на пространство блока Bitcoin.
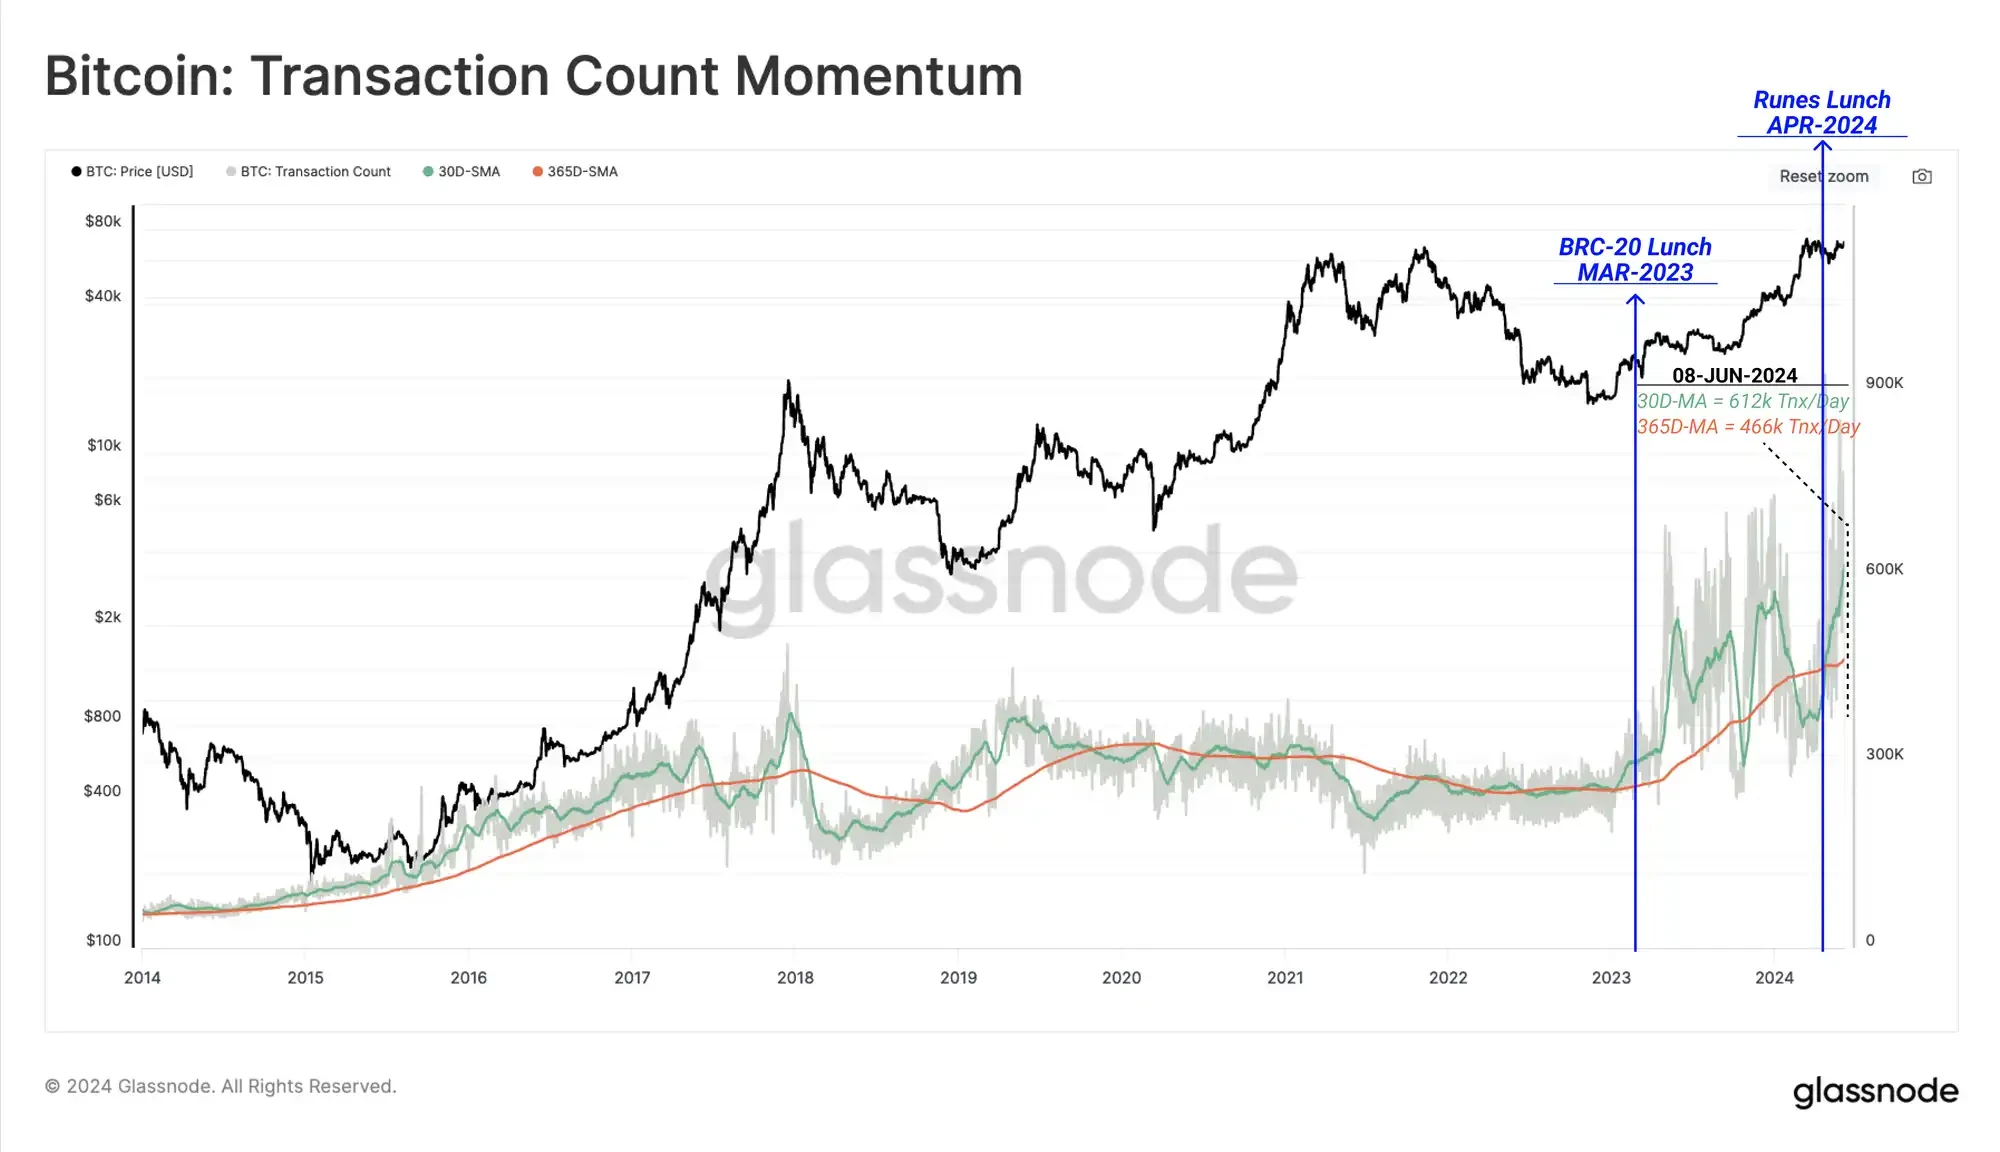
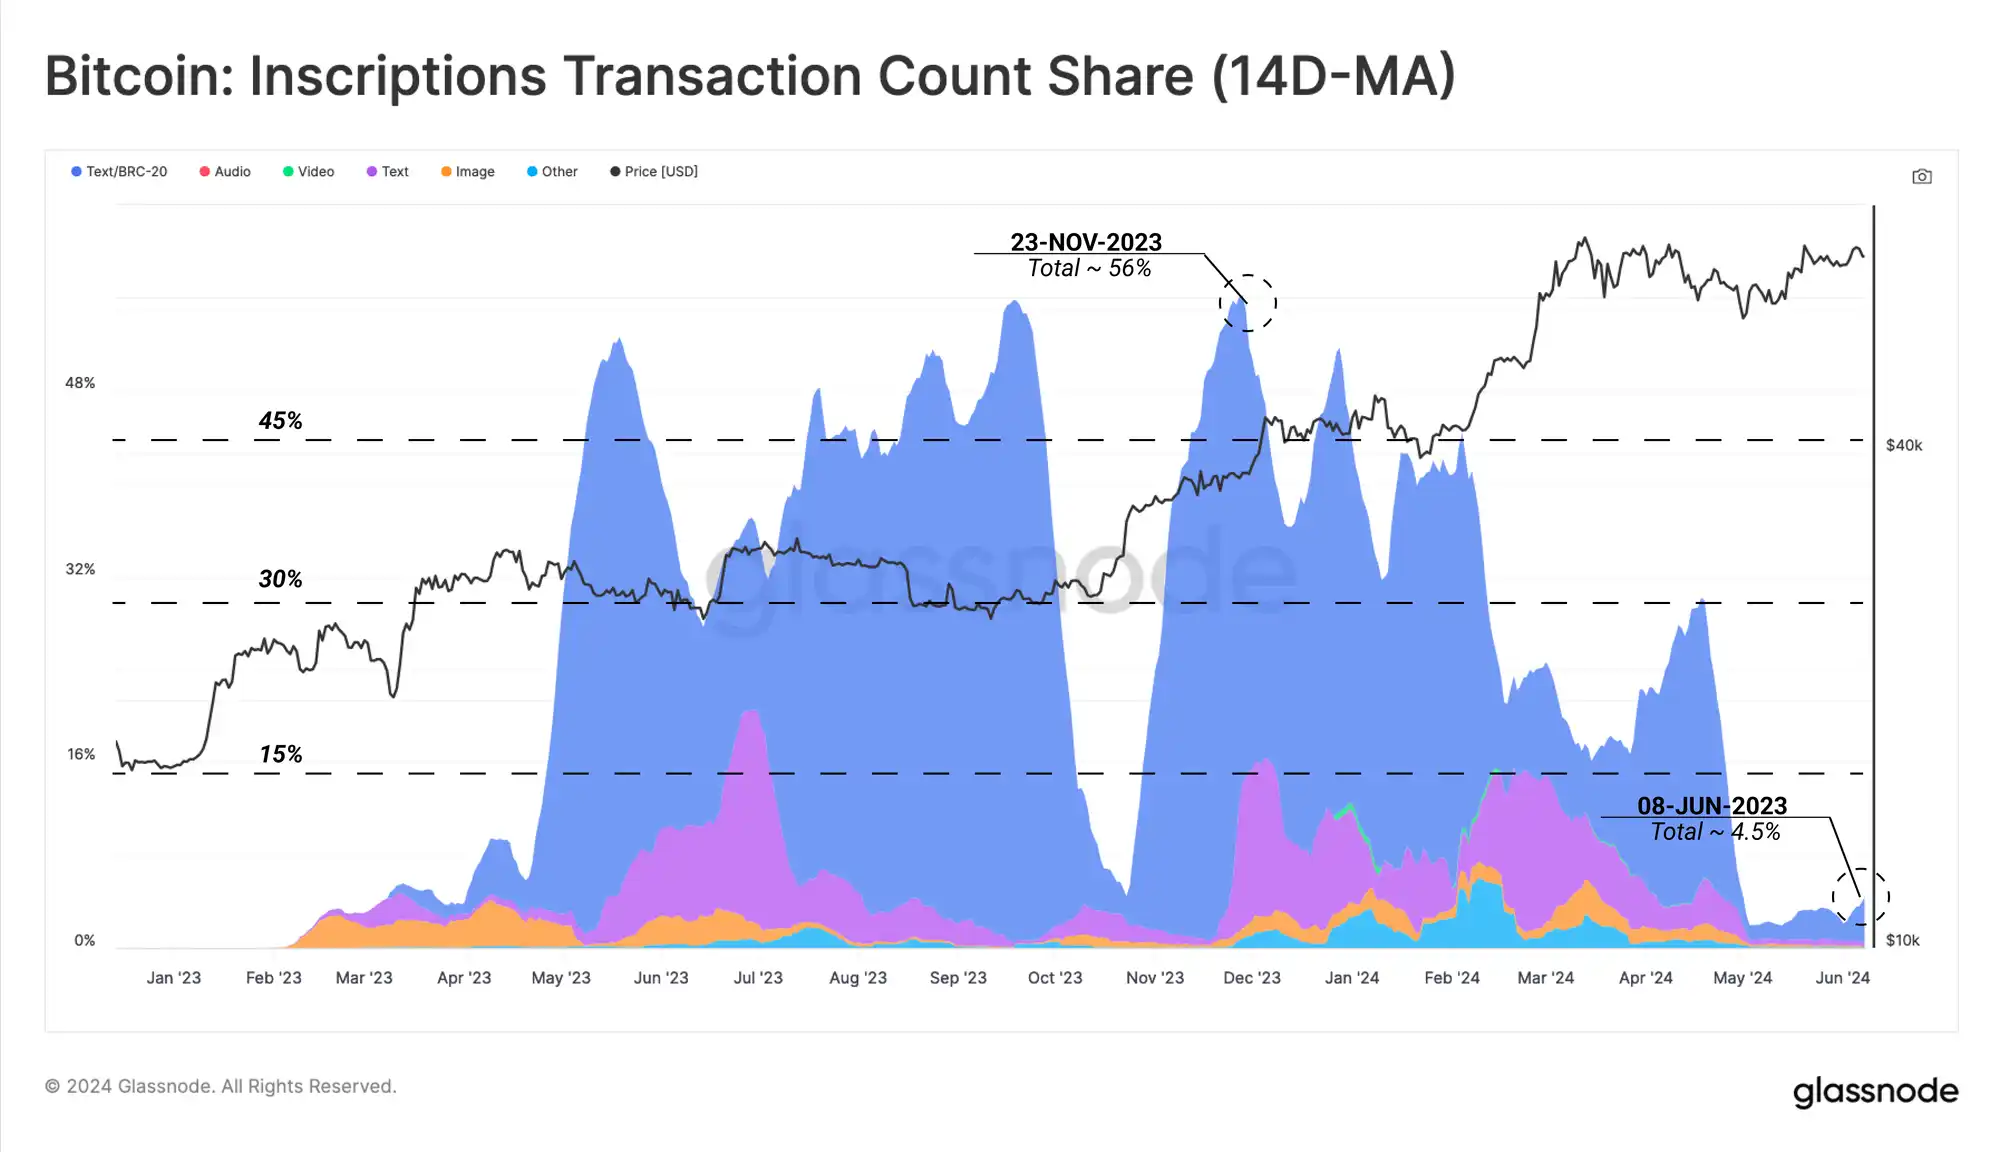
Если сравнить недавнее падение активных адресов с надписями и долю транзакций токенов BRC-20, то можно заметить сильную корреляцию. Стоит отметить, что количество надписей также резко упало с середины апреля.
Это говорит о том, что Первоначальным фактором снижения активности адресов было в первую очередь сокращение использования надписей и порядковых числительных. Важно отметить, что многие кошельки и протоколы в отрасли повторно используют адреса и не учитывают адреса дважды, если они активны больше одного раза в день. Поэтому, если адрес генерирует десять транзакций в день, он будет отображаться как один активный адрес, но на самом деле имеет десять транзакций.
Чтобы проиллюстрировать, как росло количество надписей с начала 2023 года, мы можем увидеть, как увеличилось общее количество кумулятивных надписей. На момент написания статьи количество записей достигло 71 миллиона, однако популярность протокола существенно упала с середины апреля этого года.
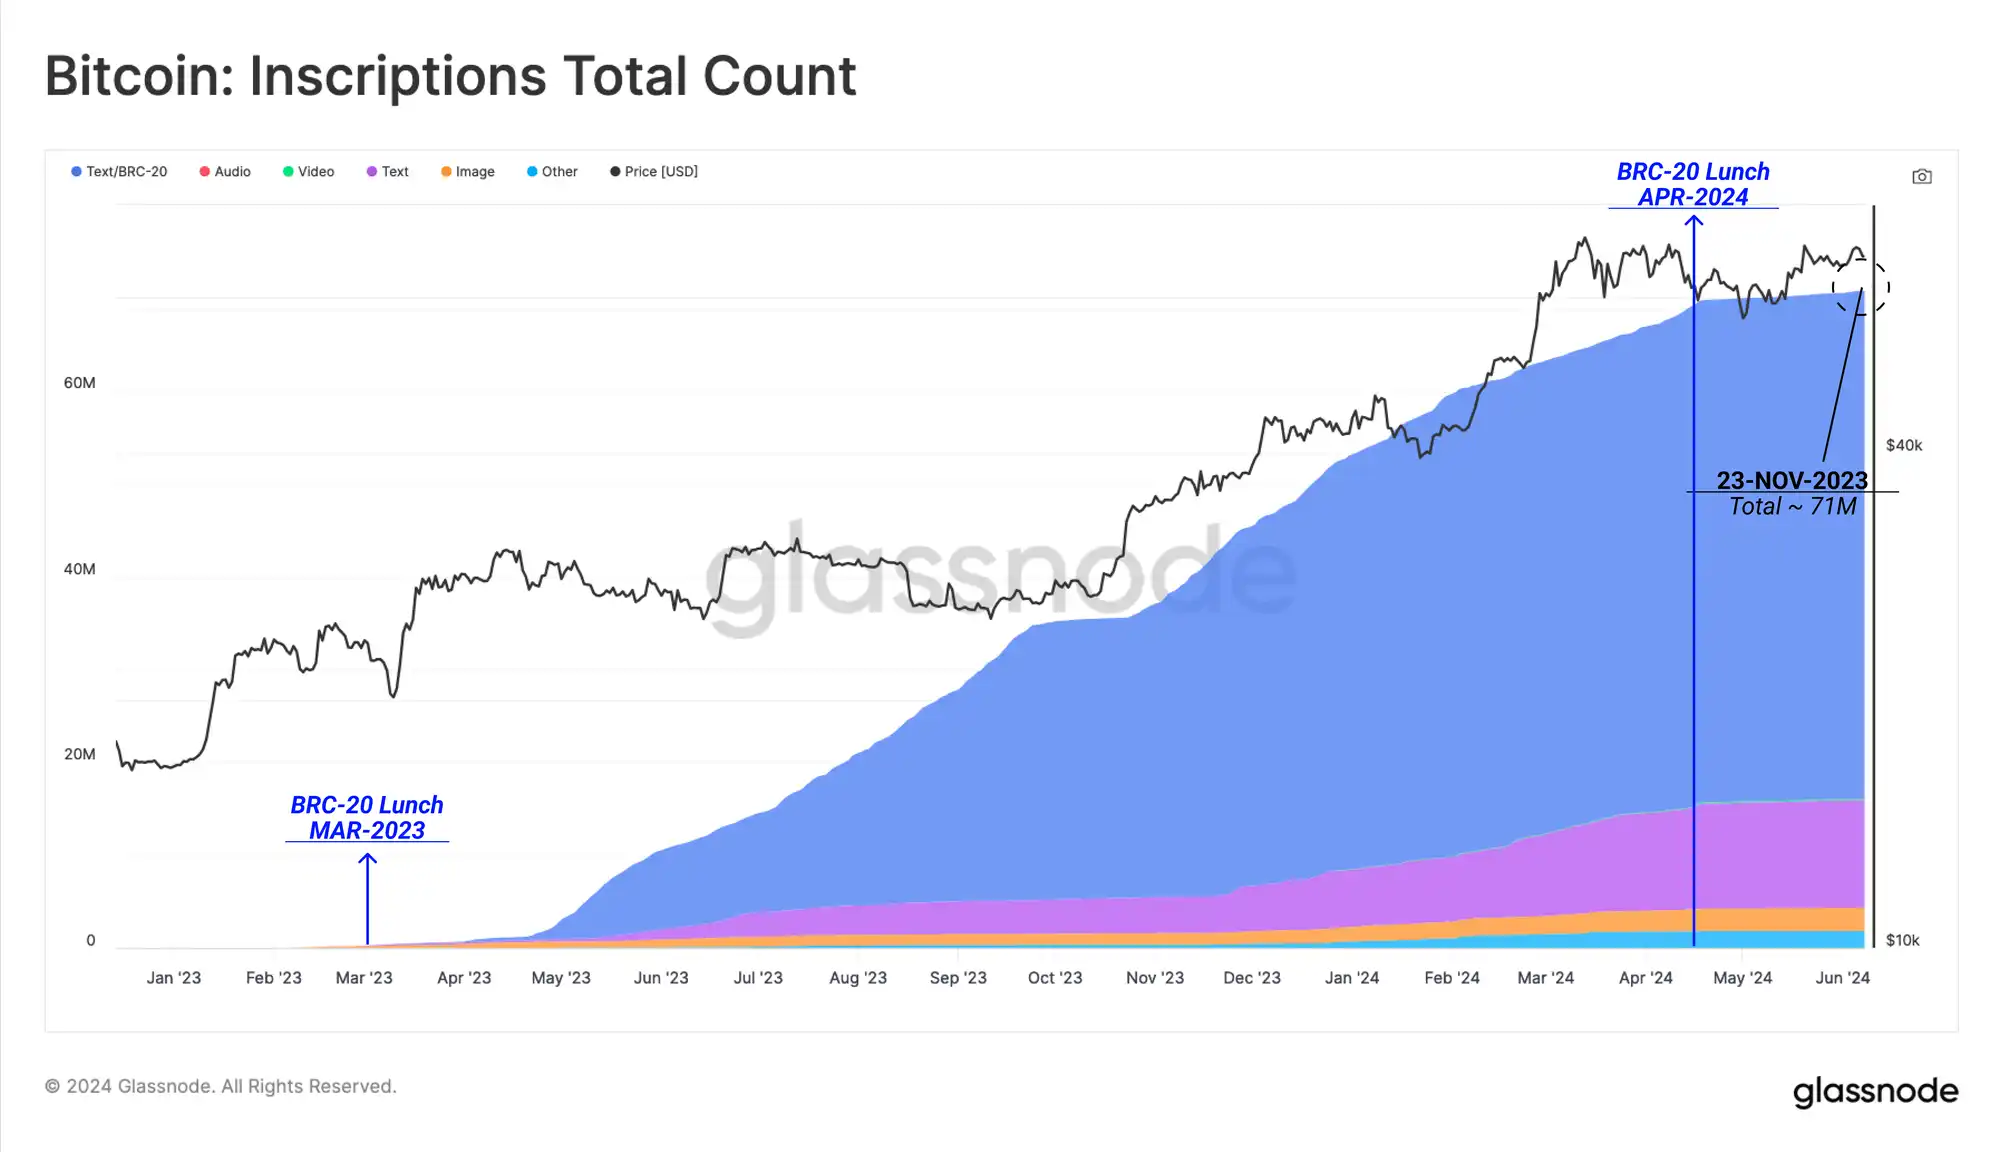
Чтобы объяснить падение активности надписей, мы должны подчеркнуть появление протокола Runes, который претендует на более эффективный способ введения взаимозаменяемых токенов на Bitcoin. Runes заработал на халвинг-блоке, что объясняет падение активности надписей в середине апреля.
Руны следуют другому механизму, чем надписи и токены BRC-20, используя поле OP_RETURN (80 байт). Это позволяет протоколу кодировать произвольные данные в цепочку, требуя при этом меньше места для блока.
С запуском протокола Runes во время халвинга (20 апреля 2024 г.) спрос на транзакции Runes резко возрос до 600 000–800 000 в день и с тех пор остается высоким.
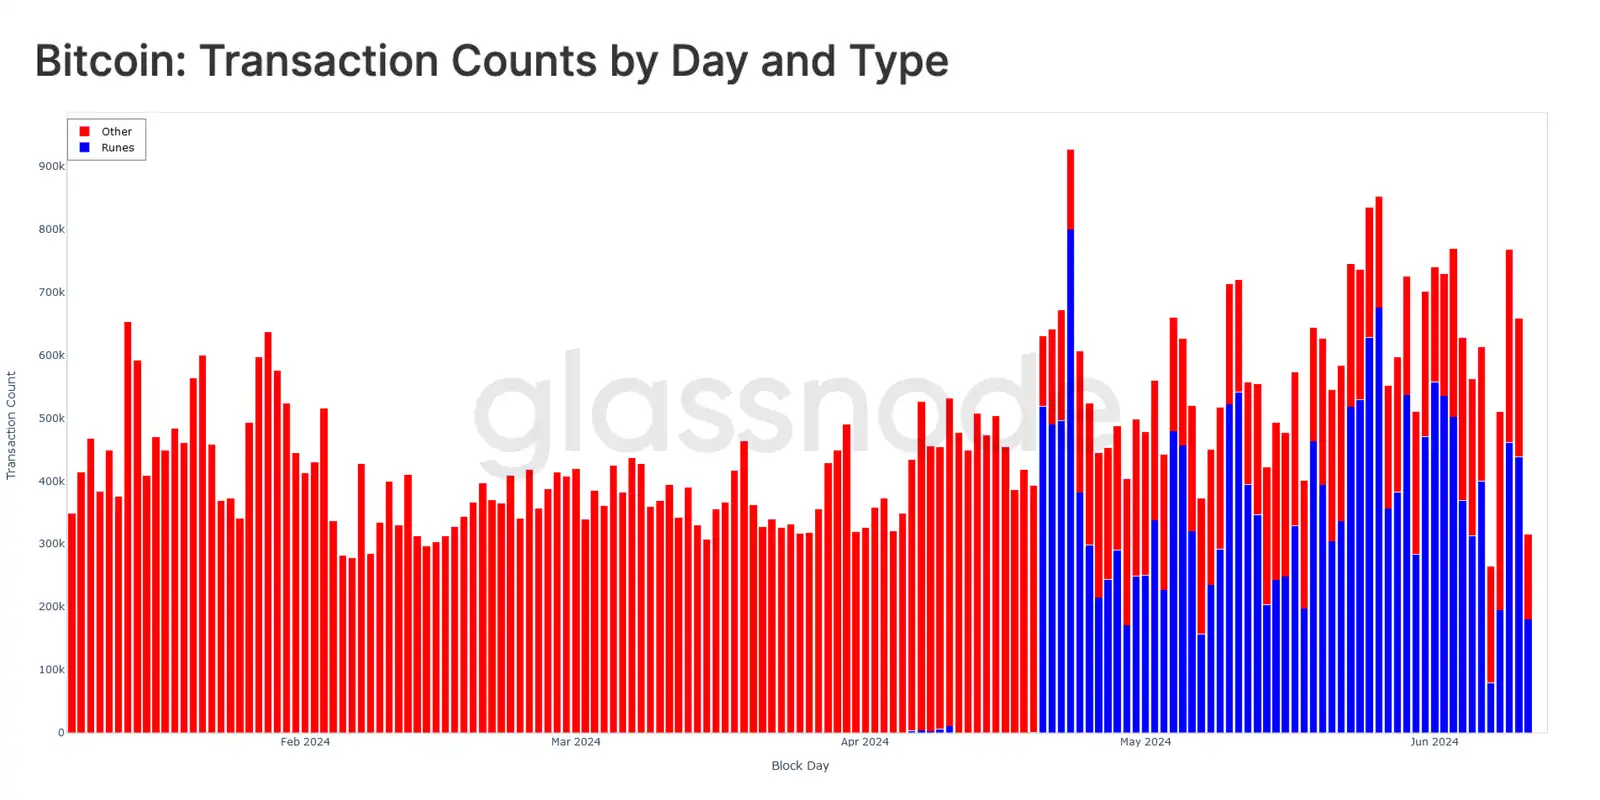
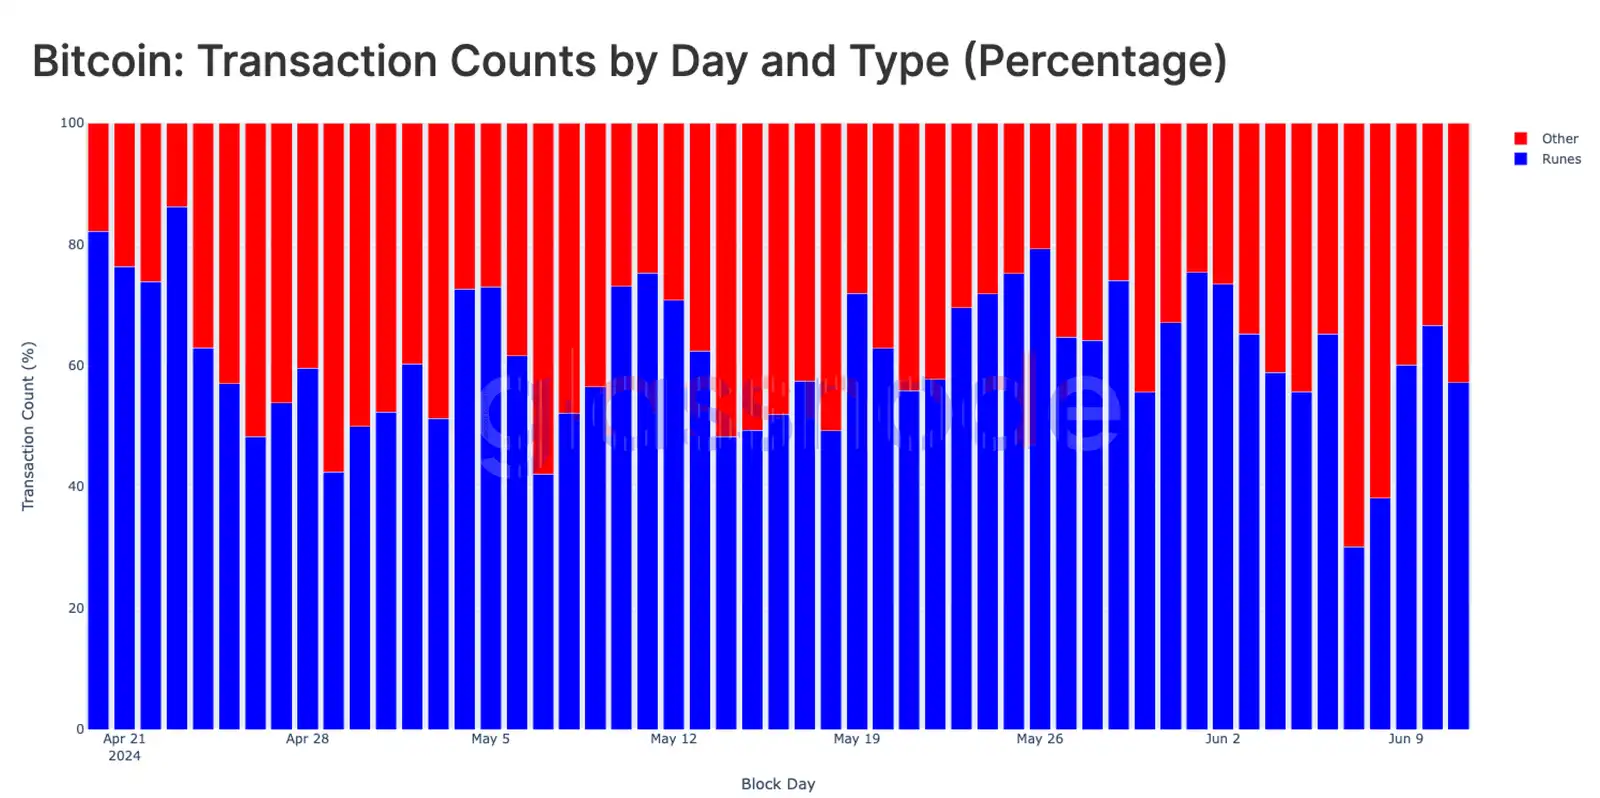
Транзакции, связанные с рунами, в настоящее время в значительной степени заменили токены BRC-20, а также ординалы и надписи, составляя 57,2% ежедневных транзакций. Это говорит о том, что спекуляции коллекционеров могли переключиться с надписей на рынок рун.
Спрос на ETF расходится
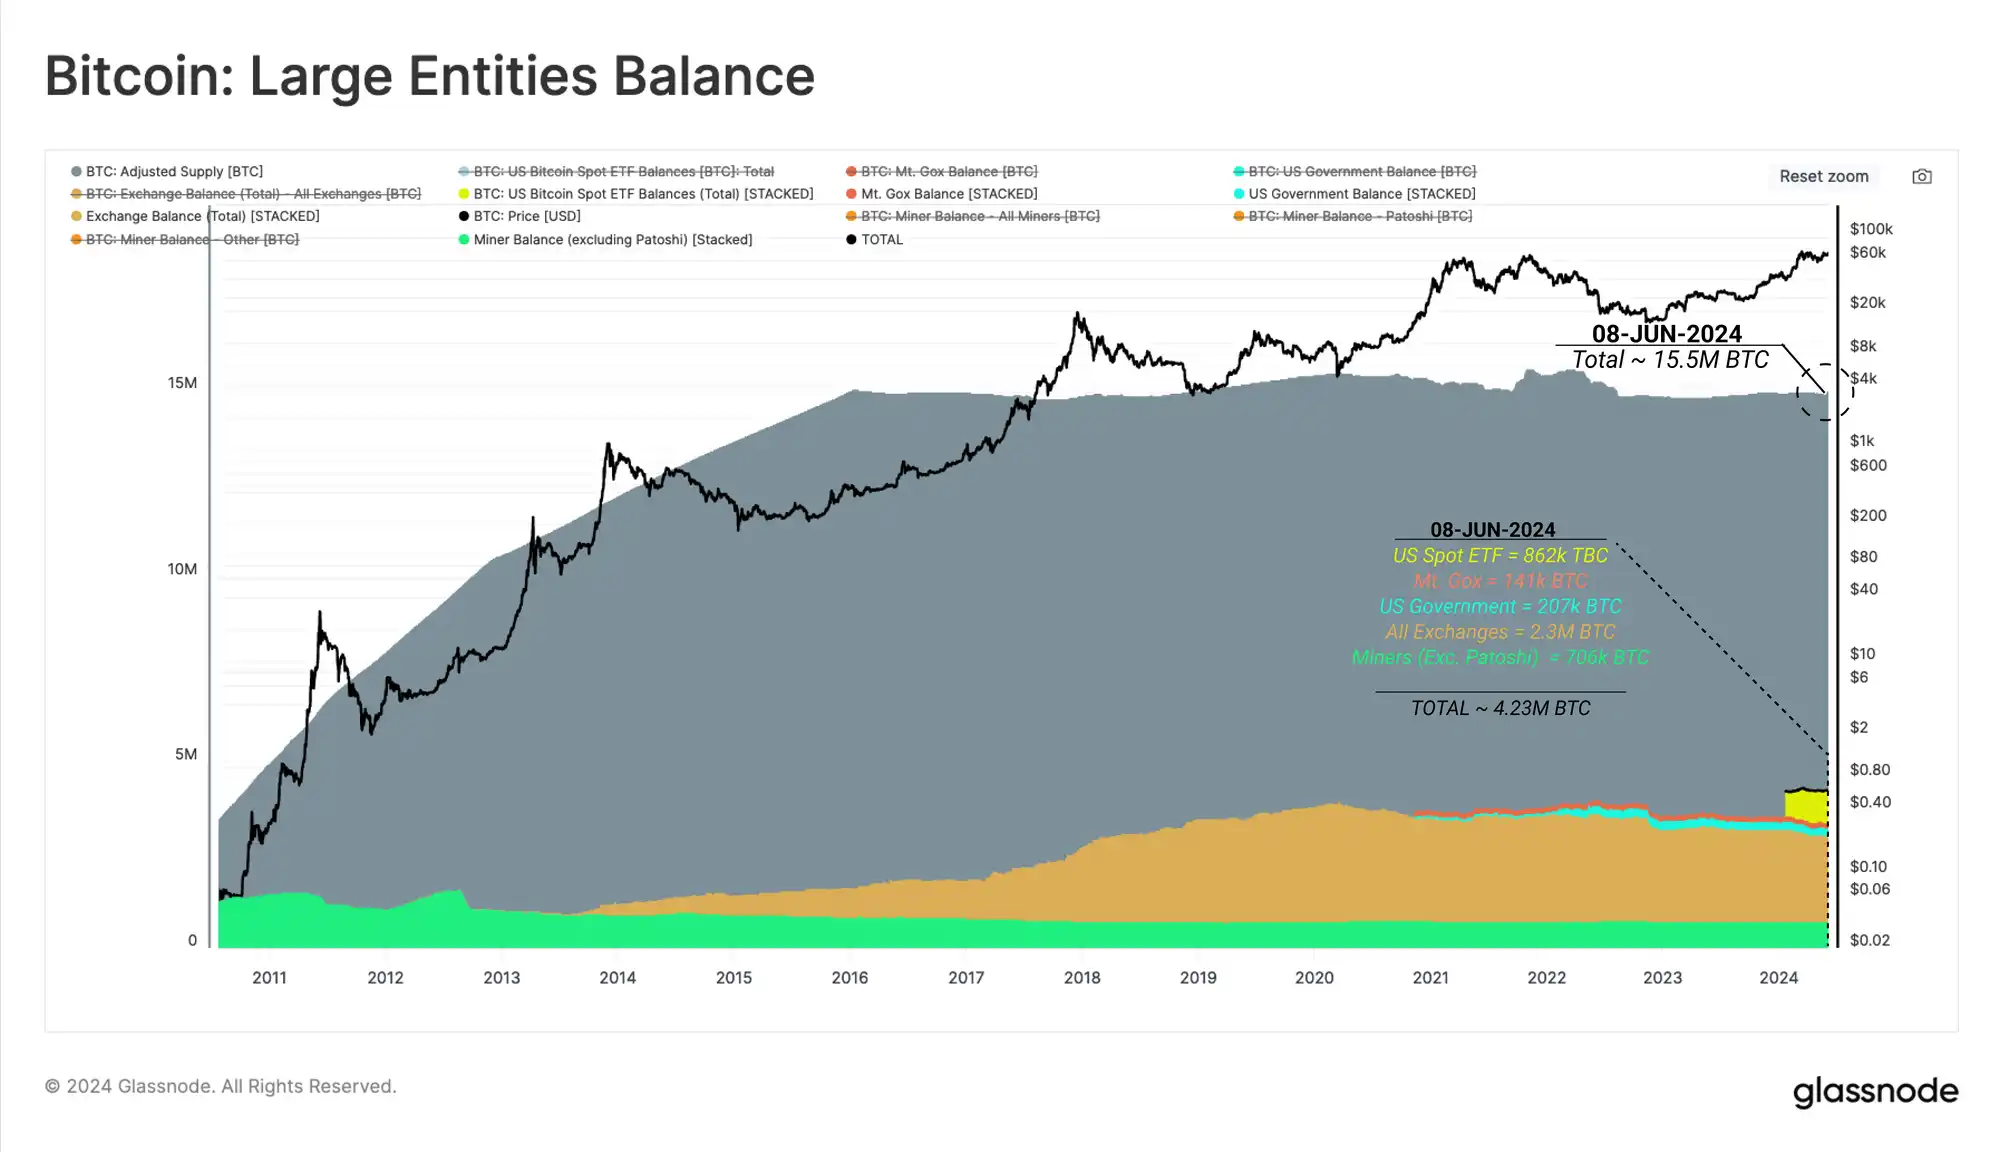
Другое расхождение, которое недавно привлекло внимание, заключается в том, что, несмотря на ошеломляющие притоки в спотовые ETF США, цены стагнируют и движутся вбок. Чтобы определить и оценить сторону спроса ETF, мы можем сравнить балансы ETF (862 тыс. BTC) с другими крупными субъектами.
Спотовый ETF США = 862 тыс. BTC
Доверительный управляющий Mt. Gox = 141 тыс. BTC
Правительство США = 207 тыс. BTC
Все биржи = 2,3 миллиона BTC
Майнеры (без Patoshi) = 706 тыс. BTC
Совокупный баланс всех этих субъектов оценивается примерно в 4,23 миллиона, или 27% от общего скорректированного оборотного предложения (т.е. общего предложения за вычетом токенов, которые простаивали более семи лет).
Coinbase как организация держит большую часть общих биржевых балансов, а также балансов спотовых ETF США через свой кастодиальный сервис. Биржа Coinbase и кастодиальный орган Coinbase в настоящее время держат приблизительно 270 000 и 569 000 BTC соответственно.

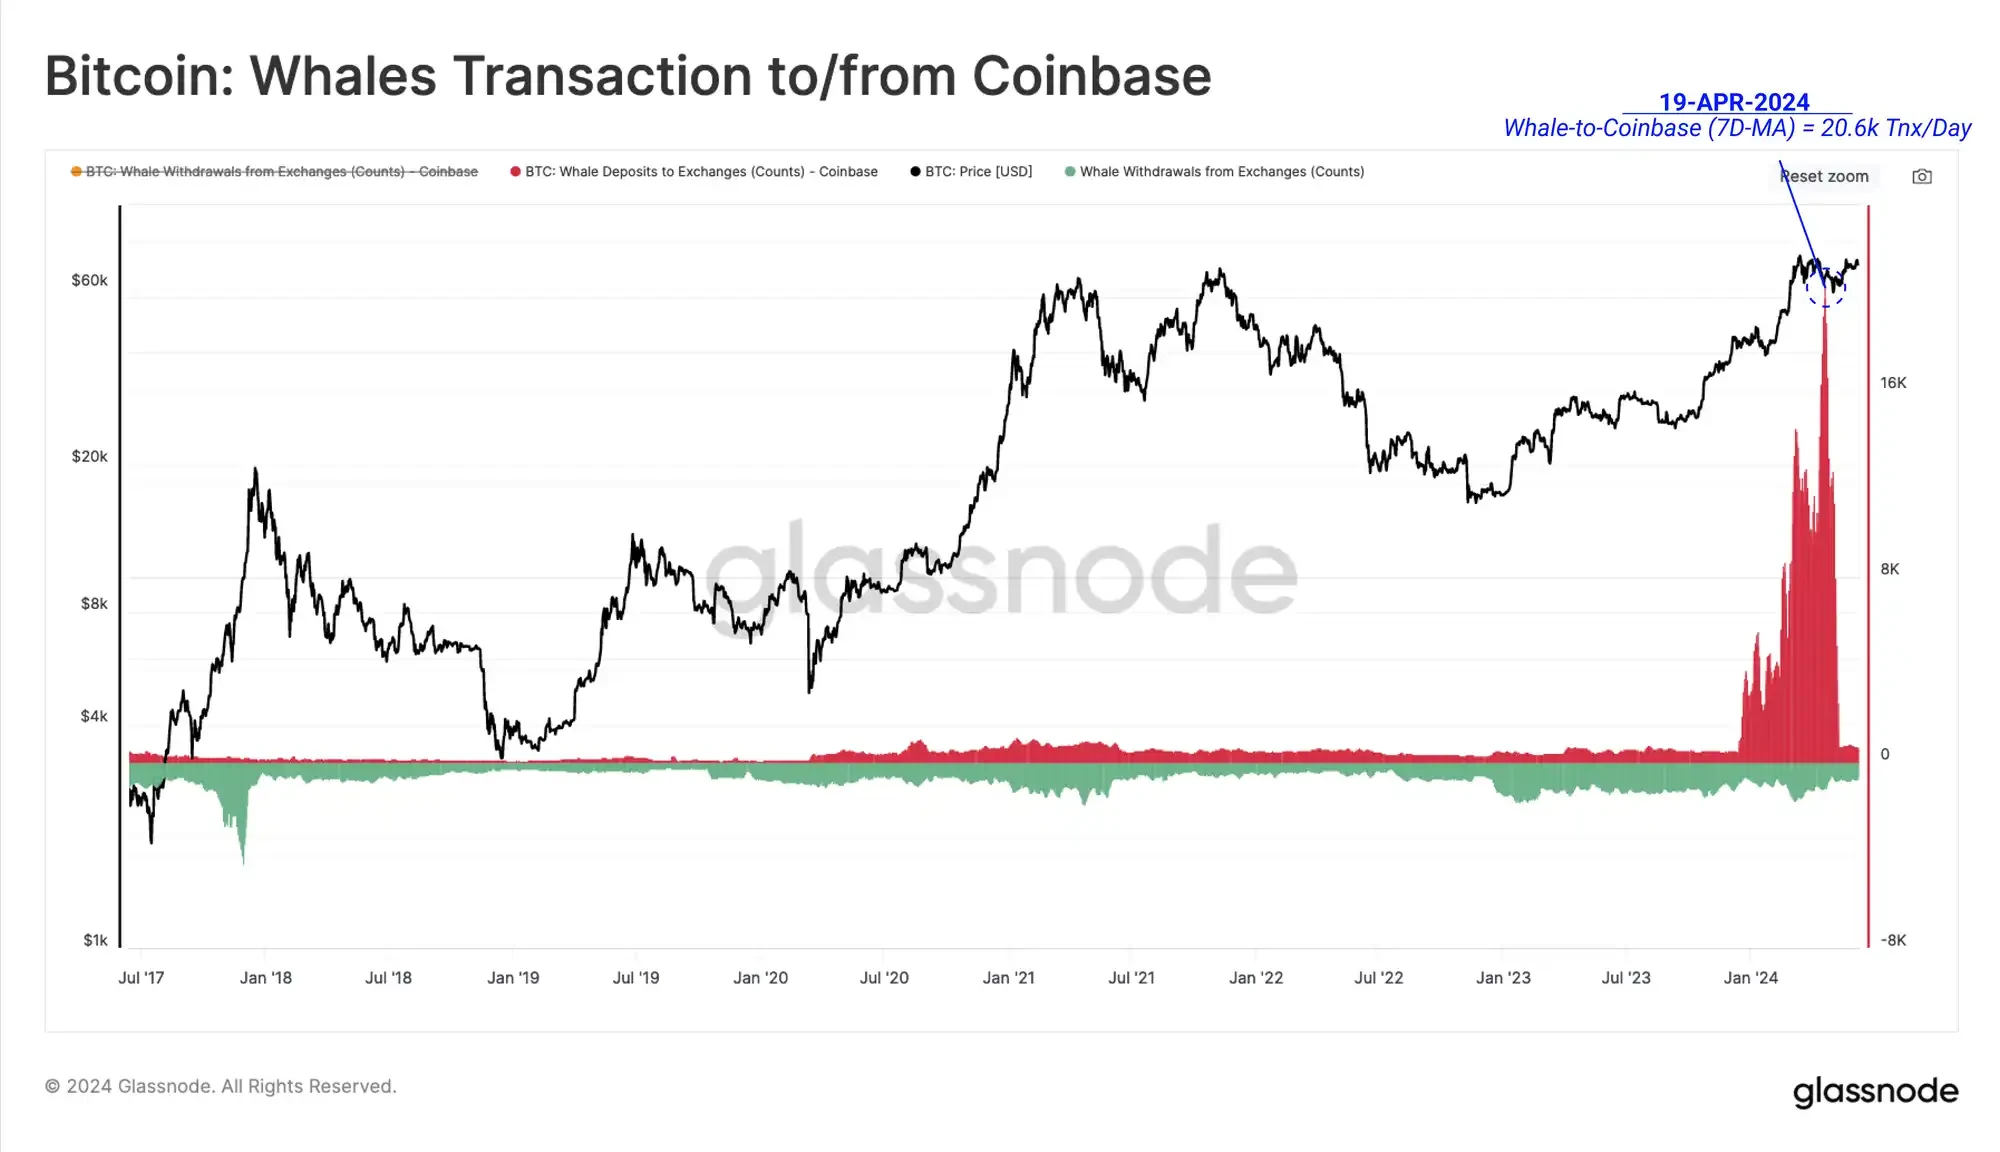
Поскольку Coinbase обслуживает как клиентов ETF, так и традиционных держателей активов в цепочке, важность бирж в процессе ценообразования на рынке стала очевидной. Оценивая количество китов, вносящих депозиты в биржевой кошелек Coinbase, мы можем увидеть значительное увеличение объема депозитов после запуска ETF.
Однако мы отмечаем, что значительная часть депозитов связана с оттоком средств из адресного кластера GBTC, который в течение всего года являлся источником накладных расходов.
Помимо давления со стороны продавцов на GBTC, вызванного ростом рынка до новых максимумов, существует еще один фактор, который недавно привел к ослаблению давления спроса на спотовые ETF США.
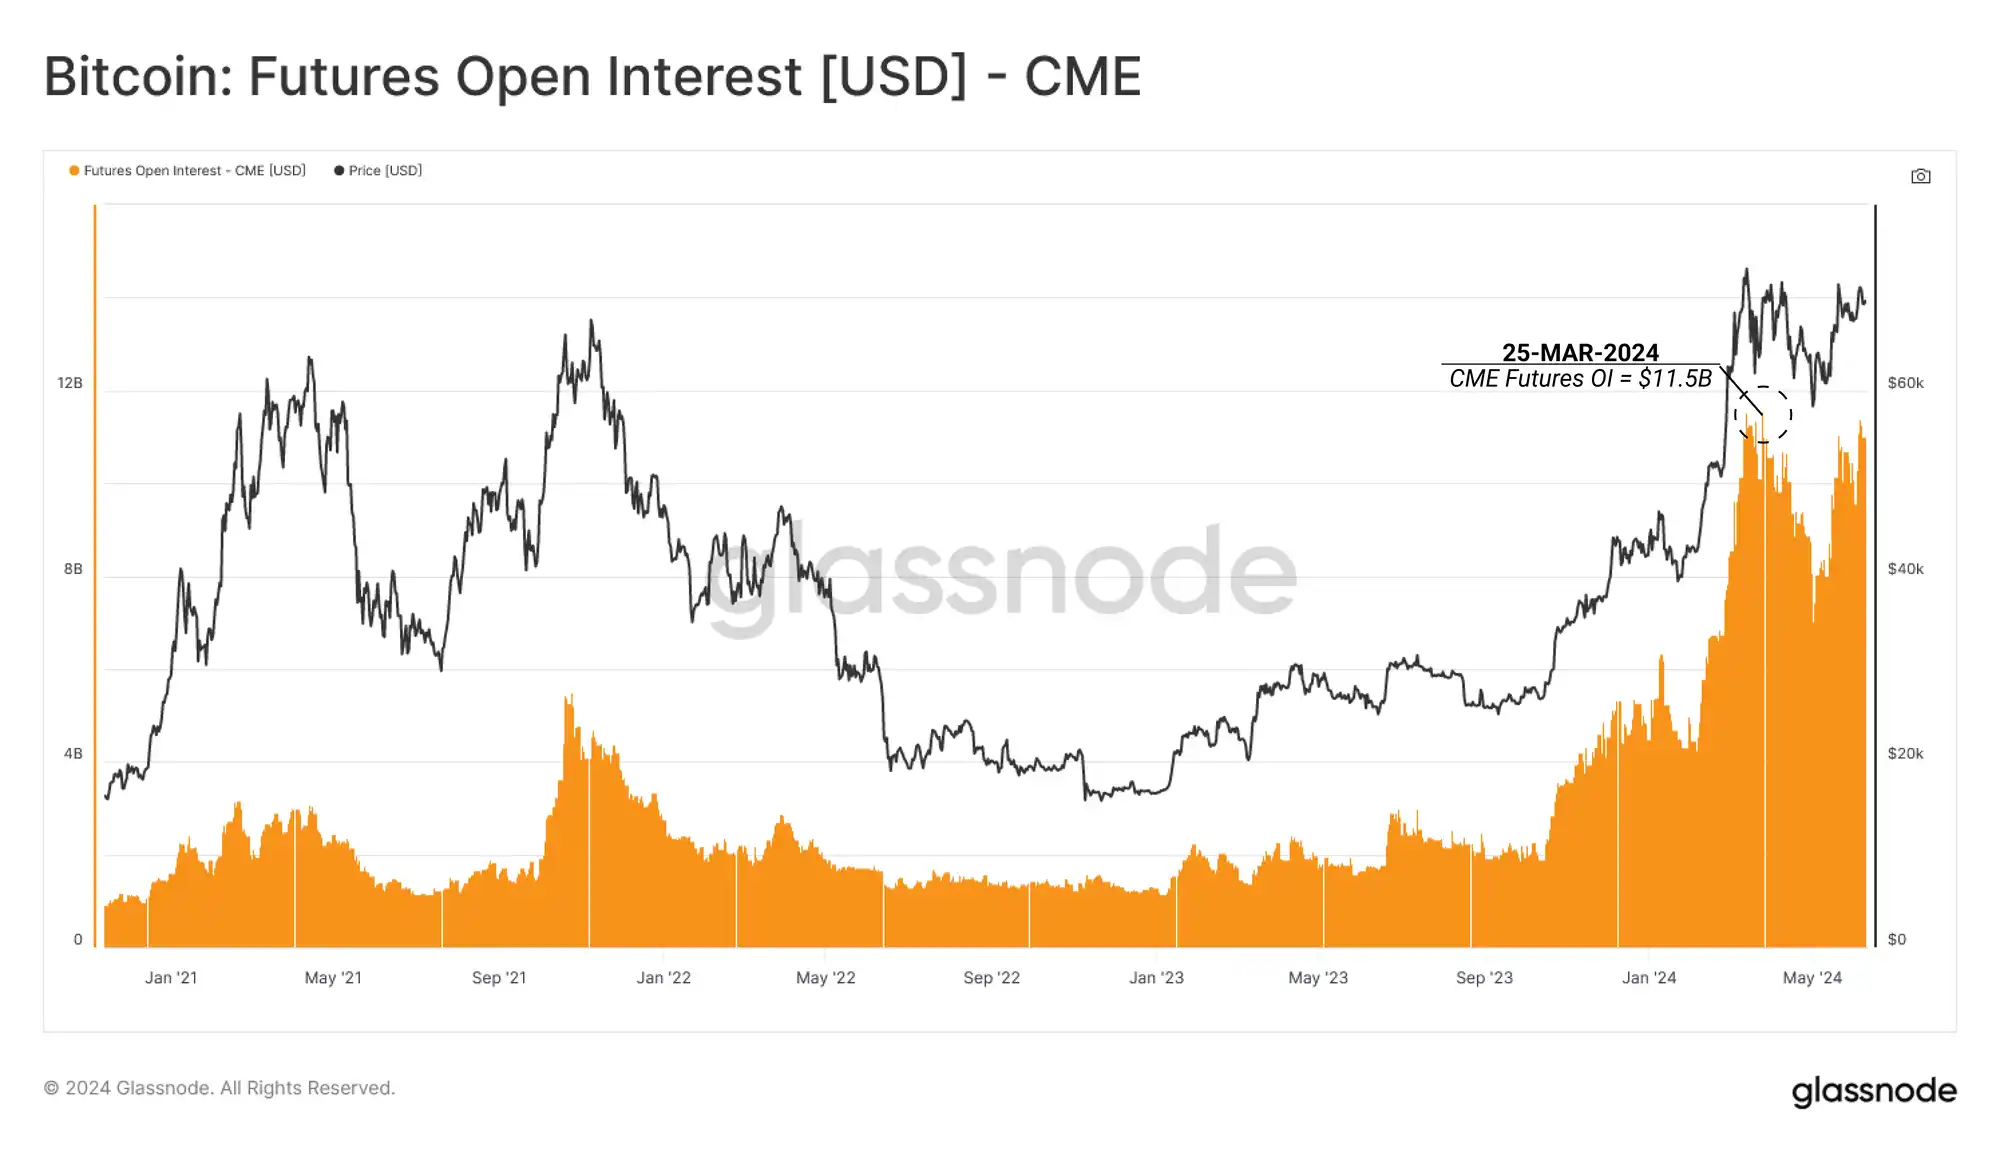
На фьючерсных рынках CME Group открытый интерес стабилизировался на уровне выше $8 млрд, достигнув ранее исторического максимума в $11,5 млрд в марте 2024 года. Это может быть признаком того, что более традиционные рыночные трейдеры переходят на стратегии спотового арбитража.
Этот тип арбитража подразумевает рыночно-нейтральную позицию, которая сочетает покупку длинной спотовой позиции с продажей (короткой) фьючерсной контрактной позиции на тот же базовый актив, который торгуется с премией.
Мы видим, что организации, классифицируемые как хедж-фонды, формируют все более крупные чистые короткие позиции по биткоину.
Это говорит о том, что структуры спотовой торговли, где ETF являются средством получения долгосрочной спотовой экспозиции, могут стать существенным источником спроса на приток ETF. CME Group также отметила значительный рост открытого интереса и общего доминирования на рынке с 2023 года, что позволяет предположить, что она становится предпочтительным местом для хедж-фондов для коротких позиций по фьючерсам через CME.
В настоящее время хедж-фонды имеют чистую короткую позицию в размере $6,33 млрд и $97 млн на рынках CME Bitcoin и Micro CME Bitcoin соответственно.

Подведем итог
Огромное расхождение между показателями активности усугубляется чрезвычайной популярностью протокола Runes, который использует большое количество повторных адресов, при этом один адрес генерирует несколько транзакций.
Появление и размер спотовых арбитражных сделок между длинными продуктами ETF наличными США и короткими фьючерсами через CME Group в значительной степени сдержали приток покупателей в ETF. Это оказало относительно нейтральное влияние на рыночные цены, что говорит о том, что для дальнейшего стимулирования позитивного ценового действия необходимы органические покупатели из неарбитражного спроса.
Эта статья взята из интернета: Приток спотовых ETF в США поражает, так почему же BTC не вырос резко?
По теме: Ethereum (ETH) сохраняет стойкость к ралли до $4,000
Вкратце Цена Ethereum продолжает движение в рамках нисходящего клина, нацелившись на ралли до $4,000. Чистое изменение позиции ETH на бирже является синонимом начала ралли, отмеченных в прошлом. Коэффициент MVRV указывает на то, что ETH находится в идеальной зоне покупки, что может помочь Ethereum избежать клина. Цена Ethereum (ETH) пережила судьбу, похожую на судьбу остального рынка криптовалют, когда альткоин опустился ниже $3,000. Однако это только еще раз подтвердило бычий паттерн, в котором застрял ETH. Приближаясь к потенциальному прорыву в течение следующих нескольких торговых сессий, альткоин демонстрирует идеальные условия для накопления. Продажа Ethereum замедляется Инвесторам необходимо проявить оптимизм в отношении существенного отскока цены Ethereum, как это видно по частям…