My XP
0
Login
원저자: Biteye 핵심 기여자 Viee
원편집자: Biteye 핵심 기여자 Crush
Today the market opened lower and closed down 6 points, which cooled down the recent stock market heat.
How crazy is the stock market? I believe everyone has seen it.
The Shanghai Composite Index experienced a strong surge of more than 600 points in 9 trading days before the holiday.
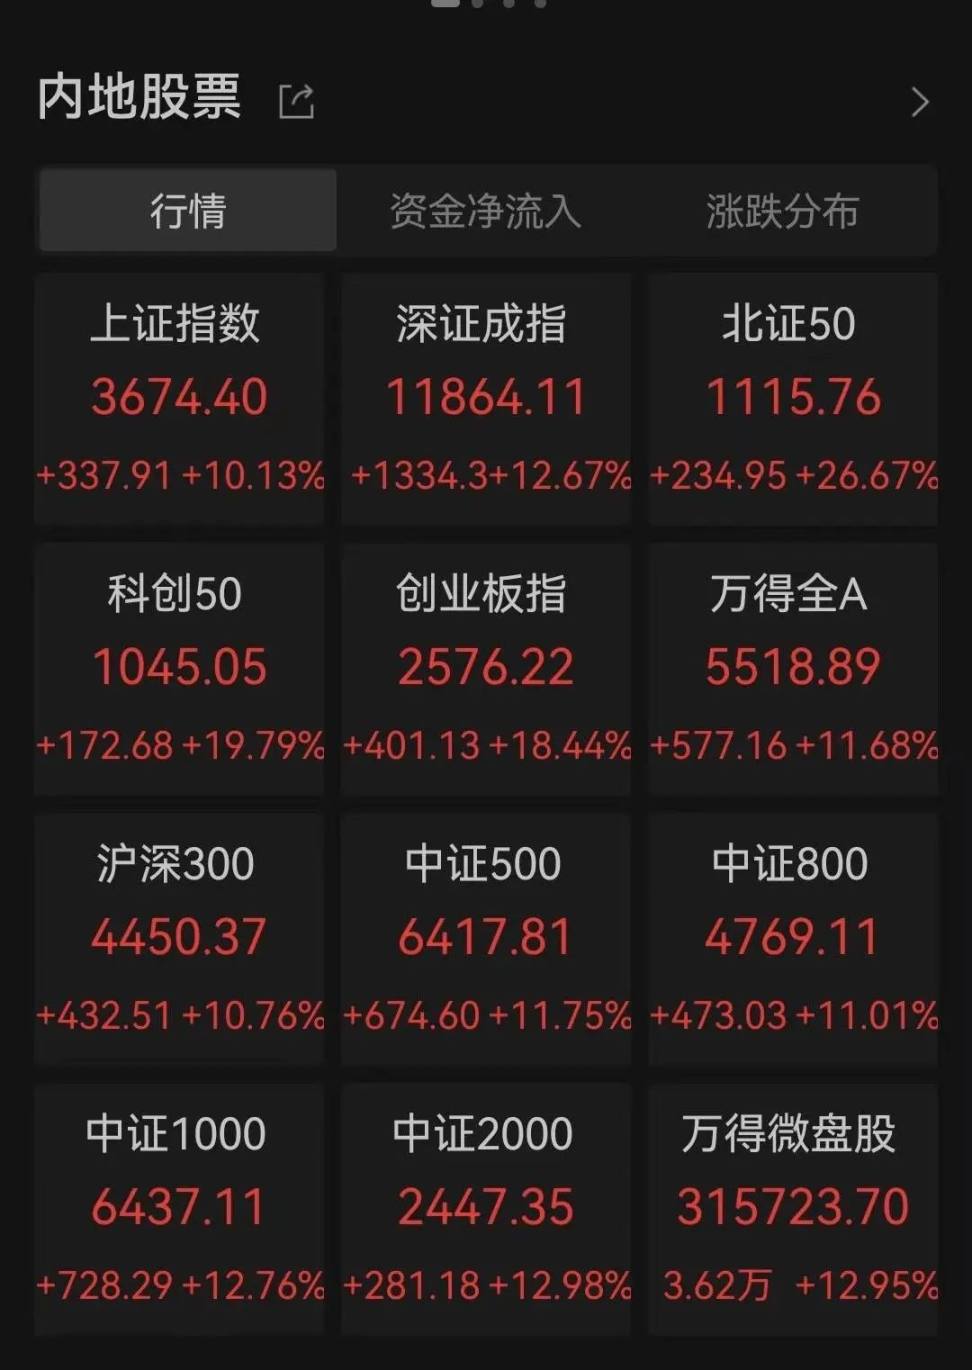
After the holiday, the three major indexes opened higher, with an increase of 10%
The transaction volume exceeded 3.45 trillion yuan, setting a new historical high
Foreign investors rushed in to join the buying spree
The Hang Seng Index has risen 35.5% so far this year, leading the worlds major stock markets
The highest increase in individual Hong Kong stocks once reached 730%, comparable to Dogecoin in the cryptocurrency circle!
The crypto market has also benefited from this wave of popularity:
The largest stablecoin USDT (Tether) in the cryptocurrency world is being sold off at a discount
It seems to have become a hot potato in the hands of investors who are eager to exchange it back to legal currency.
I didn鈥檛 expect that the headline about the linkage between A-shares and the cryptocurrency circle would be: A-shares suck the blood of the cryptocurrency circle
On the first trading day after the holiday, the A-share market was extremely hot, and the three major indexes rose collectively. Just 20 minutes after the opening, the transaction volume exceeded 1 trillion yuan, and the increase exceeded 10% at the opening. More than 5,000 stocks rose, of which nearly 1,000 stocks hit the daily limit, and brokerage stocks soared across the board…
This magnificent market not only made investors excited, but also triggered heated discussions on the future market trend. How did the A-share market, which repeatedly triggered the 3,000-point defense battle, suddenly become successful?
Once upon a time, weak economic data and insufficient market confidence caused A-shares to fall into a slump. However, with strong policy support and the recovery of market sentiment, the market also responded strongly.
So, in this wave of rise, what signals indicate the coming of a bull market in A-shares?
Unprecedented policy strength: On September 24, the central bank and regulators jointly issued a package of easing policies, showing a strong intention to support the market. Governor Pan Gongshengs bold statement of 500 billion after 500 billion gave the market a shot in the arm.
Trading volume hits a new high: The trading volume on October 8 reached 3.45 trillion yuan, which not only broke the historical record, but also showed that the market activity has increased significantly. High trading volume is usually an important signal of the coming of a bull market, showing investors optimistic expectations for the market outlook.
Foreign capital flows into the market: Since the policy was released, Chinese stocks have generally risen, and many foreign institutions have expressed optimism about the Chinese stock market. This wave of capital inflow has injected new impetus into the market.
The overall valuation is still low: The overall valuation of A-shares is still relatively low, and the valuation percentile of the ChiNext Index is less than 8%, providing opportunities for medium- and long-term layout.
Brokerage firms are working overtime to attract customers: The number of investors opening new accounts is also surging. Data shows that on September 27, the net value of investors bank-to-securities transfers soared to 7.04, a three-and-a-half-year high. Brokerage firms even temporarily opened services during the National Day holiday to meet investor demand.

While the A-share market is hot, the crypto market seems a bit sluggish. After climbing to a two-month high of $66,500 on September 27, Bitcoin has fluctuated downward and has fallen to around $60,000 by early October.
Are new opportunities brewing in the crypto market? When will the bull market start? We can pay attention to the following signals:
Recently, the Federal Reserve announced a sharp interest rate cut of 50 basis points. The influx of incremental funds caused by the loosening of liquidity has driven the overall rise of the crypto market. Loose monetary policies are generally considered to be beneficial to speculative assets such as cryptocurrencies, so the market is optimistic about the future market. In addition, as the US employment data picks up, the market generally expects that it will further stimulate the rise of Bitcoin prices.
Incremental capital inflow is one of the important indicators for judging the bull market in the cryptocurrency circle.
ETF
The net inflows of Bitcoin spot ETFs have a significant impact on prices. Sustained net inflows indicate that the market demand for Bitcoin is increasing, and this positive sentiment tends to be reflected in the price, causing it to remain stable or rise.
On the contrary, if there is a large net outflow, it may put downward pressure on the price of Bitcoin. The outflow of funds usually means that investors lack confidence, which may lead to a negative price drop. Therefore, the flow of funds in spot ETFs is an important indicator for investors to judge market trends.
In the past month, Bitcoin spot ETFs have only had net outflows for 6 days, and the magnitude has decreased compared to the previous period. At present, after a period of price fluctuations and declines, the confidence of OTC funds is gradually recovering.
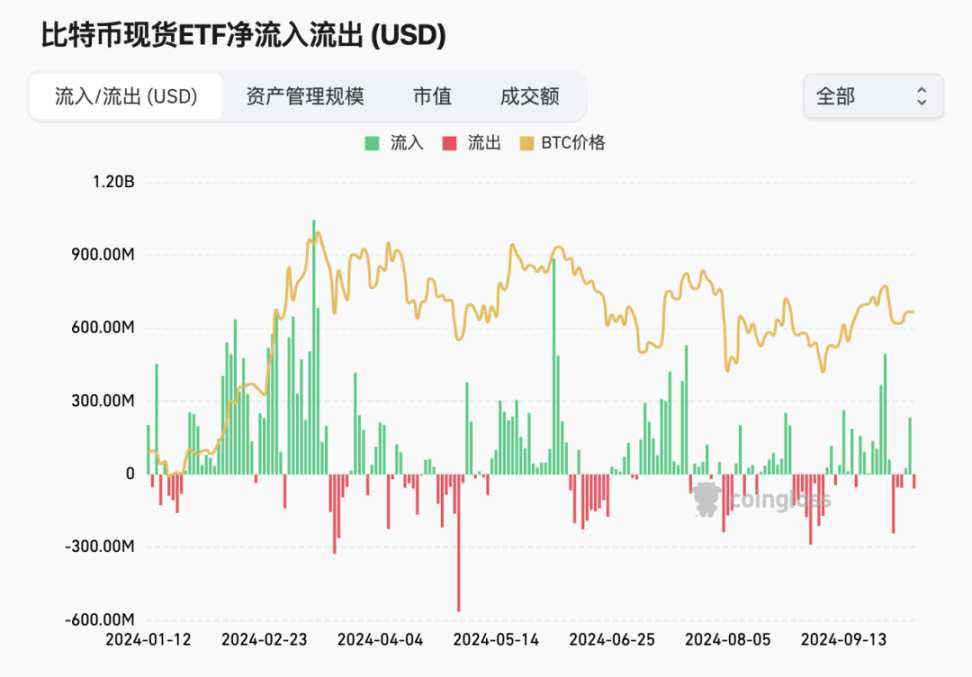
데이터 출처: Coinglass
스테이블코인
The market value of stablecoins reflects the inflow of incremental funds to a certain extent. In the crypto market, when users buy stablecoins with fiat currency, these funds will flow into the market, driving up the market value of stablecoins. Observing the changes in the market value of stablecoins can help determine the flow of funds in the market.
As shown in the figure below, the total market value of stablecoins soared to $168 billion in August, surpassing the record of $167 billion in March 2022, setting a new record high. Currently, the total market value of stablecoins continues to break previous highs, with the latest data on October 8 being $171.3 billion.
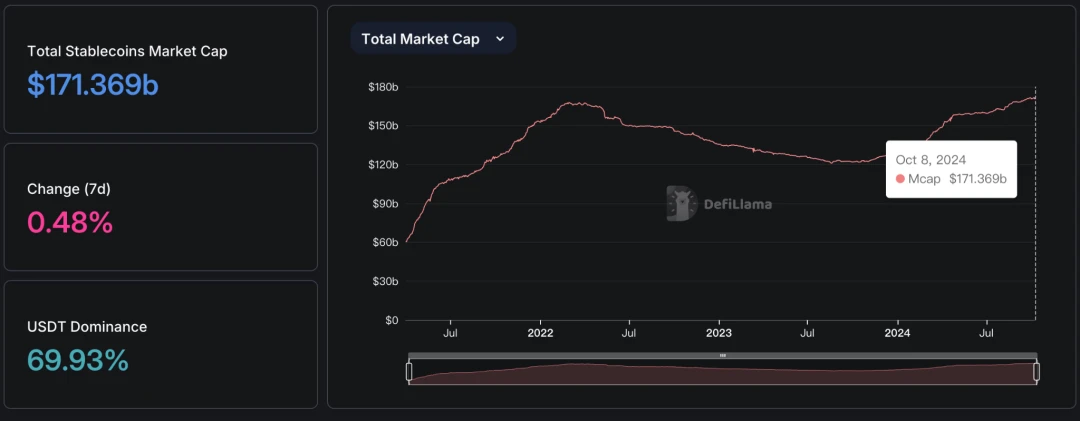
Data source: Deflama
The total market value of stablecoins backed by fiat currencies has also reached a record high and is still growing. This data only includes stablecoins backed by fiat currencies and does not involve algorithmic stablecoins that rely on complex algorithms. As shown in the figure below:
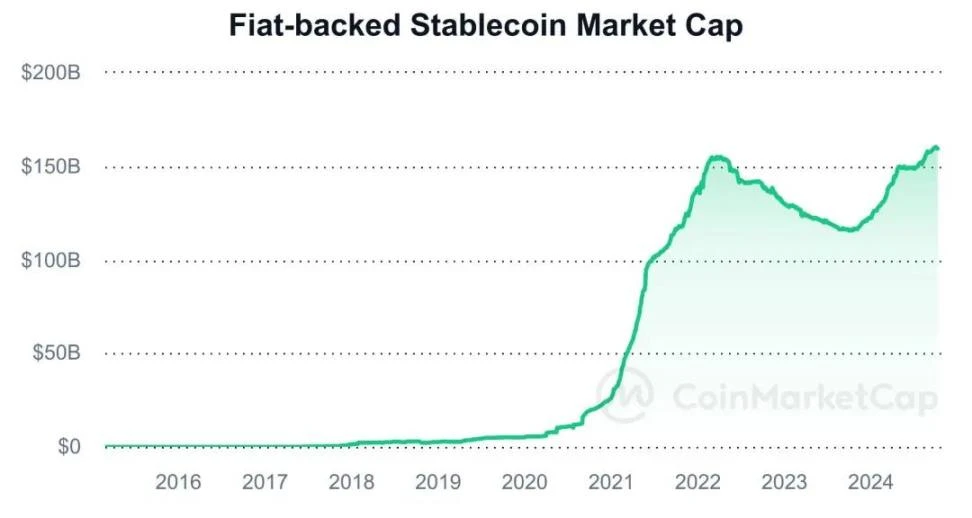
Data source: Coin시장캡
It is worth mentioning that, at present, Tether (USDT) ranks first with a market value of nearly 119.6 billion US dollars, accounting for nearly 70% of the total market value of stablecoins. USD Coin (USDC) follows closely behind and is also growing steadily, with a market value of approximately 35.3 billion US dollars. As market confidence recovers, the continued demand for these two stablecoins will also increase. The figure below shows the change in USDT market value.

Data source: CoinMarketCap
The Merrill Lynch Clock is an important tool for evaluating the relationship between economic cycles and asset performance. It divides the economic cycle into four stages: recession, recovery, overheating and stagflation.
Decline:
Characteristics: slow or stagnant economic growth and low inflation.
Investment strategy: Bonds perform best at this time as interest rates fall and fixed income attracts investors.
Recovery period:
Characteristics: The economy begins to pick up, growth accelerates, and inflation remains at a low level.
Investment strategy: Stocks become the best investment option, corporate profits increase, and market confidence strengthens.
Overheating period:
Characteristics: Economic growth remains strong, but inflation rises.
Investment strategy: The allocation value of stocks is relatively strong, commodities perform outstandingly, and investors may face the risk of interest rate hikes.
Stagflation period:
Characteristics: Economic growth is below potential and inflation remains high.
Investment strategy: Holding cash is the best option as other assets are performing poorly.
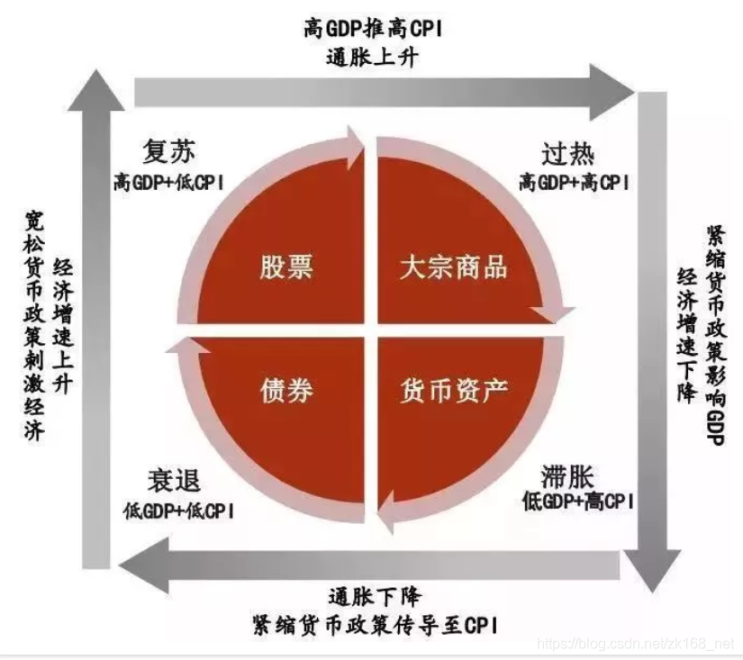
Cryptocurrency is a risky asset, and funds usually flow into the crypto market during the recovery and overheating periods of the Merrill Lynch clock. The reason is that during the recovery period, market confidence gradually recovers, capital inflows increase, cryptocurrencies are favored as high-risk assets, and prices tend to rise. During the overheating period, although economic growth is strong, inflation rises, and investors demand for cryptocurrencies such as Bitcoin increases, which may lead to rapid price increases.
Therefore, when the market is in these two stages, the possibility of a Bitcoin bull market is greater. On September 18, the Federal Reserve announced a sharp interest rate cut of 0.5%. The United States has entered a cycle of interest rate cuts. From the perspective of the Merrill Lynch clock, we are currently in the transition stage from recession to recovery, and a bull market may be just around the corner.
In addition, according to Bloomberg data, the correlation coefficient between cryptocurrencies and the MSCI World Stock Index is close to 0.6, one of the highest levels in the past two years. This shows that the trends between the two markets are getting closer and closer, and when the stock market performs well, the cryptocurrency market may also rise with it.
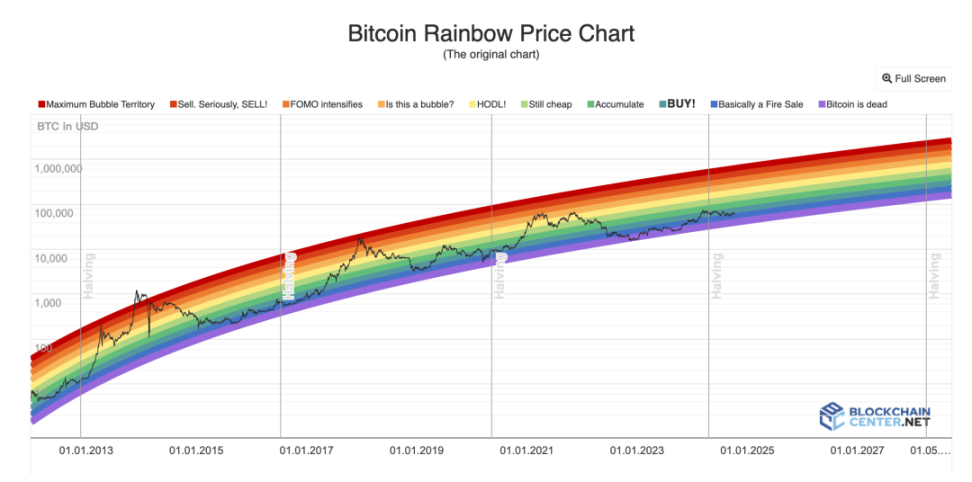
Bitcoin Rainbow Price Chart
The rainbow chart is a long-term valuation tool for Bitcoin that uses a logarithmic growth curve to predict the potential future price direction of Bitcoin. The warmer colors above show when the market may be overheated, which is a better selling point; the cooler colors indicate that the overall market sentiment is usually depressed, which is a better buying point. The rainbow chart can be used to assist in judging the arrival of bull market signals.
There are 10 color bands in the chart. For example, today, October 8, BTC is in the green buy zone, and the market is generally hot. If one day the BTC price is in the yellow, orange, and red bands of the rainbow chart, it means that the market is gradually heating up, and the bull market signal is becoming more and more obvious.
For more analysis on the line data indicators, please refer to Biteye鈥檚 recent article: Will the market reverse? Check out 7 Bitcoin bottom-picking indicators
In the past half month, funds have been pouring into the Chinese stock market. Going all-in on A-shares no longer seems to be a joke in the capital market.
In contrast, despite the current lack of momentum in the crypto market, Bitcoin is still the best performing asset class this year in the long run. According to the latest statistics from Goldman Sachs on October 8, Bitcoin has risen by more than 40% this year, outperforming major stock indexes, fixed income securities, gold and oil.
When will the crypto bull market come? Talk about the heart and the deeds.
By observing and tracking a series of positive signals, accompanied by global economic recovery and policy support, I believe that the crypto bull market is just around the corner!
This article is sourced from the internet: A-shares are back on the rise, when will the crypto bull market start?
Related: Cycle Trading: Changes in asset prices after interest rate cuts
1. The easing cycle started again after four years At 2:00 am on September 19th, Beijing time, the Federal Reserve announced a 50 basis point interest rate cut, and the target range of the federal funds rate was reduced from 5.25%-5.50% to 4.75%-5.0%, and a new round of interest rate cuts officially began. The 50 bp interest rate cut was in line with the expectations of CME interest rate futures, but exceeded the forecasts of many Wall Street investment banks. Historically, the first 50 bp interest rate cut has only occurred in economic or market emergencies, such as the technology bubble in January 2001, the financial crisis in September 2007, and the COVID-19 pandemic in March 2020. Since a 50 bp interest rate cut will make the market more worried…


