Written by: Shang2046
이 보고서에 언급된 시장, 프로젝트, 통화 등에 대한 정보, 의견 및 판단은 참고용일 뿐이며, 어떠한 투자 조언도 구성하지 않습니다.
마켓 위크
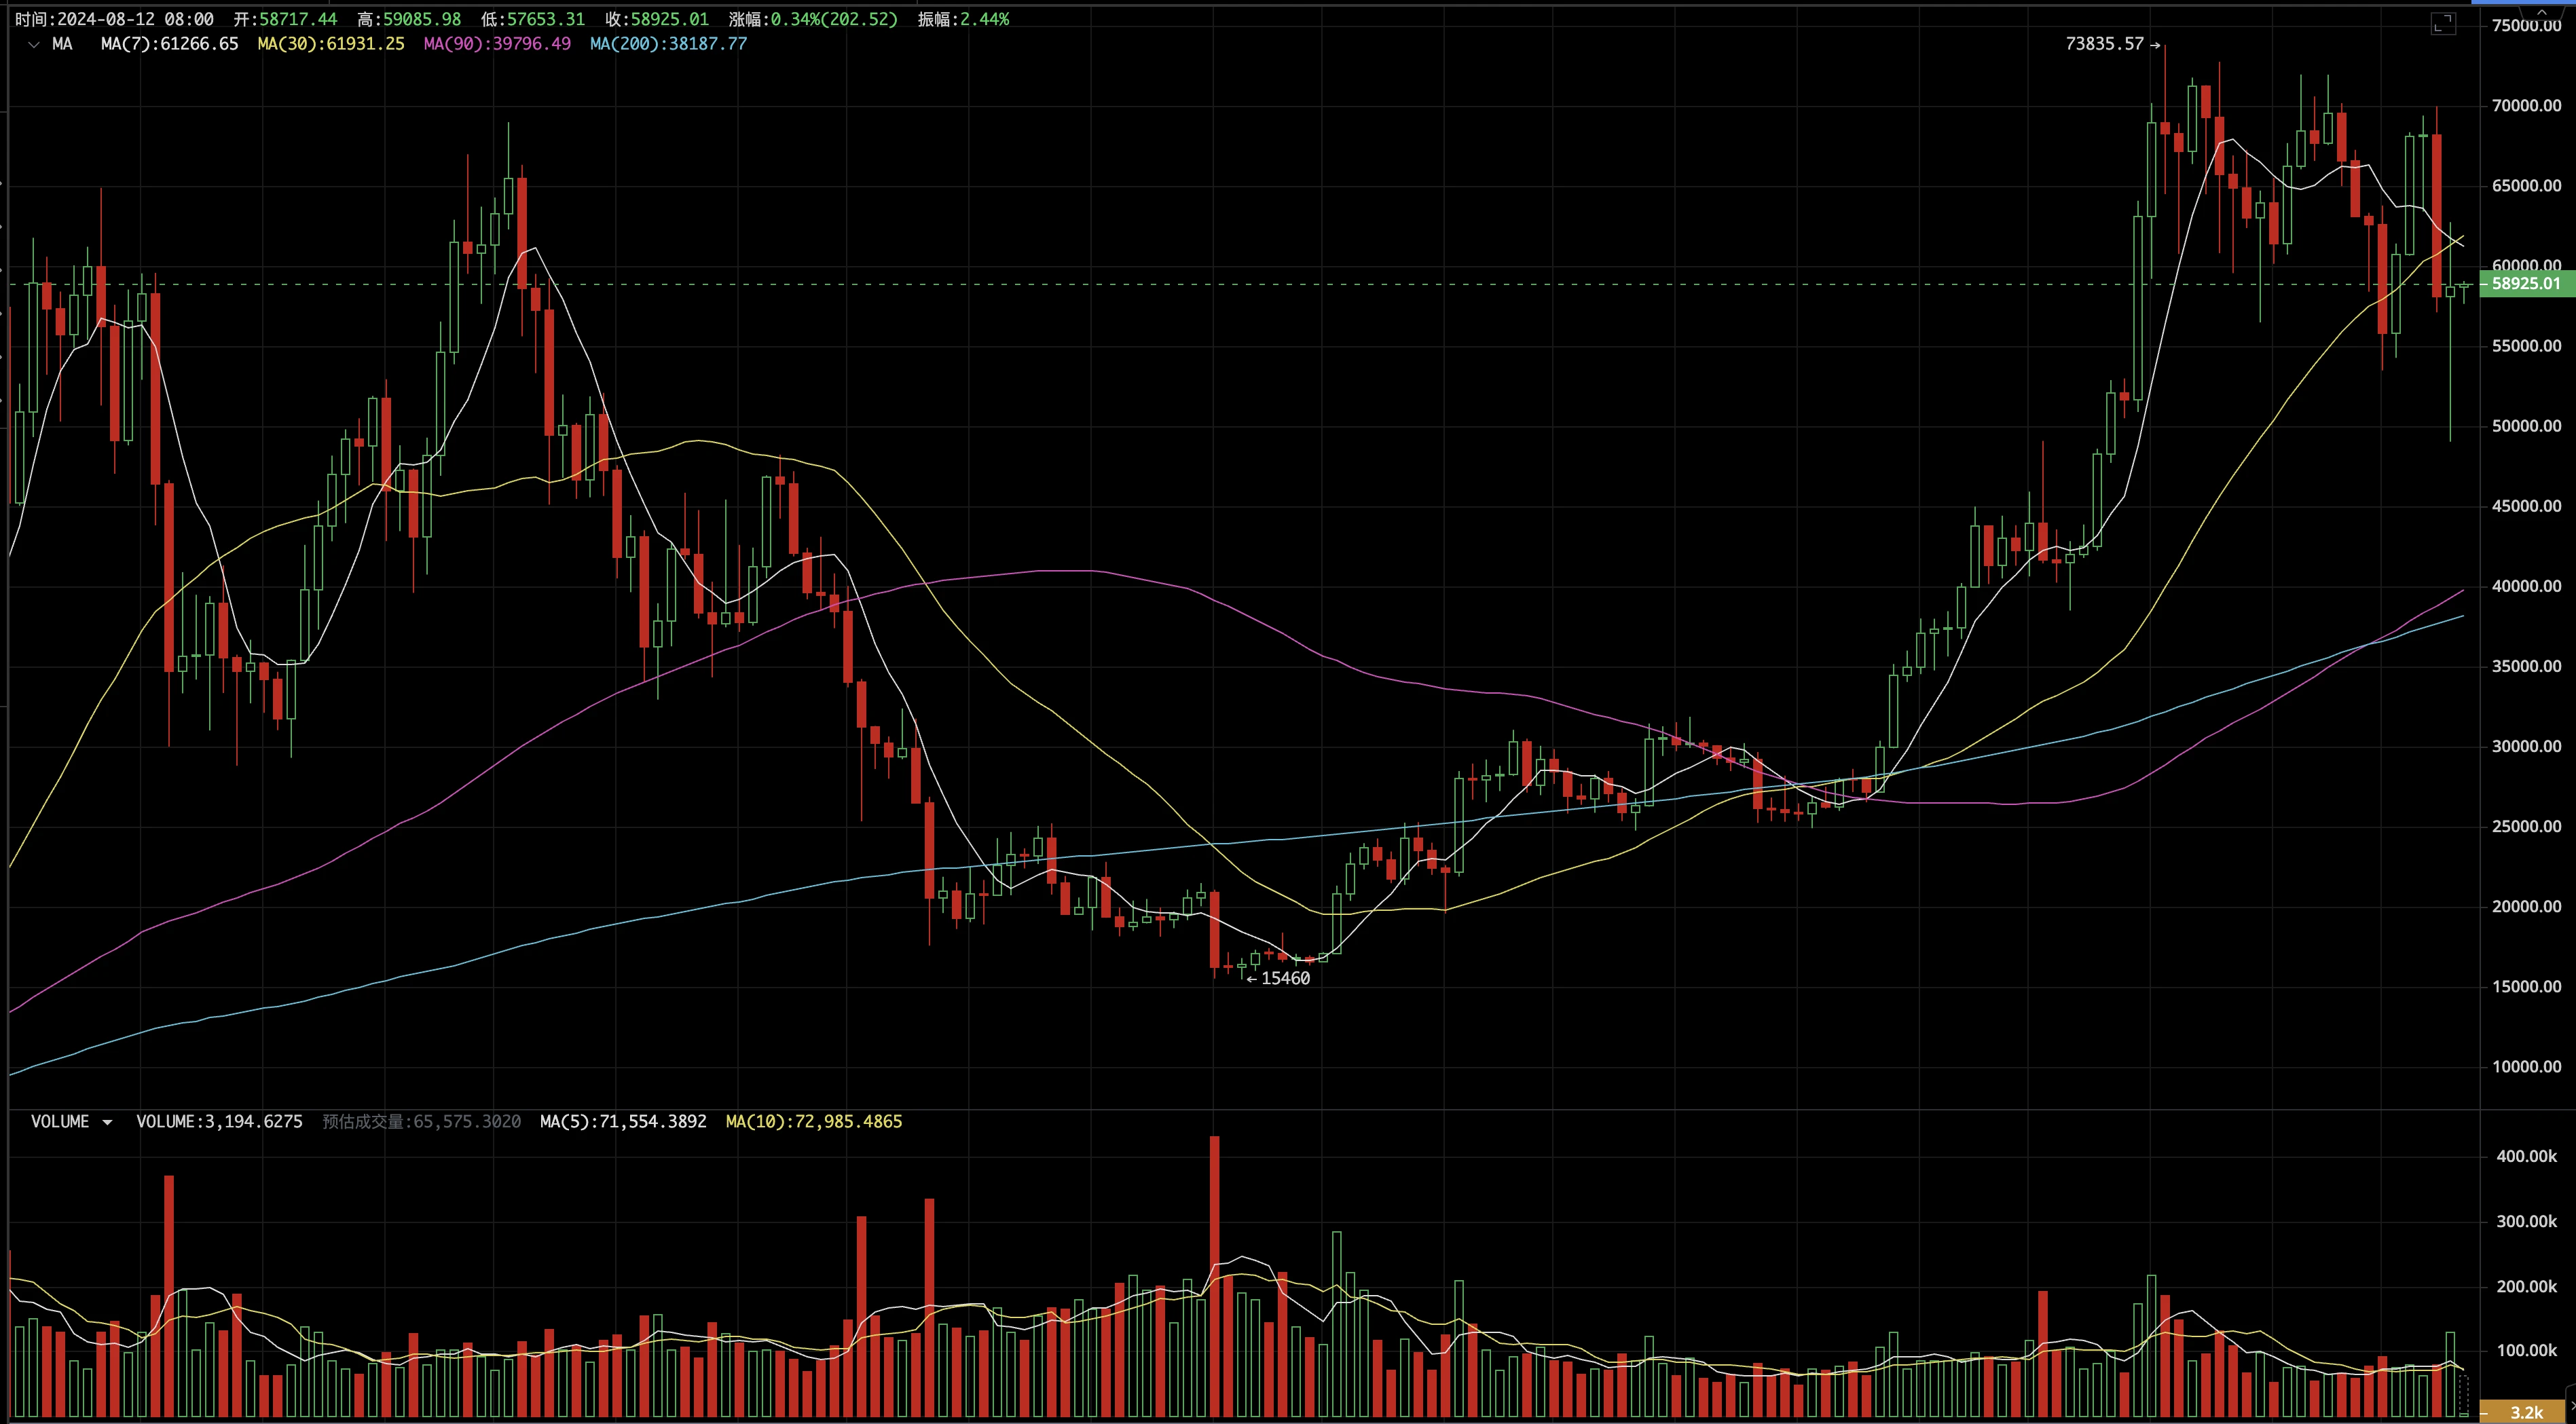
Last week, BTC opened at $58,161 and closed at $58,712. It once fell to $49,000 on August 5, with an amplitude of 23.63%, the second largest week so far this year. The largest amplitude week of the year is not far away – at the end of February, BTC rose from $50,000 to $10,000 in a single week, and set a new record in the second week.
After six months of high consolidation and two deep pullbacks of around 30%, BTC has currently broken through the rising trend line and the 200-day line, but remains in the new high consolidation area.
As we mentioned last week, the reason for this round of decline was the stampede of carry traders caused by the yen rate hike and the concerns about the US recession. Fortunately, these two biggest negative factors were corrected in the later period of last week. BTC price also rebounded quickly, reaching a high of $62,700.
The rapid decline did not destroy the confidence of the market. We noticed that last week recorded the largest weekly capital inflow in the past 4 months. This is not easy given that market makers such as Jump Crypto can easily withdraw hundreds of millions of dollars in USDC.
Of course, the dangerous situation is not over yet: short-term investors are at a loss, the market is hovering near the 200-day moving average, and the September interest rate cut is gradually priced in, which will take a long time to repair.
Time is also a friend of investors. The fourth halving has been going on for 115 days. Although it hit a record high before the halving, the trend after the new high has not deviated from the usual historical trajectory. We optimistically predict that all the fluctuations are creating space for a better trend in the next year.
It is still a long way from reaching the all-time high which is usually around 500 days, which is the best time for new investors to enter.
연방준비제도와 경제 데이터
After constantly blowing the whistle to reverse the markets expectations of an economic recession, the Fed further hopes that the market will not be so optimistic about the extent of the interest rate cut in September, and the rate will be 25 basis points instead of 50 basis points. The Fed observes the current data: the probability of a 25 basis point cut in September is 51.5%, and the probability of a 50 basis point cut is 48.5%. The cumulative rate cut of 75 basis points this year is 49.4%.
자금 조달
Last week, stablecoins saw a large inflow of $2.336 billion. Among them, USDT and USDC both achieved positive inflows of $1.031 billion and $1.304 billion respectively. These funds became the decisive force in the rebound after the new low in this round.
BTC ETF channel, only 2 trading days out of 5 trading days have positive inflows, with a net outflow of 169 million for the whole week. Since August, there have been two consecutive weeks of net outflows.
칩 공급
This week, the market continued to go from short to long, with long-term investors with more than 5 months holding increasing their holdings by 54,500 coins, while investors with less than 5 months holding reduced their holdings by 52,600 coins. The drastic changes in the market have intensified the reduction of short-term positions, and short-term holdings have been reduced for 7 consecutive weeks.
After a brief period of profit, short-term investors entered the loss range again, with the maximum average loss reaching 14%.
On August 5, a day of rapid decline, more than 8.5 perfect BTC were charged to the exchange, but the net accumulation of BTC in the exchange for the whole week was only 500 BTC, which may mean that most of the selling pressure has been effectively absorbed.
The miners increased their holdings by 100 coins, achieving three consecutive weeks of increase. This week, Russia passed national legislation to allow companies (with approval) and individuals (below a certain scale) to legally mine.
BTC 온체인 데이터
BTC new addresses and active addresses maintained a mild recovery, and the 30-day moving average continued to move upward slowly from last week. Transactions were the same as last week, and Gas revenue remained sluggish.
생태학적 분석
이더리움 에코는 양호한 회복세를 보이며, 새로운 주소 수, 활성 주소 수, 총 전송량이 확장 영역으로 돌아오고 있습니다.
Solanas new addresses, active addresses, and total transfers have all declined to a certain extent, but still maintain a high level.
EMC BTC 사이클 지표
The EMC BTC Cycle Metrics indicator is 0.125, pending a bullish signal for further recovery interruption.
끝
EMC Labs는 2023년 4월 암호화폐 자산 투자자와 데이터 과학자에 의해 설립되었습니다. EMC Labs는 블록체인 산업 연구 및 암호화폐 2차 시장 투자에 중점을 두고 업계 예측, 통찰력 및 데이터 마이닝을 핵심 경쟁력으로 삼고 급성장하는 블록체인 산업에 참여하기 위해 최선을 다하고 있습니다. 연구와 투자를 통해 블록체인과 암호화폐 자산을 홍보하여 인류에게 이익을 가져다줍니다.
자세한 내용은 https://www.emc.fund에서 확인하세요.
This article is sourced from the internet: EMC Labs Bitcoin Weekly Observation (8.5~8.11): Deep adjustment attracts bargain hunting funds, BTC holds high volatility zone
Original锝淥daily Planet Daily Author: Azuma The so-called VC tokens with the typical characteristics of high FDV and low circulation have become the most dangerous label in the secondary market. On June 24, hitesh.eth, co-founder of the data analysis platform DY胃R, posted a set of data on X, taking stock of the top ten typical VC tokens on the market. The data shows that even in the case of a continuous decline in the market, major VCs still have tens or even hundreds of times of floating profits on their investments in these tokens. hitesh.eth specifically marked the unlocking time of the investor shares of these tokens so that the market can monitor potential unlocking selling pressure. The figure below is a secondary map made by Odaily Planet Daily based on…