

Yesterday (15 May 24), important economic data was released. In the past few days, three consecutive inflation data exceeded expectations, while the US CPI index was roughly in line with expectations; retail data was unexpectedly flat, continuing the recent weakness in consumer data. Although the current inflation level and momentum are still far higher than the Feds target, these two data have eased market concerns about the re-acceleration of prices to a certain extent, restored market confidence in the Feds September rate cut, and US Treasury yields fell in the short term. The three major US stock indexes also closed up about 1%, setting a record high.
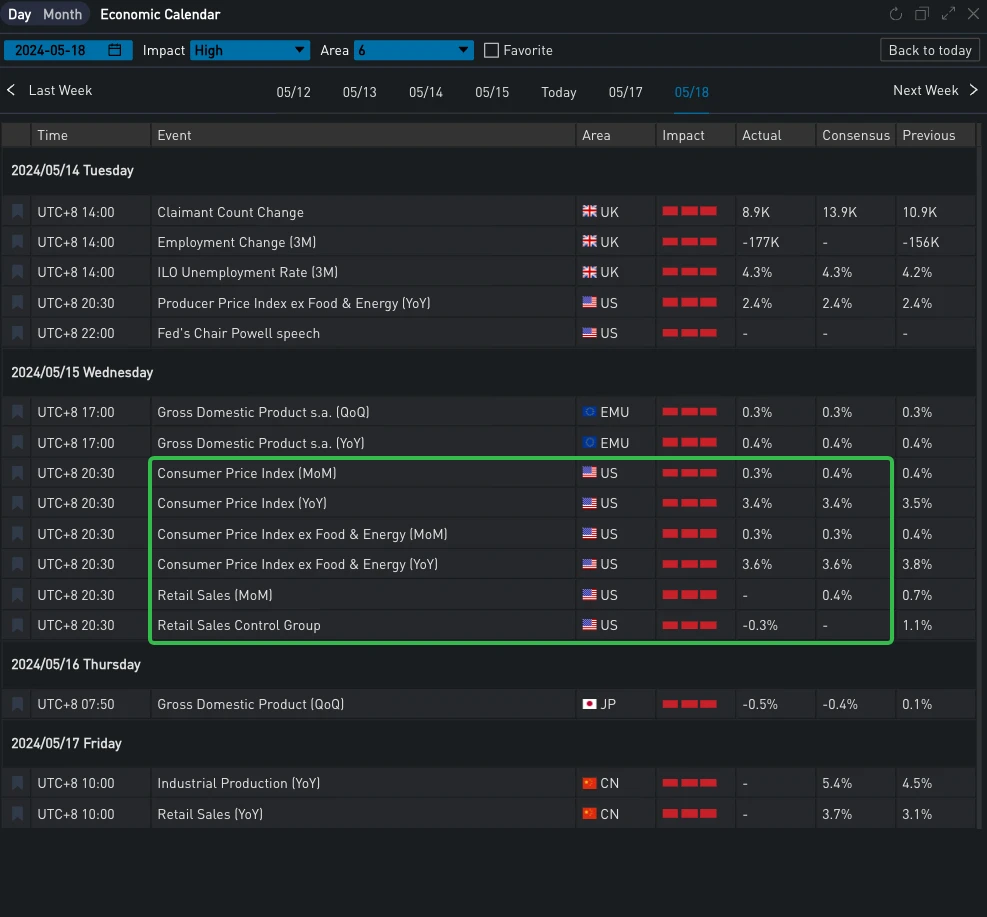
출처: SignalPlus, Economic Calendar

출처 : 투자
In terms of digital currencies, boosted by the weakening of US economic data, the price of BTC has been rising all the way to break through the 66,000 mark, attracting the communitys carnival. The recent inflow of BTC Spot ETF is also relatively healthy. Although IBIT no longer has growth, the total inflow per day yesterday reached 303 $m, mainly contributed by FBTC and BITB. On the other hand, from the comparison chart below, we can see that ETHs performance in this round of market is relatively poor. In the past 24 hours, it has only gained half of BTCs increase and returned to the vicinity of 3,000 US dollars.

출처: TradingView
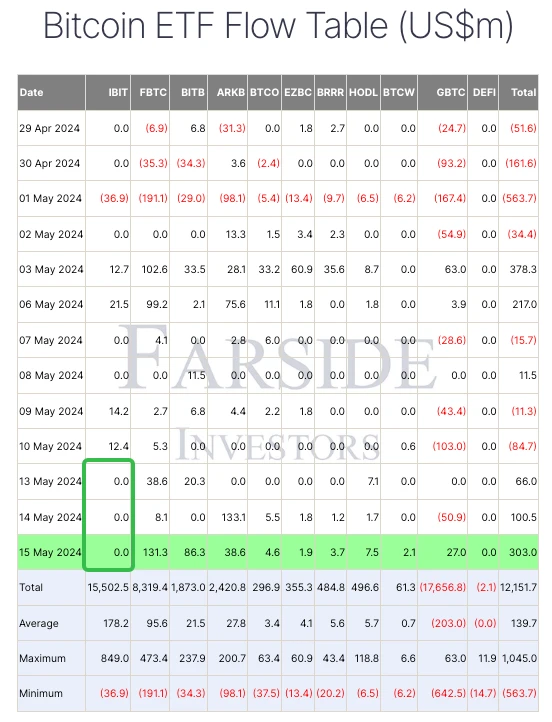
출처: 파사이드 투자자
In terms of options, the implied volatility levels of BTC and ETH also showed very different changes. The main change of BTC is reflected in the upward movement of the medium- and long-term IV. The block trades in the past day are also mainly distributed in the medium- and long-term. The largest one is the Long Straddle of 277.5 BTC per leg, which is bullish on the volatility at the end of June, and the diagonal spread of selling May and buying June Call. The front-end IV of ETH fell sharply, attracting a group of Buy 17 MAY vs Sell 24 MAY transactions with a volume of up to 19,450 ETH per leg on the block. At the same time, there are also many call options positions on the option chain at the end of May. Although ETH has performed relatively poorly recently, there are still traders who are paying for its next upside space.
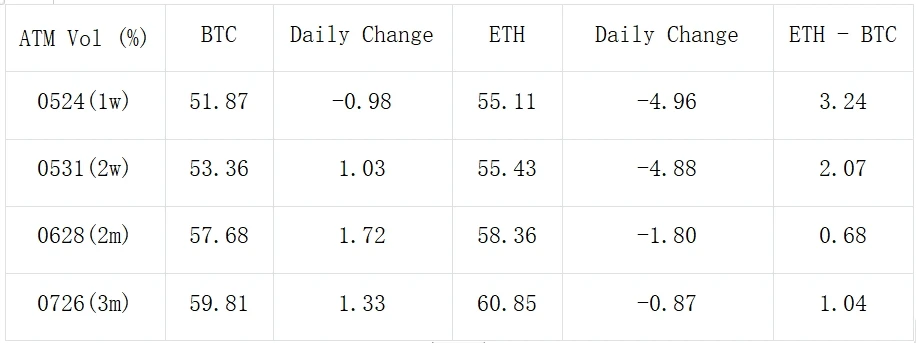
Source: Deribit (as of 16 MAY 16: 00 UTC+ 8)

출처: 시그널플러스
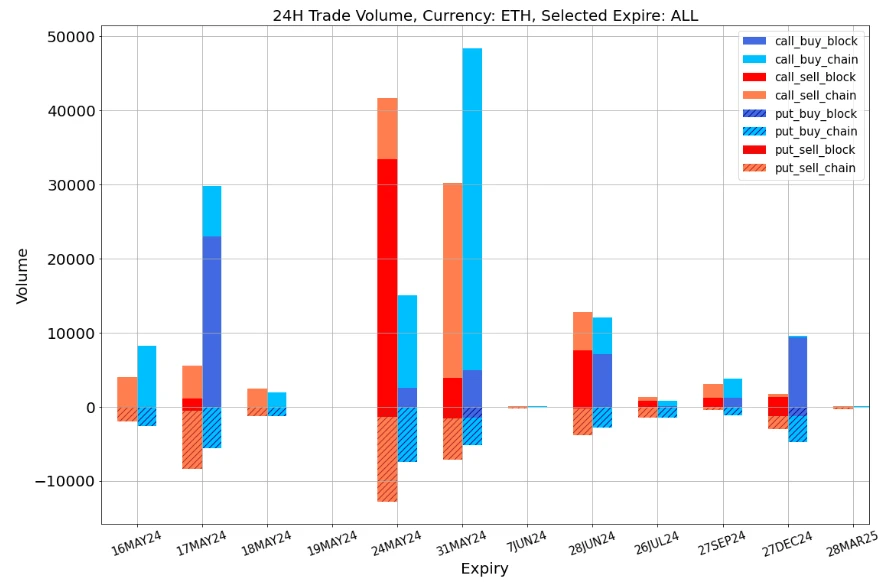
데이터 출처: Deribit, ETH 거래의 전체 분포
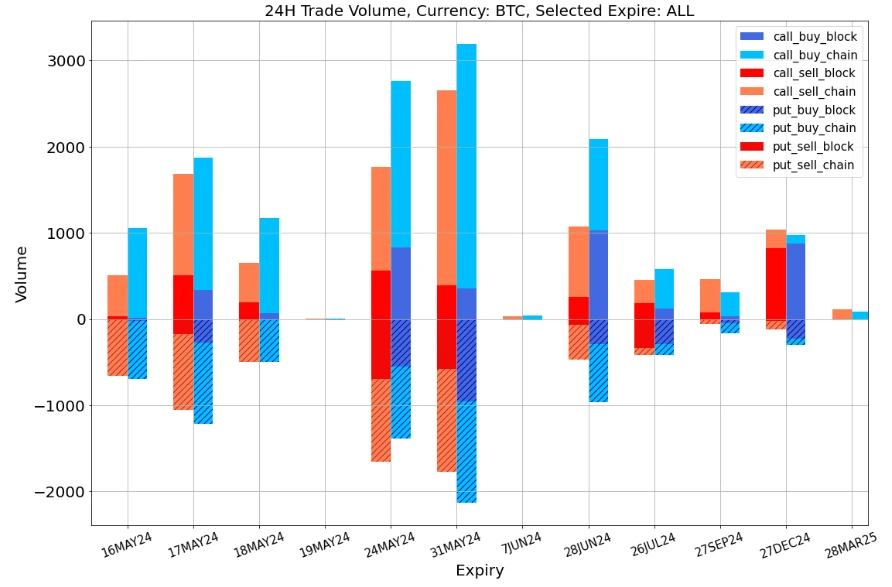
데이터 출처: Deribit, BTC 거래의 전체 분포
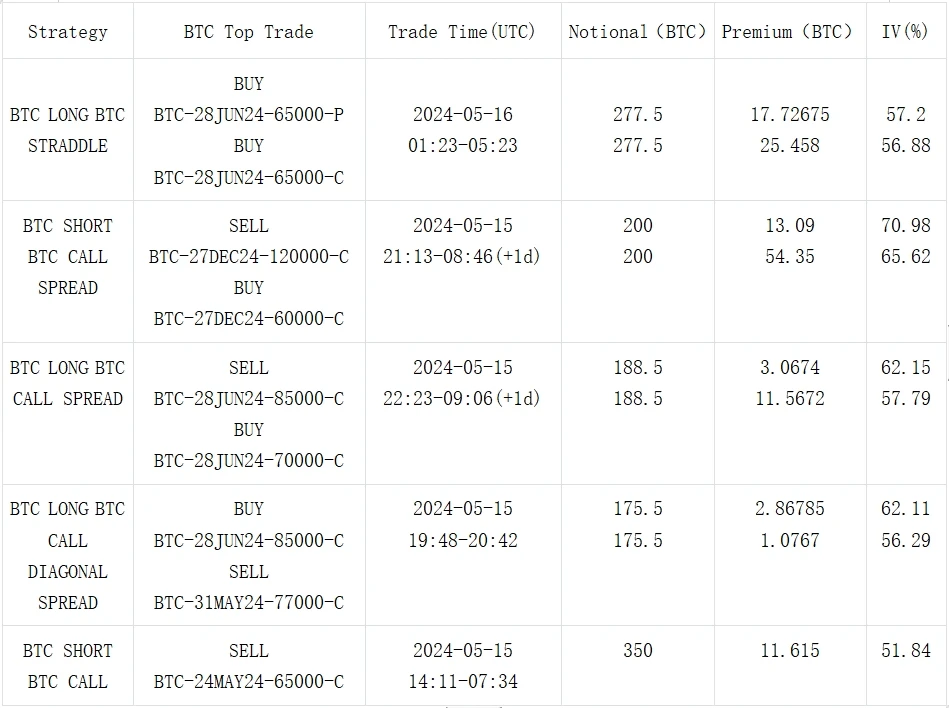
출처: Deribit 대량매매
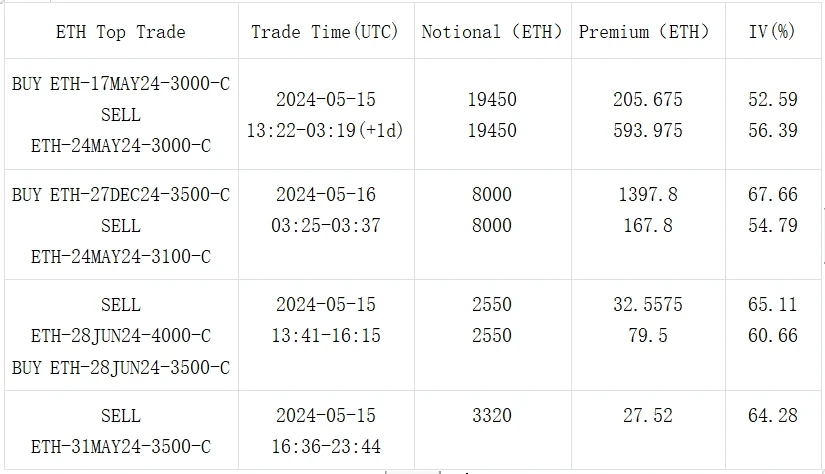
출처: Deribit 대량매매

ChatGPT 4.0 플러그인 스토어에서 SignalPlus를 검색하시면 실시간 암호화 정보를 얻으실 수 있습니다. 업데이트를 즉시 받으려면 트위터 계정 @SignalPlus_Web3을 팔로우하거나 WeChat 그룹(WeChat 보조자 추가: SignalPlus 123), Telegram 그룹 및 Discord 커뮤니티에 가입하여 더 많은 친구들과 소통하고 소통하세요. 시그널플러스 공식 홈페이지: https://www.signalplus.com
This article is sourced from the internet: SignalPlus Volatility Column (20240516): Macroeconomics is positive, BTC returns to 66,000
관련 항목: Fantom(FTM) 가격 예측: 2년 만에 최고치를 경신할 수 있을까요?
In Brief The supply of FTM in the hands of traders has decreased significantly in the last few days, indicating an increase in mid-term and long-term holders. The FTM 7-day RSI is currently at 77, down from 81 last week, still indicating an overbought status. EMA lines are painting a bullish scenario, and we could see a 2-year high soon for FTM price. The dwindling supply of FTM among traders over the last few days signals a noticeable shift towards accumulation by mid-term and long-term holders, suggesting a strengthened belief in FTM’s future prospects. The FTM price is buoyed by positive market sentiment, with its 7-day RSI indicating high investor interest despite being in the overbought zone. The bullish trend suggested by the Exponential Moving Average (EMA) lines hints at…


