Key indicators: (December 9, 4pm -> December 16, 4pm Hong Kong time)
-
BTC/USD rose 5.3% (99,600k USD -> 104,880k USD), ETH/USD rose 1.5% (3,910k USD -> 3,970k USD)
-
BTC/USD ATM volatility in December (end of the year) remained unchanged (55.2->55.2), and the skewness on December 25th decreased by 2.5 points (4.2->1.7)
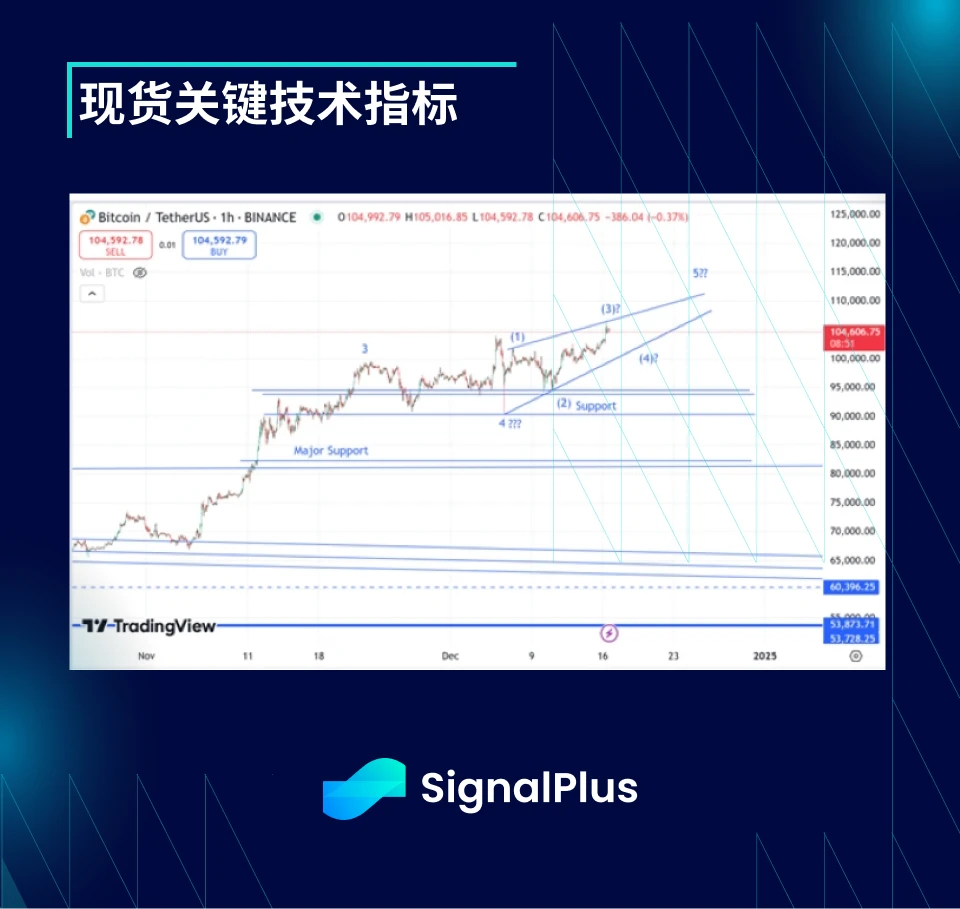
Key technical indicators of spot
-
The price trend has changed from a unilateral correction to a restrained upward trend. We see that the highest prices are constantly being refreshed in a very balanced manner, suggesting that the current round of progress will reach its peak in the next few weeks, with a target price in the range of 110-115 thousand US dollars, rather than our original target of 115-120 thousand US dollars.
-
If the price falls below $100k again before then, it could cause the price to fall back to the $90-95k range, which would mean that the current surge is just a longer correction, with the final surge coming next year. On the other hand, if the price quickly breaks through $106.5k, it could trigger a more volatile, explosive surge.
市場 Theme
-
Risk assets continued to grow modestly into the year end with no clear short-term catalysts that could reverse the upward trend. US consumer price index was in line with expectations. Although the core number remained above the Feds ultimate target, the markets expectations for a 100% 25 basis point rate cut this week did not change.
-
Bitcoin has benefited greatly from the macro backdrop supporting 暗号currencies. Bitcoin was snapped up as soon as it fell below $100k, and hit new highs again this week. The news that the Nasdaq index included MSTR in the index pushed the price up over the weekend, and Taylor himself hinted that more buyers were about to enter the market, which stimulated the price to finally break through the key resistance level of $104k. Funding rates for Bitcoin and other small coins returned to normal this week, indicating that such positions began to be liquidated after a good year.
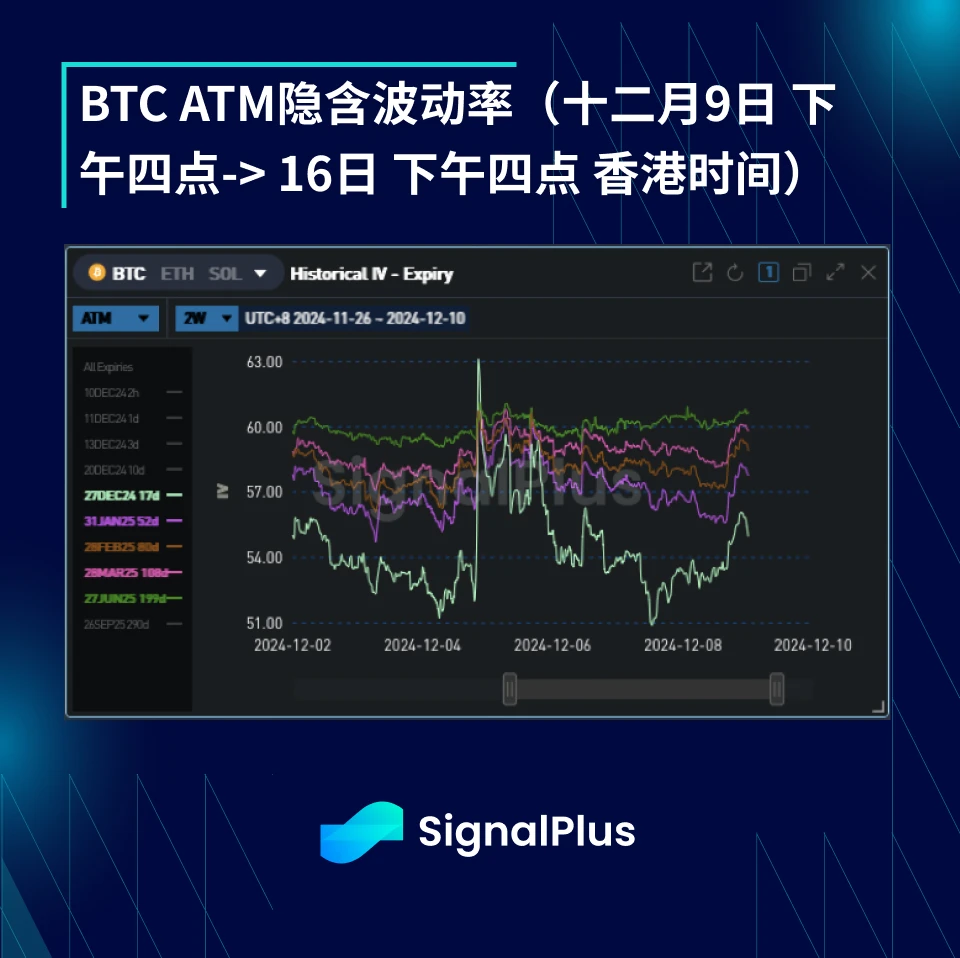
ATM Implied Volatility
-
Although the BTCUSD spot price was relatively volatile this week, and eventually hit a new high, the realized volatility did not increase much. It feels like there were relatively few positions opened in the market at the end of the year, which can also be seen from the return to normal funding rates and basis. This has caused selling pressure on contracts before the end of the year, with the implied volatility for December 27th expiring briefly falling 50 points at the end of this week. However, contracts expiring from January next year remain firmly bid. The market saw a lot of demand for the upper February/March next year (130k-150k), as well as demand for the lower February/March (70k-75k). The former is likely to transfer spot longs to options in the first quarter, while the latter is to hedge the core Bitcoin longs.
-
We expect implied volatility to return to lower levels in January. The market is currently pricing in an average weekly implied volatility of more than 60 points for the first quarter, a level that is difficult to maintain based on historical data. During this period, the market has retained some risk premium on implied volatility to protect against the impact of insufficient liquidity around the New Year.
BTC Skewness/Kurtosis
-
While implied volatility levels have risen as spot prices have risen, skewness has trended down this week. Mainly driven by demand for downside strikes in February and March expirations (most likely hedged flows), while classic call spreads have reserved Vega longs for market makers in the $105-110k range.
-
As the correlation between price and skewness breaks down at the current price, the kurtosis is also generally moving downward. The market is pricing volatility more in the $90-120k range, and it looks like the price will stay in this range for the next month.
SignalPlusのトレーディングベーン機能は、 t.signalplus.com よりリアルタイムの暗号通貨情報を入手してください。最新情報をすぐに受け取りたい場合は、Twitter アカウント @SignalPlusCN をフォローするか、WeChat グループ (アシスタント WeChat を追加: SignalPlus 123)、Telegram グループ、Discord コミュニティに参加して、より多くの友人とコミュニケーションや交流を行ってください。
SignalPlus公式サイト: https://www.signalplus.com
This article is sourced from the internet: BTC Volatility Weekly Review (December 9-December 16)
Original author: TechFlow After the ETH mainnet鈥檚 meme market was suppressed by Solana for several weeks, a target finally emerged today. Around 8 am on October 30, the AI Meme token $TEE was launched on the ETH mainnet. This time, it started to pull up the market without warning and the smart money alarm sounded. The market value was close to 50 million US dollars within 6 hours of opening, which was even more outrageous than yesterdays $LUSE. Shenchao has sorted out some information about the token to help readers understand the differences between the main technical concepts of $TEE and other AI coins, as well as the reasons for the popularity of $TEE. An AI agent with full autonomy? At about 6:00 a.m. on October 30, a Twitter account…


