原作者: Dappradar
原文翻訳: Felix、PANews
The dapp industry has performed extremely well in the second quarter of 2024. Since the beginning of the year, it has witnessed a series of positive developments and is experiencing a bullish trend that shows no signs of slowing down. However, this bullish sentiment is reflected in fundamental indicators and user engagement rather than token prices. Since the end of the first quarter of 2024, Bitcoin has fallen by 12%. This article does not focus on token prices, but analyzes the broader landscape to understand user behavior and trends within the ecosystem.
キーポイント:
-
The dapp industry saw a 40% increase in usage compared to the previous quarter, with 10 million daily unique active wallets (dUAW)
-
The social sector performed well in Web3, with dUAW surging 66% to 1.9 million
-
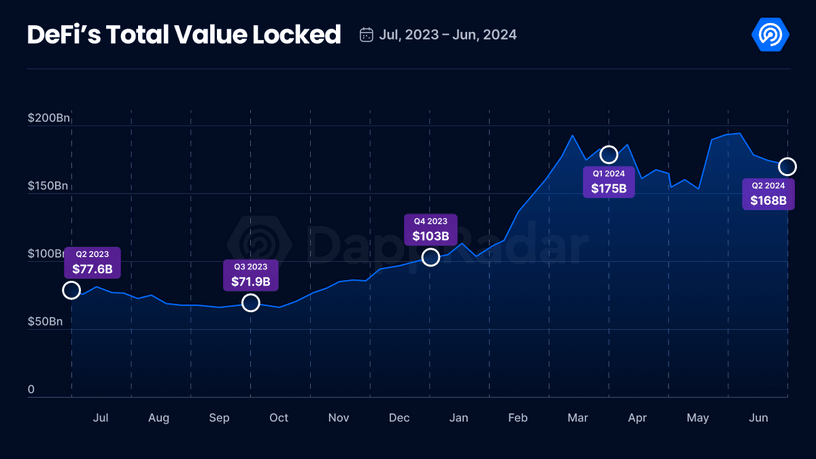
DeFi’s TVL fell 4% from the previous quarter to $168 billion
-
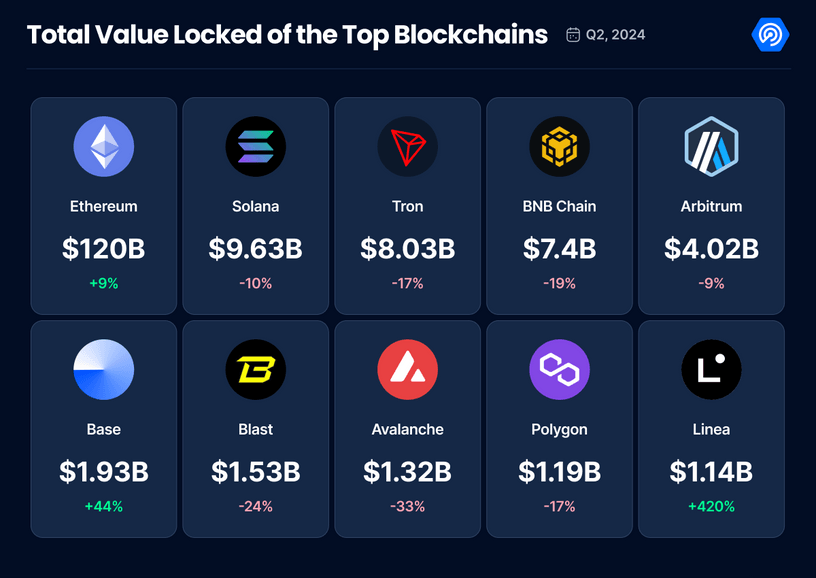
Linea shines in the DeFi space, with TVL reaching $1.1 billion, up 420%
-
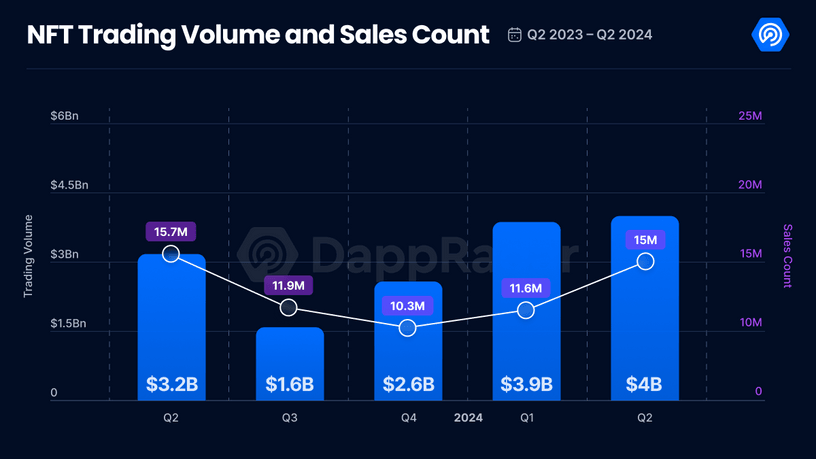
NFTs had their best quarter since Q1 2023, with trading volume increasing from $14.9 million to $4 billion
-
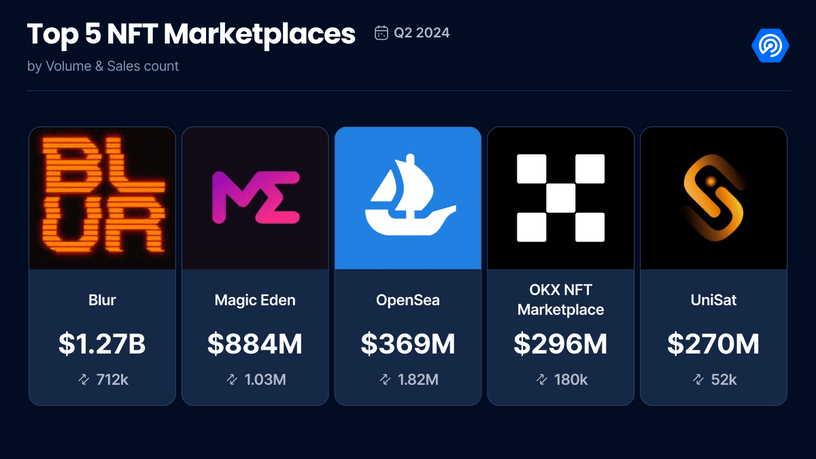
OpenSea ranks third in terms of trading volume and dominance, but leads the NFT market in terms of trading volume with a 12% market share.
-
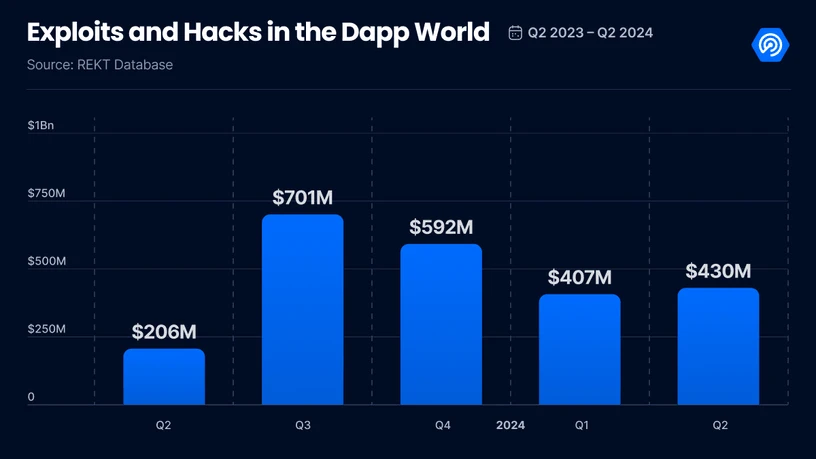
Despite the overall positive market performance, losses from breaches and hacks totaled $430 million, up 5% from the previous quarter.
1. Dapp usage hits an all-time high
Q2 2024 was an exceptional quarter for dapps, with the number of unique active wallets (UAW) reaching an all-time high. There are now 10 million UAWs connecting and interacting with dapps every day, a 40% increase from the previous quarter.
Each dapp track has experienced significant growth, driving the overall bullish trend. The social sector has seen the most significant growth, up 66% since last quarter, averaging nearly 2 million UAWs per day. This surge is largely driven by the current excitement about Web3 participation, with popular dapps such as fantasy.top, UXLINK, etc. attracting a lot of attention and usage.
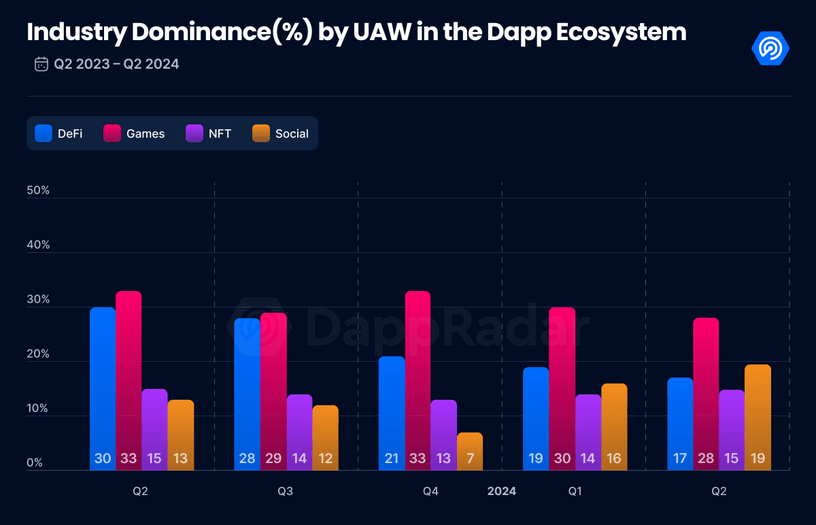
Blockchain games continue to dominate dapps, although their share has slightly decreased (2%) from the previous quarter, similar to DeFi. In contrast, the NFT and social sectors have increased their market share and become the main trends in the second quarter of 2024.
Overall, market sentiment this quarter was bullish, setting a positive tone for subsequent in-depth exploration of specific blockchain verticals.
2. DeFi’s TVL fell slightly to $168 million
In the second quarter of 2024, DeFi’s TVL declined from $175 billion in the first quarter to $168 billion at the end of the second quarter.
Ethereum continues to dominate the DeFi space, with a TVL of $120 billion in Q2 2024, up 9% from Q1. Solana’s TVL fell 10% to $9.6 billion, mainly because memecoins performed much better last quarter than this quarter and made their TVL larger. But memecoins are less popular now.
Tron experienced a more dramatic decline, with its TVL falling by 17% to $8 billion. This was mainly due to regulatory concerns. Similarly, Arbitrum’s TVL also fell by 9% to $4 billion. Arbitrum is facing stiff competition from other Layer 2 networks and alternative Layer 1 solutions.
In contrast, Base stood out, with TVL growing 44% to $1.9 billion. The chains innovative approach, strong community support, and strategic partnerships have played a key role in its development. Linea also showed impressive growth, with its TVL soaring 420% to $1 billion, driven by a surge in user adoption driven by innovative DeFi applications, strategic alliances, and airdrop mining. Linea is one of the few L2s that does not have a token.
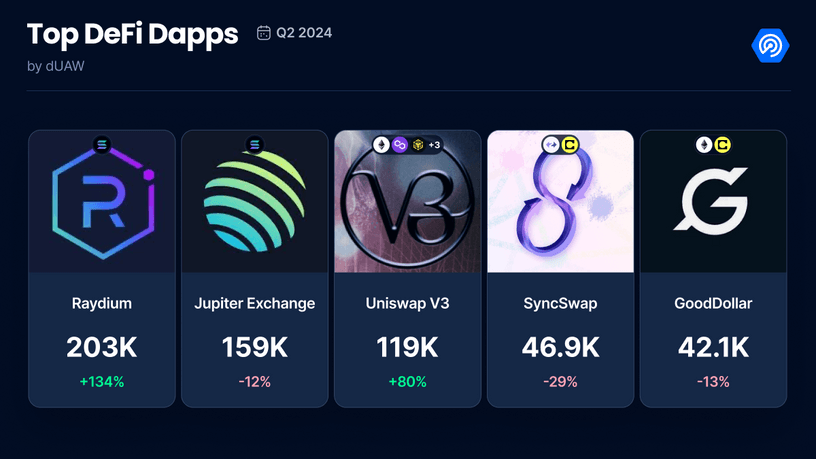
As for the most used DeFi dapps, Raydium and Uniswap V3 saw the largest increase in UAW. This surge was mainly due to its use in memecoin trading. This was the main trend this quarter, with most users actively trading memecoins.
3. NFT: Best quarter since the beginning of 2023
The NFT market maintained its bullish trend in the second quarter of 2024. NFT transaction volume reached $4 billion, up 3.7%; the number of NFT transactions increased by 28% to 14.9 million.
NFT Market Landscape
Looking at the overall NFT market, Blur continues to dominate with a 31% market share, although this ratio is down 50% from the previous quarter. Magic Eden follows closely behind, gaining success with BTC Ordinals, and its dominance has increased from 17% to 22%. In terms of trading volume and dominance, OpenSea ranks third, but with a 12% market share, it has become the leading NFT market in terms of trading volume.
The most traded NFT series
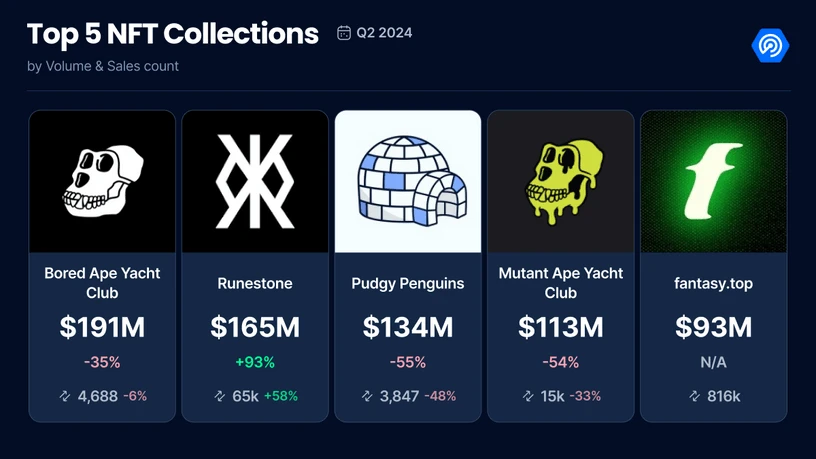
The top five NFT series by volume this quarter remained largely unchanged from last quarter, with the exception of Runestone and fantasy.top. Both of these NFT series have seen incredible success and popularity in Q2 2024.
4. Security Insights: Vulnerabilities and Hackers
Vulnerabilities and hacking attacks in the Web3 industry remain a concern. Losses due to security breaches reached $430 million in the second quarter of 2024, up 5% from the previous quarter.
Ethereum and BNB Chain were the most affected, each accounting for about 28% of the total security incidents. Solana was involved in about 8% of the incidents, and the remaining 36% occurred on other chains, including Polygon and Arbitrum.
Access control issues, while accounting for only 23% of all incidents, led to a whopping 75% of financial losses. The “other” category accounted for 36% of the total number of incidents and caused losses of about 15% of the total losses. Flash loan attacks and loan fraud incidents each accounted for about 13%, and each incident caused losses of about 1% of the total losses. Phishing accounted for only 3% of incidents and caused losses of about 0.4% of the total losses. This distribution highlights that although access control issues are less frequent, they are much more financially destructive.
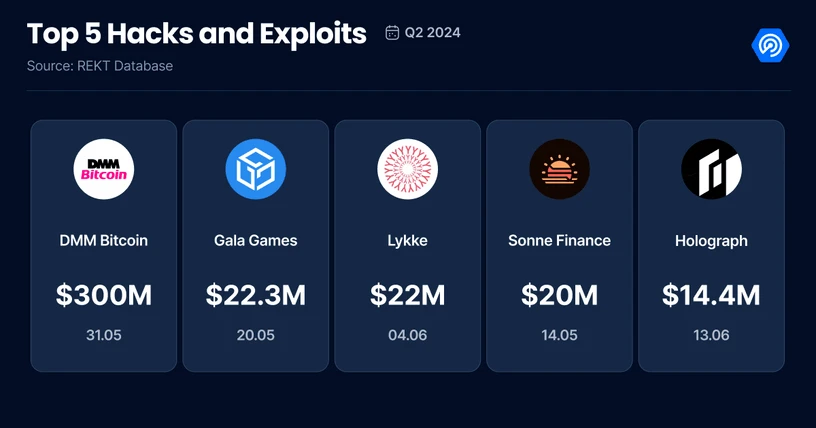
Top five hacking attacks and vulnerabilities
DMM Bitcoin Hack: Japanese centralized crypto exchange DMM Bitcoin lost $305 million in a theft on May 31.
Gala Games incident: Hackers exploited an access control vulnerability in the GALA token contract, minted 5 billion GALA tokens, and sold 592 million of them for $21.8 million in ETH, causing the price to drop by 20%.
Lykke Exchange Breach: Swiss centralized crypto exchange Lykke has suspended withdrawals after losing more than $22 million in a security breach.
Sonne Finance vulnerability: The Sonne Finance protocol on the OP chain was attacked by a flash loan attack by hackers. The attacker attacked multiple times, causing a total loss of approximately US$20 million.
Holograph Hack: NFT protocol Holograph suffered a $14.4 million hack after a former developer exploited a smart contract vulnerability to mint 1 billion HLG tokens.
It is safe to say that the Web3 industry must adopt strong security practices across different blockchain platforms. This includes addressing access control vulnerabilities, monitoring for various threats, and educating users on security practices to reduce the risk of future incidents.
5. 結論
The bullish trend in the Web3 industry continues to thrive, with significant growth in the number of independent active wallets, NFT trading volume, and innovation in DeFi and other fields. The rise of L2 solutions will undoubtedly continue, with more and more blockchains being launched to enhance scalability and reduce transaction costs.
As an important part of the Web3 ecosystem, memecoins will continue to be a prominent trend, maintaining their significant influence and market share. SocialFi will also play an important role in providing alternatives to existing platforms such as Facebook and Instagram, and will become increasingly important as users seek new social networking experiences in a decentralized world.
The current trend of airdrop mining has led to a surge in UAWs, but this growth may not be sustainable. In order to ensure long-term user retention after the airdrop, it is necessary to focus on providing a smooth user experience, a robust roadmap, and a strong development team.
Despite ongoing security challenges, momentum in the Web3 industry remains strong, driven by continued enthusiasm and the potential for further development.
This article is sourced from the internet: dApp2024 Q2 Report: Usage increased by 40%, with outstanding performance in the social field
Related: Crypto Market Rainmakers: Top Fee-Based Protocols
Original title: The Rainmakers of the Crypto Market Original author: TokenTerminal Original translation: Mars Finance, MK introduce This newsletter focuses on the protocols (both blockchains and decentralized applications) that generate the most significant fees. We focus on these protocols for the following reasons: Which protocols do users prefer to pay for services? What kind of services do these protocols provide and what is their business model? How much do users actually pay in total? Which specific market sectors are more popular than others? Are there any protocols that dominate certain market sectors? By analyzing a detailed chart, we will delve into the industry trends of the cryptocurrency market. Let’s explore it in detail! 1. Focus on the top charging protocols of blockchain The protocols in focus include: Ethereum, Tron, Bitcoin,…

