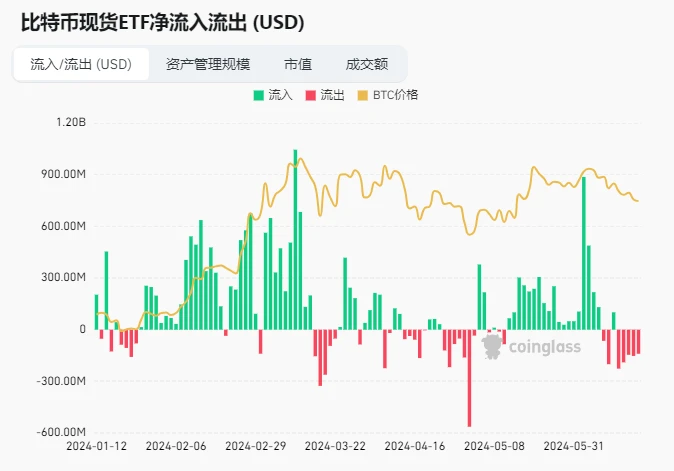
Bitcoin ETFs have been sold off continuously over the past 5 days
情報元: https://www.coinglass.com/en/bitcoin-etf
The latest data shows that the US spot Bitcoin ETF set off a selling storm on June 17! A total of 3,169 Bitcoins were sold, worth more than $200 million!
Among them, the well-known institution Fidelity reduced its holdings of 1,224 bitcoins, worth up to $80.34 million, and currently still holds a large amount of bitcoins. Another giant, Grayscale, also reduced its holdings of 936 bitcoins, worth more than $61.4 million. The reduction of holdings by these two giants has undoubtedly brought a lot of shock to the market.
This selling storm has created more uncertainty about the future trend of the Bitcoin market, and more risk management is needed.
There are about 38 days until the next Federal Reserve interest rate meeting (2024.08.01)
https://hk.investing.com/economic-calendar/interest-rate-decision-168
市場テクニカルおよび感情環境分析

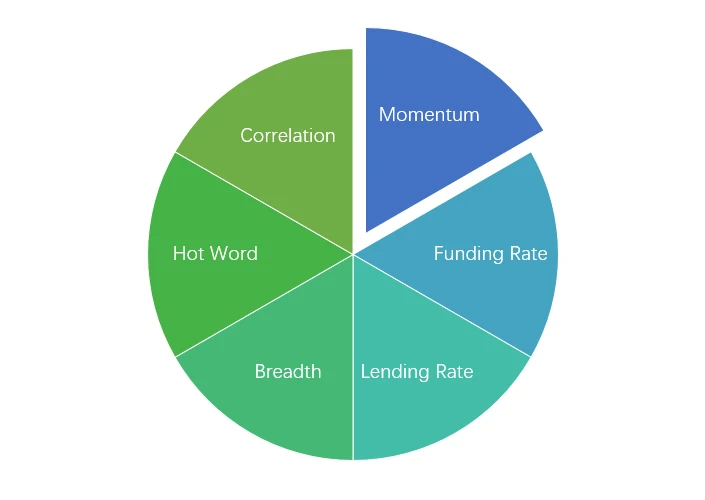
感情分析コンポーネント

テクニカル指標
価格動向
Over the past week, BTC prices fell -2.85% and ETH prices rose 1.26%.

上の画像は、過去 1 週間の BTC の価格チャートです。
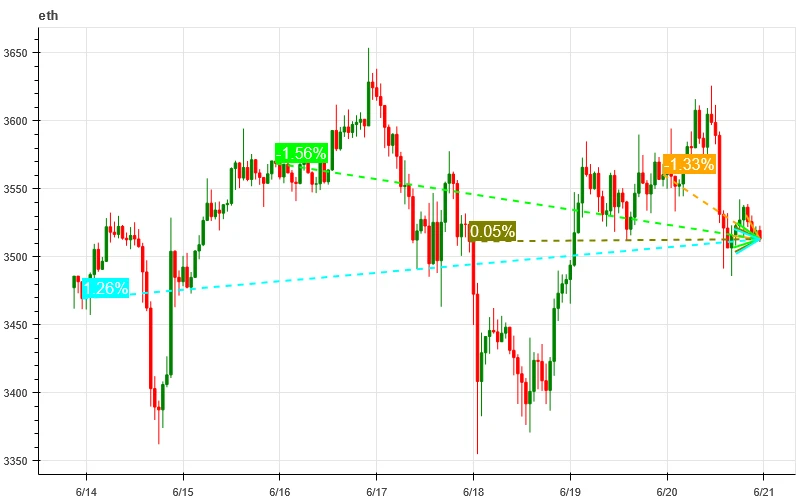
上の画像は、過去 1 週間の ETH の価格チャートです。

表には過去 1 週間の価格変動率が表示されています。
価格ボリューム分布チャート(サポートとレジスタンス)
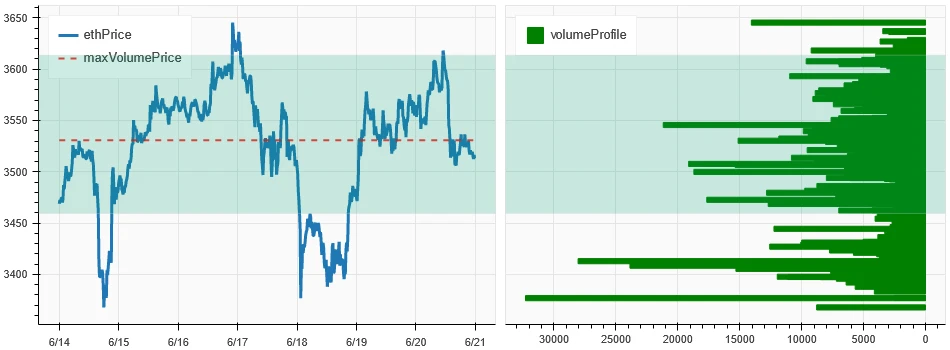
In the past week, BTC and ETH have fluctuated widely in the area of intensive trading.
上の図は、過去 1 週間の BTC の取引密度の高いエリアの分布を示しています。

上の図は、過去 1 週間の ETH 密集取引エリアの分布を示しています。

この表は、過去 1 週間の BTC と ETH の週ごとの集中取引範囲を示しています。
取引量と建玉
BTC and ETH saw the largest volume this past week, with the decline on June 18; open interest for BTC fell while ETH rose slightly.
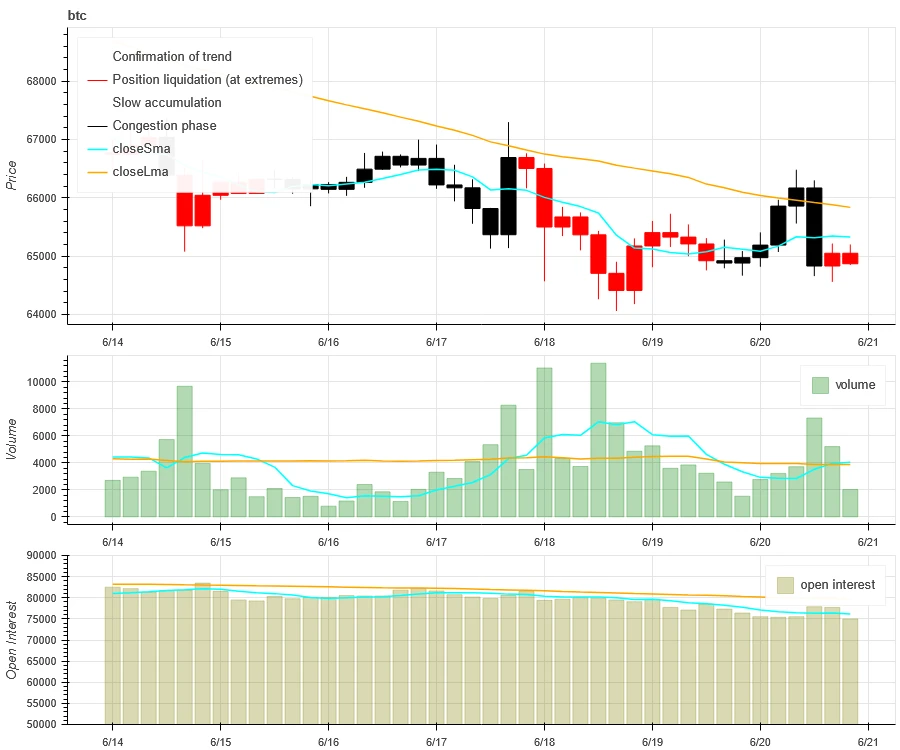
上の図の上はBTCの価格動向、真ん中は取引量、下は未決済建玉、水色は1日平均、オレンジ色は7日平均です。Kラインの色は現在の状態を表し、緑は価格上昇が取引量によって支えられていること、赤はポジションのクローズ、黄色はゆっくりとポジションを蓄積していること、黒は混雑した状態を意味します。

上の図の上はETHの価格動向、真ん中は取引量、下は未決済建玉、水色は1日平均、オレンジ色は7日平均です。Kラインの色は現在の状態を表し、緑は価格上昇が取引量によって支えられていること、赤はポジションをクローズしていること、黄色はゆっくりとポジションを蓄積していること、黒は混雑していることを意味しています。
ヒストリカルボラティリティとインプライドボラティリティ
In the past week, the historical volatility of BTC and ETH was the highest when it fell to 6.14; the implied volatility of BTC and ETH both increased compared to the beginning of the week.

黄色の線は過去のボラティリティ、青い線はインプライド ボラティリティ、赤い点は 7 日間の平均です。

イベント駆動型
No data was released in the past week.
感情指標
モメンタムセンチメント
In the past week, among Bitcoin/Gold/Nasdaq/Hang Seng Index/SSE 300, gold was the strongest, while Bitcoin performed the worst.
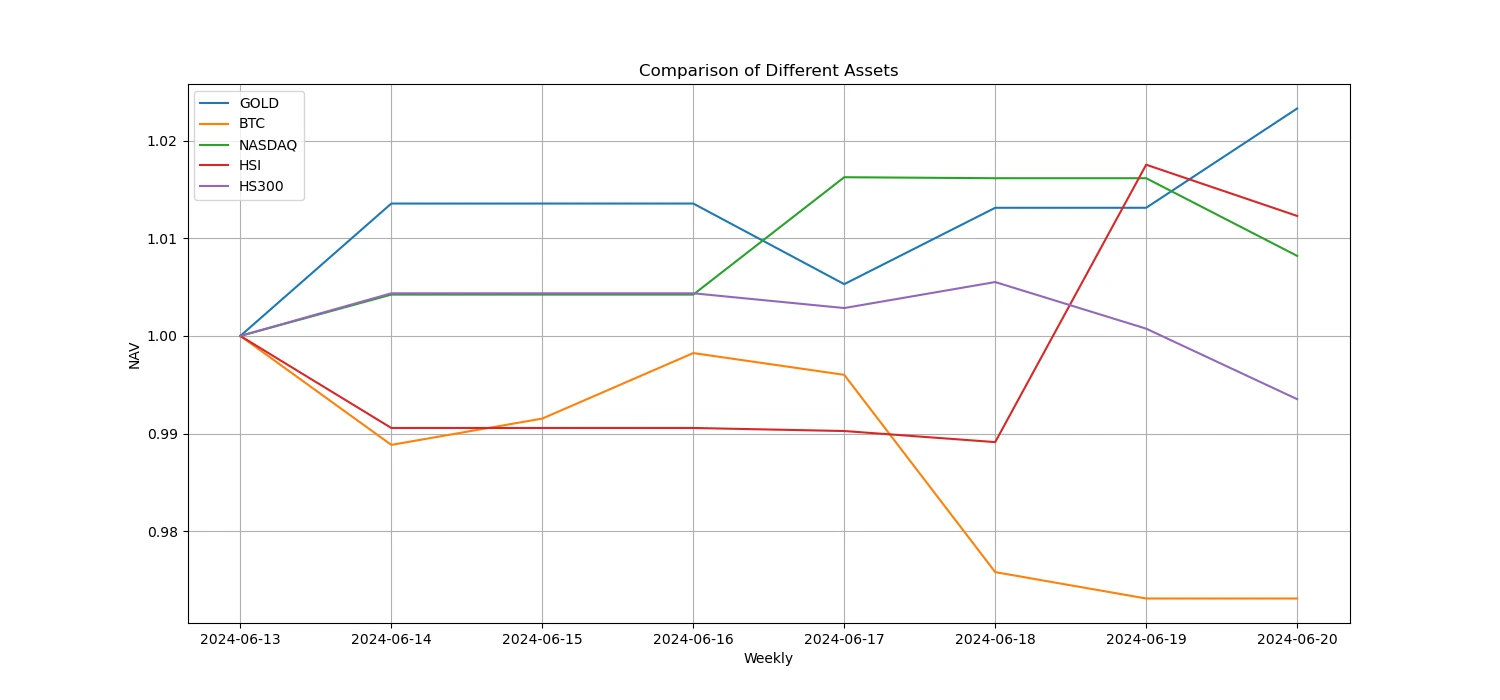
上の図は、過去 1 週間のさまざまな資産の傾向を示しています。

貸出金利_貸出感情
The average annualized return on USD lending in the past week was 10.8%, and short-term interest rates rebounded to around 12.6%.
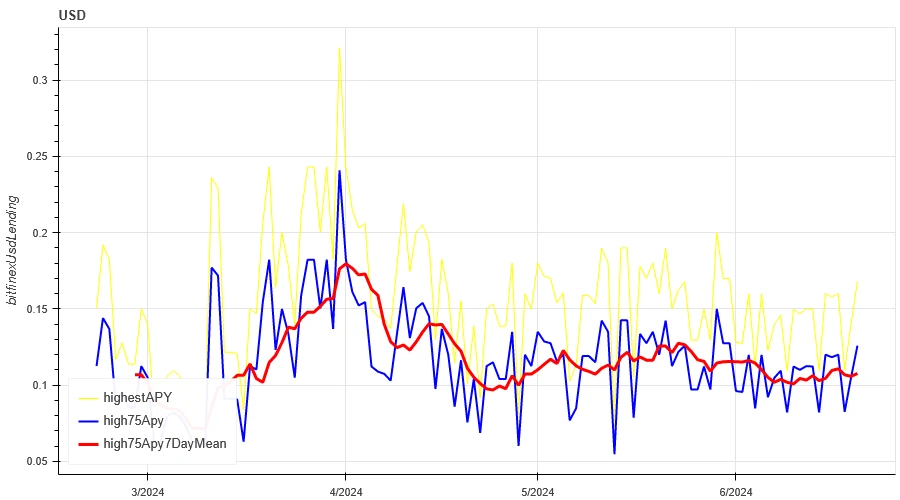
黄色の線はUSD金利の最高値、青い線は最高値の75%、赤い線は最高値の75%の7日間平均です。

この表は、過去の保有日数ごとの米ドル金利の平均リターンを示している。
資金調達率_契約レバレッジ感情
The average annualized return on BTC fees in the past week was 9.6%, and contract leverage sentiment returned to a low level.

青い線はBinanceでのBTCの資金調達率、赤い線は7日間の平均です。

この表は、過去のさまざまな保有日における BTC 手数料の平均リターンを示しています。
市場相関_コンセンサスセンチメント
The correlation among the 129 coins selected in the past week remained at around 0.88, and the consistency between different varieties was at a high level.

In the above picture, the blue line is the price of Bitcoin, and the green line is [1000 floki, 1000 lunc, 1000 pepe, 1000 shib, 100 0x ec, 1inch, aave, ada, agix, algo, ankr, ant, ape, apt, arb, ar, astr, atom, audio, avax, axs, bal, band, bat, bch, bigtime, blur, bnb, btc, celo, cfx, chz, ckb, comp, crv, cvx, cyber, dash, doge, dot, dydx, egld, enj, ens, eos,etc, eth, fet, fil, flow, ftm, fxs, gala, gmt, gmx, grt, hbar, hot, icp, icx, imx, inj, iost, iotx, jasmy, kava, klay, ksm, ldo, link, loom, lpt, lqty, lrc, ltc, luna 2, magic, mana, matic, meme, mina, mkr, near, neo, ocean, one, ont, op, pendle, qnt, qtum, rndr, rose, rune, rvn, sand, sei, sfp, skl, snx, sol, ssv, stg, storj, stx, sui, sushi, sxp, theta, tia, trx, t, uma, uni, vet, waves, wld, woo, xem, xlm, xmr, xrp, xtz, yfi, zec, zen, zil, zrx] overall correlation
市場の幅_全体的な感情
Among the 129 coins selected in the past week, 4% of them were priced above the 30-day moving average, 8.6% of them were above the 30-day moving average relative to BTC, 2.4% of them were more than 20% away from the lowest price in the past 30 days, and 4.7% of them were less than 10% away from the highest price in the past 30 days. The market breadth indicator in the past week showed that the overall market was in a continuous decline for most coins.

上の図は、[bnb、btc、sol、eth、1000 floki、1000 lunc、1000 pepe、1000 sats、1000 shib、100 0x ec、1inch、aave、ada、agix、ai、algo、alt、ankr、ape、apt、arb、ar、astr、atom、avax、axs、bal、band、bat、bch、bigtime、blur、cake、celo、cfx、chz、ckb、comp、crv、cvx、cyber、dash、doge、dot、dydx、egld、enj、ens、eos、etc、fet、fil、flow、ftm、fxs、gala、gmt、gmx、grt、hbar、hot、icp、 icx、idu、imx、inj、iost、iotx、jasmy、jto、jup、kava、klay、ksm、ldo、リンク、ルーム、lpt、lqty、lrc、ltc、ルナ 2、マジック、マナ、マンタ、マスク、マチック、ミーム、ミナ、mkr、ニア、ネオ、nfp、オーシャン、ワン、オント、オプ、オルディ、ペンドル、 pyth、qnt、qtum、rndr、ロビン、ローズ、ルーン、rvn、サンド、セイ、sfp、skl、snx、ssv、stg、storj、stx、sui、sushi、sxp、theta、tia、trx、t、uma、uni、vet、waves、wif、wld、woo、xai、xem、xlm、 xmr、 xrp、xtz、yfi、zec、zen、zil、zrx] 各幅指標の30日間の割合

要約する
Over the past week, the prices of Bitcoin (BTC) and Ethereum (ETH) experienced wide range declines, reaching the peak of volatility on June 18. At the same time, the trading volume of these two cryptocurrencies also reached the highest level during the decline on June 18. Bitcoins open interest volume has declined, while Ethereums open interest volume has increased slightly. In addition, both implied volatilities have increased slightly. In addition, Bitcoins funding rate has fallen to a low level, which may reflect the decline in leverage sentiment of market participants towards Bitcoin. In addition, the market breadth indicator shows that most currencies continue to fall, which indicates that the entire market has generally shown a weak trend over the past week.
ツイッター: @ https://x.com/CTA_ChannelCmt
Webサイト: チャンネルcmt.com
This article is sourced from the internet: Crypto Market Sentiment Research Report (2024.06.14-2024.06.21): Bitcoin ETFs have been continuously sold off in the past 5 days
関連:今夜8時に申し込みが開始され、カミーノ(KMNO)の評価予想を簡単に見てみましょう
オリジナル | Odaily Planet Daily 著者 | Azuma 4月30日北京時間20:00、Solanaエコシステムの主要DeFiプロトコルであるKaminoは、ガバナンストークンKMNOのトークン申請を正式に開始します。 以前、4月5日に、Kaminoは公式ウェブサイトにトークン作成ページを追加しました。 ユーザーは以前、このページを通じて特定のKMNOトークンエアドロップシェアを照会できました。 今夜のオープンクレームは、ユーザーがこのインターフェースを通じて確立されたKMNOシェアを請求し、KMNOをサポートするDEXまたは一部のCEXで取引できることを意味します。 Kaminoのビジネスモデルの内訳 Kaminoのビジネスモデルは複雑ではなく、その基本製品は誰もがよく知っているレンディングプロトコルです。 DeFi Llamaデータによると、Kaminoは現在、DeFiプロトコルで3位、レンディングプロトコルで1位です…


