My XP
0
Login
Original title: Breakdown Metrics Applied: Identifying Local Bottoms in a Bull Market
Original author: Ukaria OC, CryptoVizArt, Glassnode
Original translation: LadyFinger, BlockBeats
Editor鈥檚 Note:
In the rapid evolution of the digital asset market, accurate data analysis has become the key for traders to grasp the pulse of the market. Glassnodes latest 28 segmented indicators also mark a major leap in the field of on-chain analysis. These indicators not only provide in-depth insights into the behavior of short-term holders, but also provide traders with powerful tools to identify market bottoms and optimize trading strategies.
In a significant development in the on-chain analytics space, Glassnode recently launched a suite of 28 new metrics designed to provide a more nuanced perspective on digital asset markets. You can read our original announcement here to learn more.
These granular indicators are a game changer for traders. They provide highly detailed and intuitive insights that can be turned into potential buy and sell signals. One powerful use of these new indicators is to identify exhaustion levels among sellers of different age groups within short-term holders.
Applying our newly segmented indicators, traders can now more precisely determine the severity of unrealized losses and stop-loss timing, which often marks market bottoms and potential entry points during bull markets. This report explores this framework in detail and is summarized below, providing actionable insights for traders aiming to optimize market entry or DCA strategies.
In the context of on-chain analysis, long-term holders (LTH) and short-term holders (STH) represent groups with different behaviors and market impacts. Short-term holders are usually new entrants or speculative traders who are more sensitive to price changes. During bull markets, these investors tend to be the ones who lose the most because they are more likely to sell due to market fluctuations. This phenomenon makes the analysis of short-term holders particularly valuable when used to identify market bottoms.
By segmenting the short-term holder group by age, we help traders more effectively identify periods of seller exhaustion. For example, we can observe how unrealized pressure and capitulation events spread within the short-term holder group, starting from the shortest time frame (1 day) and spreading to longer time frames (1 week to 1 month and even longer). This inside-out progression provides clearer signals of potential bottoms and market reversals.

In other words, through the insights provided by more granular indicators, traders can detect the confluence of capitulation events across different short-term time frames, greatly increasing the likelihood of identifying a short-term bottom.
To identify states of seller exhaustion, we use a range of key indicators that provide insights into unrealized and realized losses within the short-term holder community. The framework consists of the following indicators:
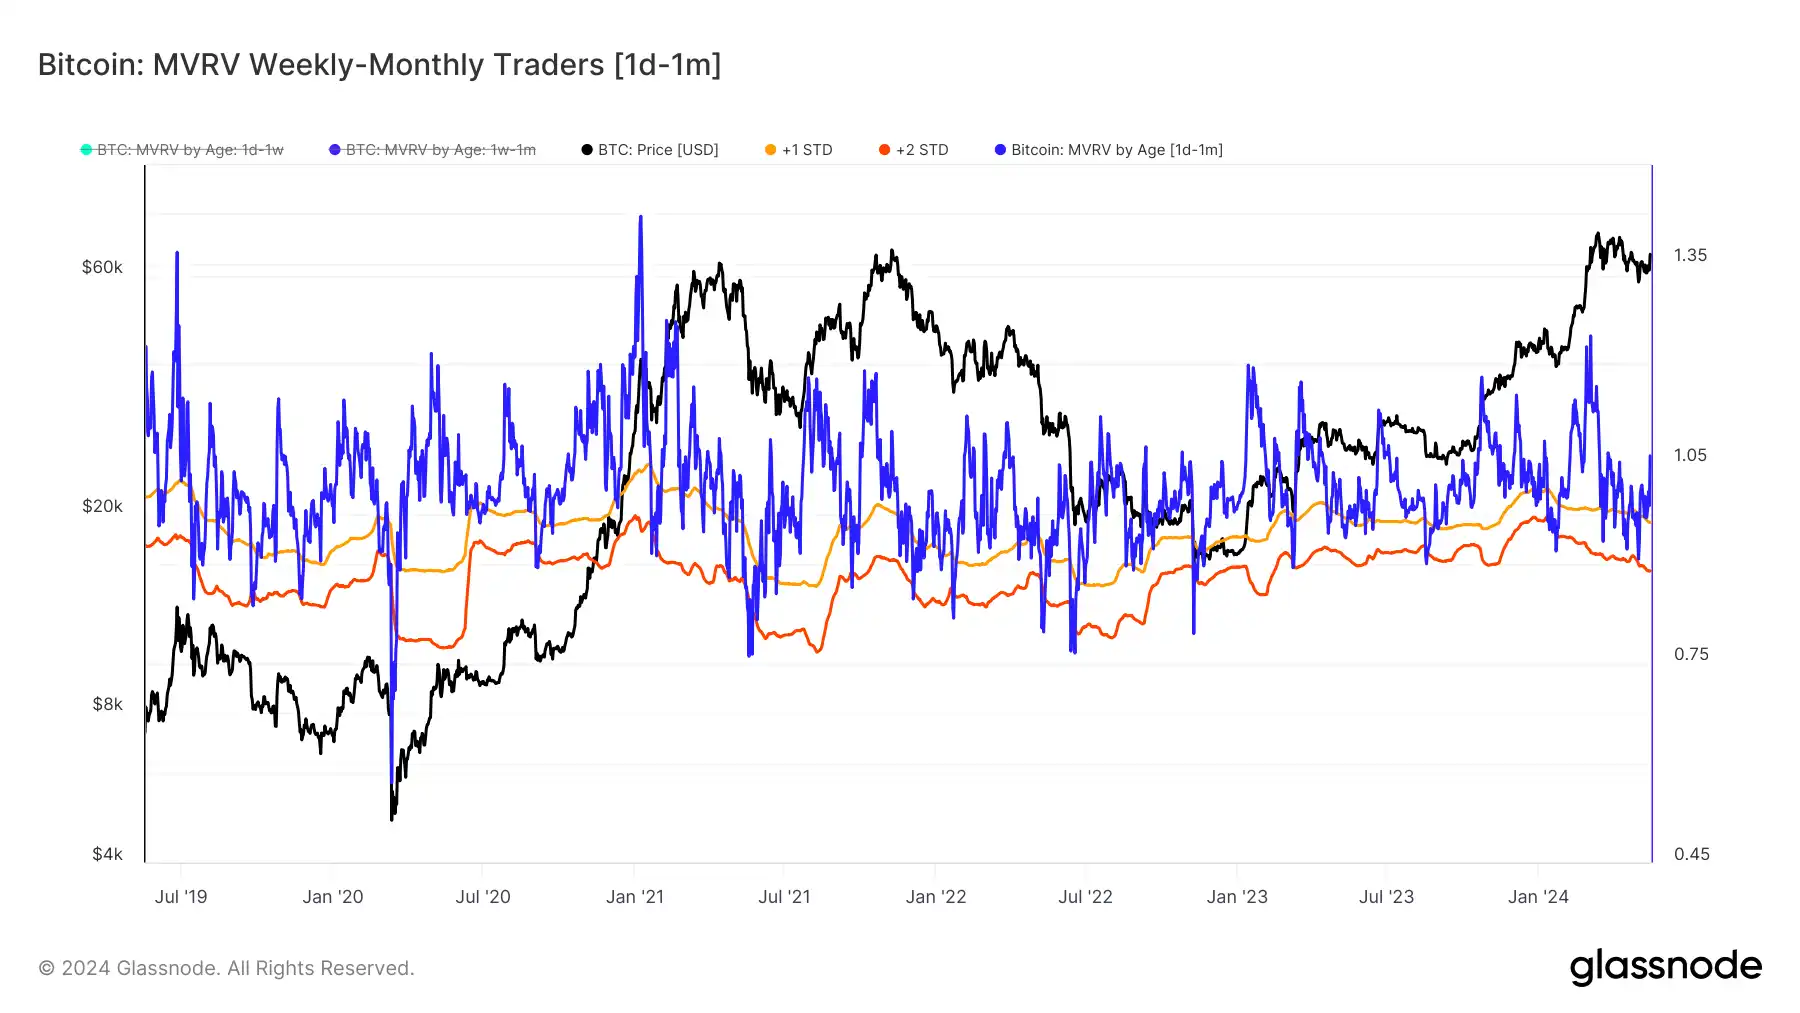
STH MVRV by Age: Market Value to Realized Value (MVRV) measures the unrealized profits or losses of an asset. When MVRV is significantly below average, it indicates a high level of unrealized losses among its holders. This helps detect early signs of seller pressure, as significant unrealized losses often precede actual selling activity by short-term holders.
STH SOPR by Age: The Spent Output Profit Ratio (SOPR) provides insight into whether the unrealized financial pressure observed in MVRV is being acted upon. A negative SOPR Z-score indicates that short-term holders are capitulating, selling their assets at a loss and exacerbating seller pressure.

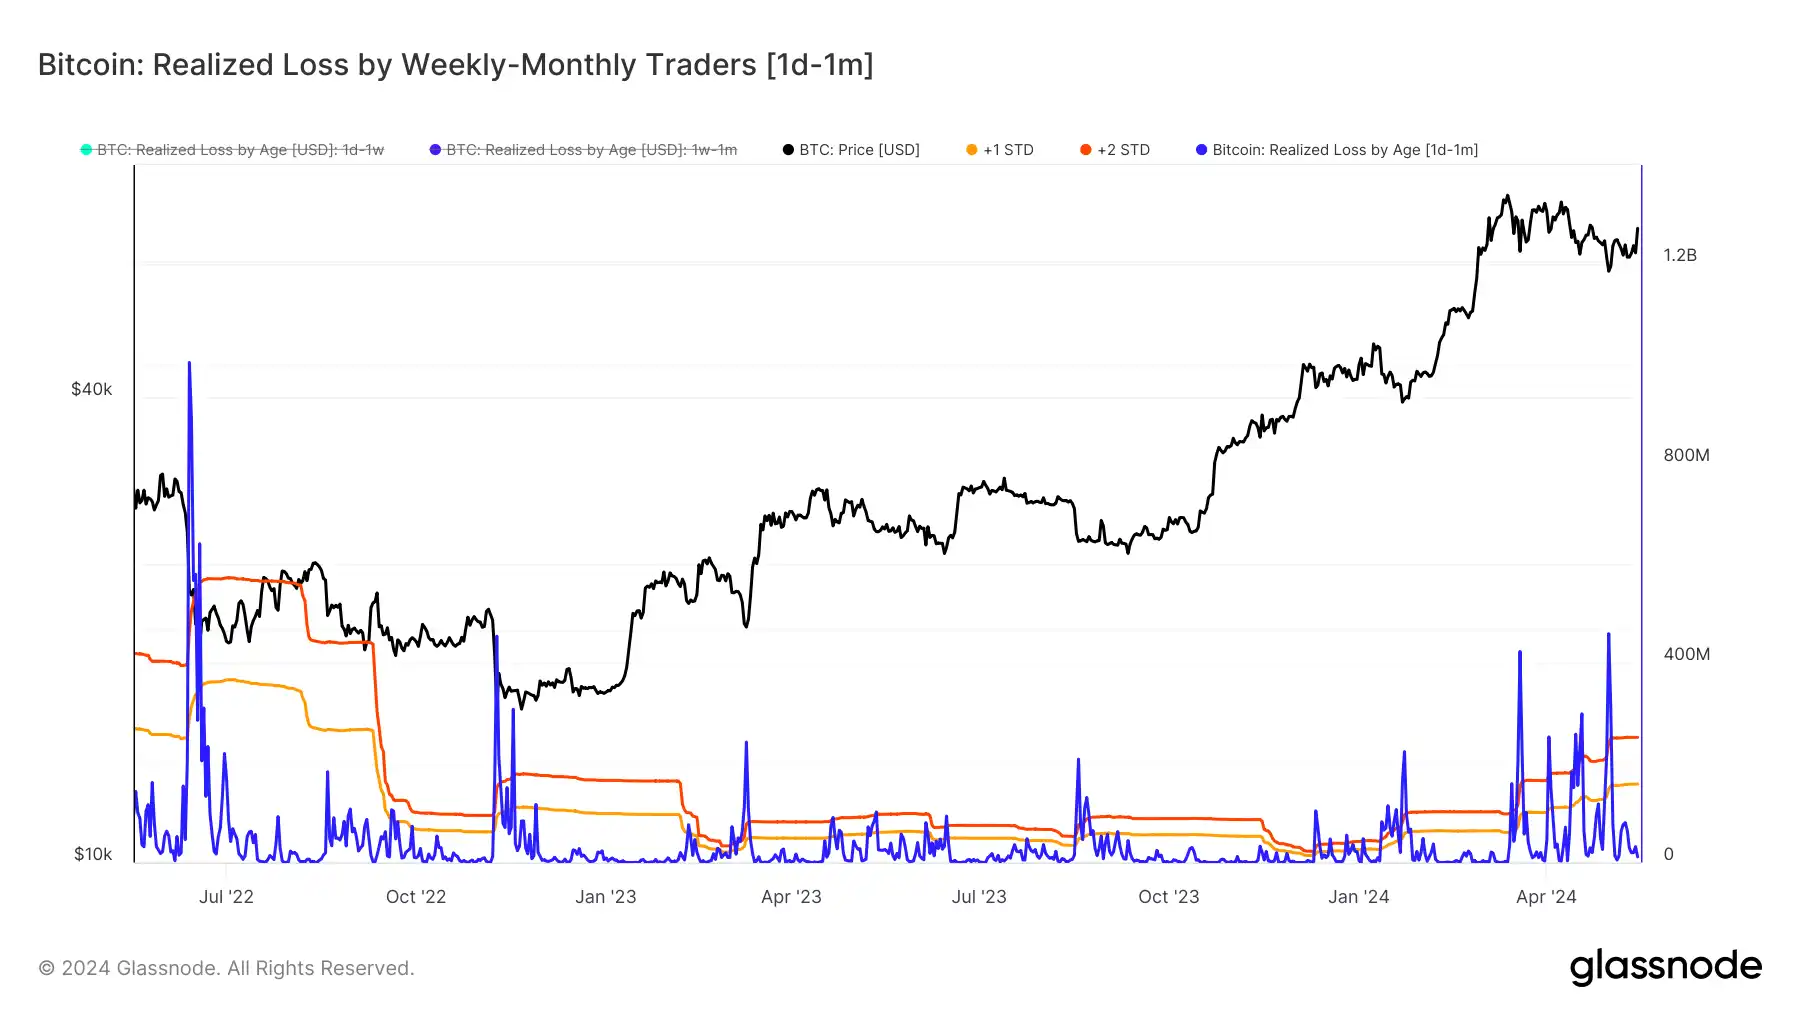
STH Realized Loss by Age: This indicator assesses the magnitude of realized losses by short-term holders. High realized loss values confirm that selling pressure identified by the MVRV and SOPR indicators has emerged, validating periods of seller exhaustion by quantifying the magnitude of realized losses.
By using Z-Scores, we normalize these metrics, making it easier to compare and identify significant deviations from the mean. Z-Scores highlight periods of extreme behavior, making it easier to detect when unrealized and realized losses are unusually high. This normalization helps identify periods of true seller exhaustion, providing traders with clearer signals by filtering out noise and focusing on statistically significant events.
Using Glassnode鈥檚 new Breakdown Indicator to identify points of seller exhaustion in a bull market can provide traders with many advantages. Here are the main benefits:
Early Detection of Local Bottoms: By pinpointing moments of severe unrealized losses and capitulation among short-term holders, traders can identify market bottoms before they become apparent, providing opportunities for early entry points.
Optimized Dollar Cost Averaging (DCA) Strategy: Understanding periods of seller exhaustion allows traders to implement DCA strategies more effectively, buying assets at lower prices at market bottoms to reduce average purchase costs.
Enhanced Market Timing: By observing how selling pressure propagates from the shortest timeframes to longer timeframes within the short-term holder community, traders can better time market entries and exits to maximize profits and minimize losses.
Strategic Flexibility: Segmenting short-term holders by age group allows traders to apply this framework to a variety of trading strategies, from day trading to swing trading to ensure that they can adjust their approach based on specific market conditions. By leveraging the insights provided by our new segmented indicators, traders can gain a competitive advantage in the market and make more strategic and profitable decisions.
Start trading with Glassnodes Breakdown Indicator today
Currently, these powerful segmentation metrics are only available in the Glassnode Enterprise plan. A full overview of the new metrics, dashboards, and documentation is available ここ .
If you are an institutional trader or investor and would like to use these indicators to gain a deeper edge when trading the Bitcoin and Ethereum markets, please contact our institutional sales team 今日。
This article is sourced from the internet: Glassnode: How to determine the market bottom and entry time?
関連:DFGによるビットコインアジアレビューと考察:インフラこそがビットコインエコシステムが最初に解決しなければならない問題点
原著者:ジェームス・ウー、デジタルファイナンスグループ創設者CEO 2024年5月9日、香港で初のビットコインアジアカンファレンスが開催されました。 これまでのビットコインカンファレンスは、基本的にヨーロッパとアメリカで開催されていました。 この動きは、アジアのWeb3業界を新たな高みへと押し上げました。 ビットコインエコシステムの現在の繁栄は、アジアの開発者やプロジェクト関係者を含むアジア市場と切り離せないものです。 おそらくこのため、ビットコインカンファレンスは今年、香港を最初の開催地に選びました。 カンファレンスでは、マクロビットコインエコシステムとレイヤー2テクノロジーの現状と将来の発展について最も多くの議論が交わされました。 もちろん、これらはすべてビットコインの金融属性と取引を中心に展開されています。 カンファレンス会場には、プロジェクト関係者、マイニングなどの出展者が集まりました…


