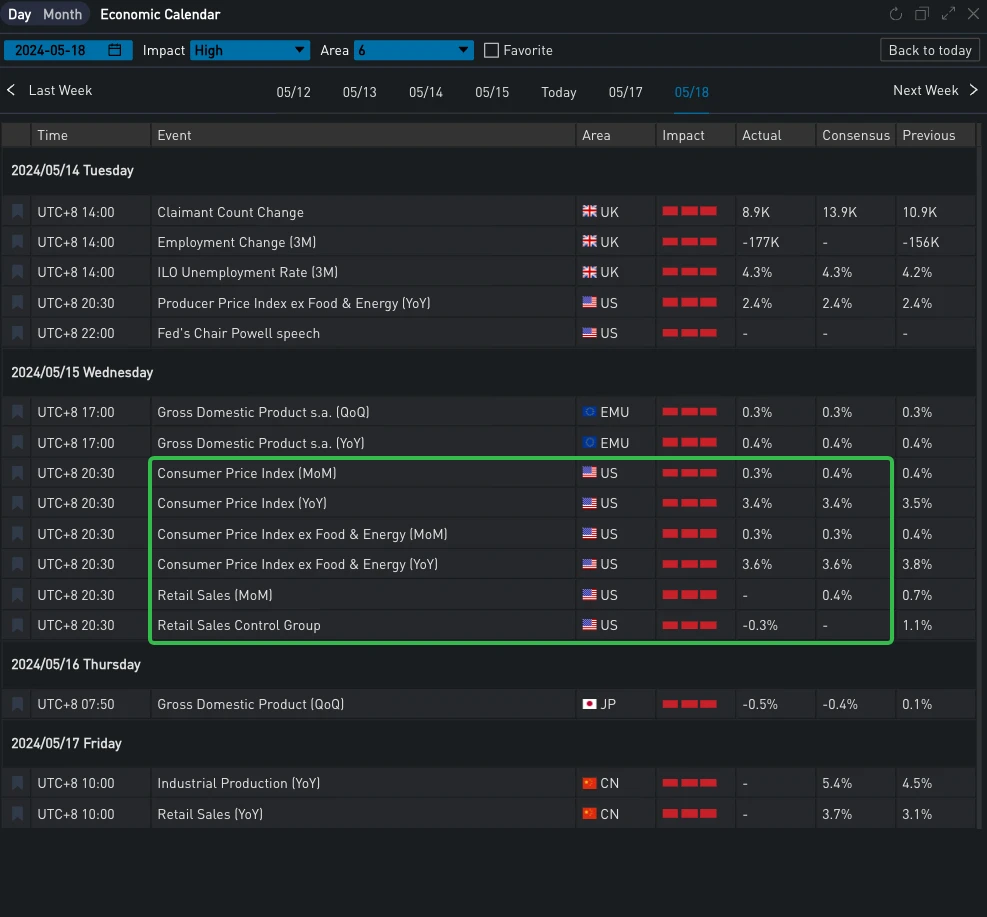
昨日(5月24日)重要な経済データが発表されました。ここ数日、インフレデータは3回連続で予想を上回り、米国のCPI指数はほぼ予想通りでした。小売データは予想外に横ばいで、最近の消費者データの弱さが続いています。現在のインフレレベルと勢いは依然としてFRBの目標をはるかに上回っていますが、この2つのデータにより、価格の再加速に対する市場の懸念がある程度和らぎ、FRBの9月の利下げに対する市場の信頼が回復し、米国債利回りは短期的に低下しました。米国の3大株価指数も約1%上昇して、過去最高値を更新しました。
出典: SignalPlus、経済カレンダー
出典: 投資
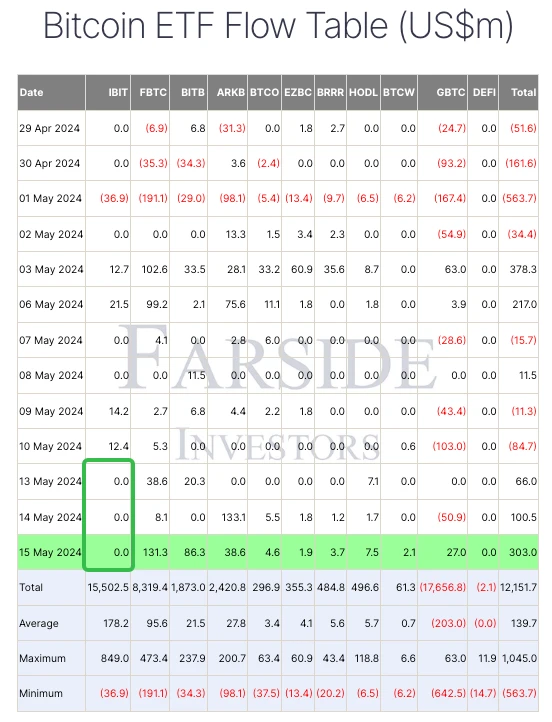
デジタル通貨に関しては、米国の経済指標の弱体化に後押しされ、BTCの価格は66,000の水準を突破するまで上昇を続け、コミュニティのカーニバルを魅了しています。BTCスポットETFの最近の流入も比較的健全です。IBITはもはや成長していませんが、昨日の1日あたりの流入総額は303 $mに達し、主にFBTCとBITBが貢献しました。一方、以下の比較チャートから、このラウンドの市場でのETHのパフォーマンスは比較的悪いことがわかります。過去24時間で、BTCの増加の半分しか得られず、3,000米ドル付近に戻りました。
出典: TradingView
出典: ファーサイド・インベスターズ
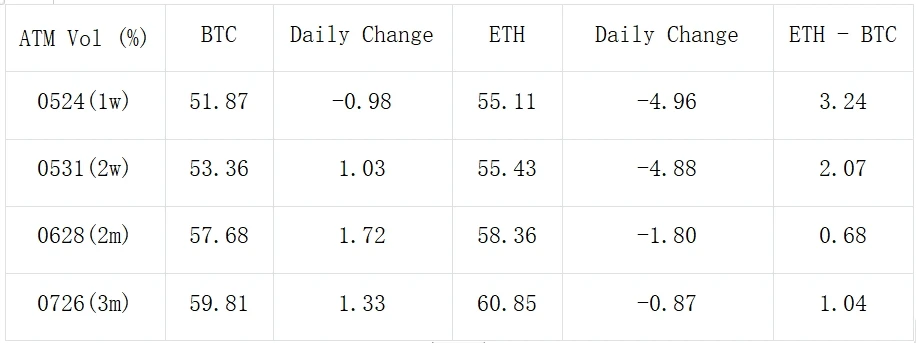
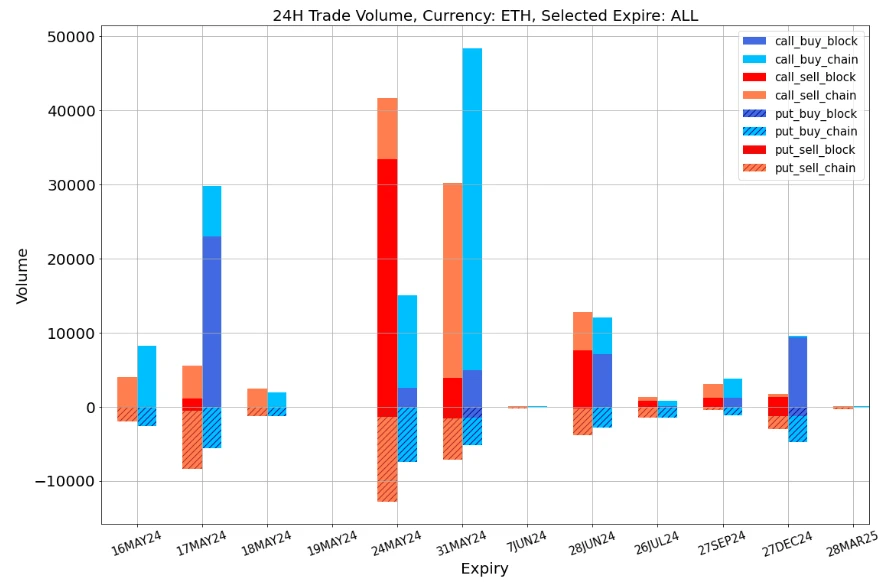
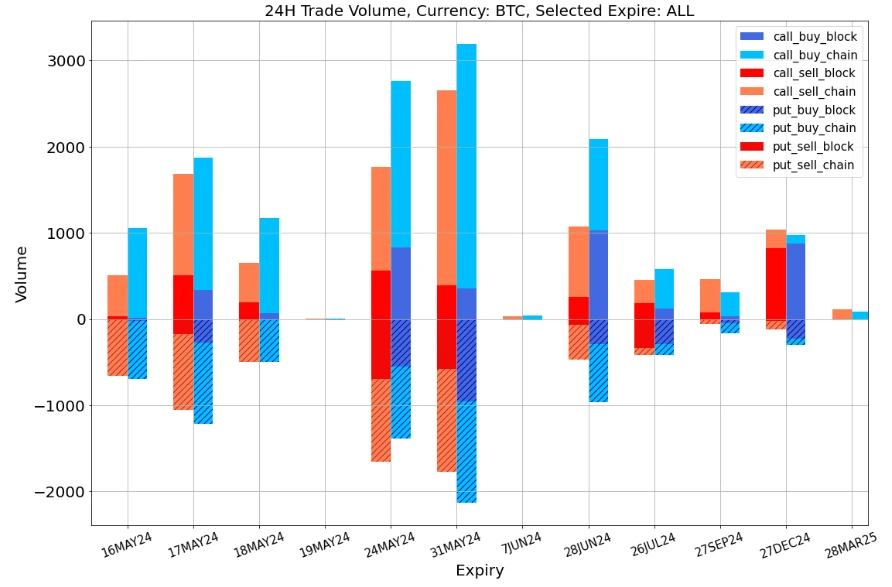
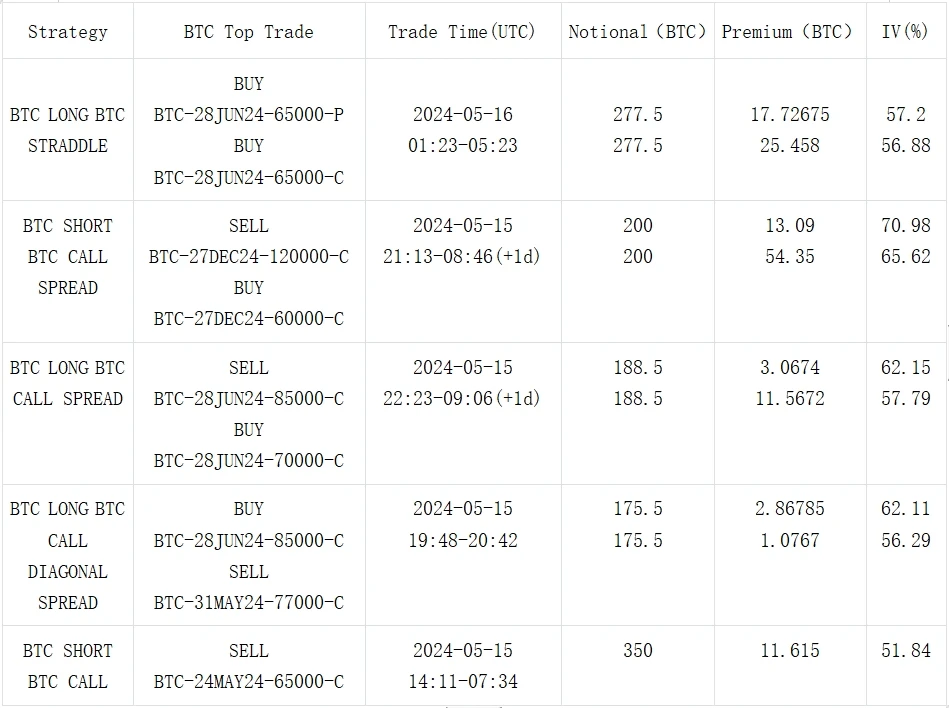
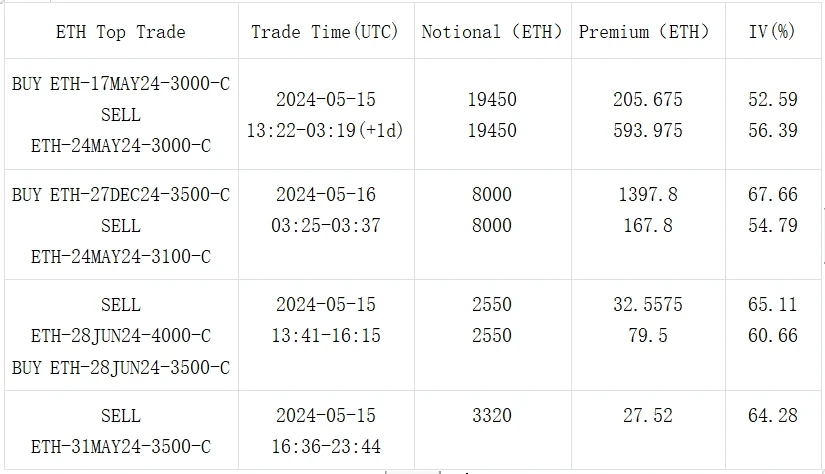
オプションの面では、BTCとETHのインプライドボラティリティレベルも非常に異なる変化を示しました。BTCの主な変化は、中長期IVの上昇に反映されています。過去1日のブロック取引も、主に中長期に分散されています。最大のものは、6月末のボラティリティに強気な、レッグあたり277.5BTCのロングストラドルと、5月売りと6月コール買いの対角スプレッドです。ETHのフロントエンドIVは急落し、ブロック上でレッグあたり最大19,450 ETHのボリュームを持つ5月17日の買い対5月24日の売りの取引グループを引き付けました。同時に、5月末のオプションチェーンには多くのコールオプションのポジションもあります。ETHは最近比較的パフォーマンスが悪いですが、次の上昇スペースにお金を払っているトレーダーはまだいます。
出典: Deribit (2016年5月16日 16:00 UTC+8時点)
出典: SignalPlus
データソース: Deribit、ETH取引の全体分布
データソース: Deribit、BTC取引の全体分布
出典: Deribit ブロック取引
出典: Deribit ブロック取引
ChatGPT 4.0のプラグインストアでSignalPlusを検索すると、リアルタイムの暗号化情報を取得できます。最新情報をすぐに受け取りたい場合は、Twitterアカウント@SignalPlus_Web3をフォローするか、WeChatグループ(アシスタントWeChatを追加:SignalPlus 123)、Telegramグループ、Discordコミュニティに参加して、より多くの友人とコミュニケーションを取り、交流してください。SignalPlus公式サイト:https://www.signalplus.com
この記事はインターネットから引用したものです:SignalPlusボラティリティコラム(20240516):マクロ経済は好調、BTCは66,000に戻る
関連: Fantom (FTM) 価格予測: 2 年ぶりの高値を記録できるか?
要約 トレーダーの保有する FTM の供給量はここ数日で大幅に減少しており、中期および長期保有者の増加を示しています。FTM の 7 日間 RSI は現在 77 で、先週の 81 から下がっており、依然として買われすぎの状態を示しています。EMA ラインは強気シナリオを描いており、FTM 価格がまもなく 2 年ぶりの高値に達する可能性があります。ここ数日のトレーダー間の FTM の供給量の減少は、中期および長期保有者による蓄積への顕著なシフトを示しており、FTM の将来性に対する信念が強まっていることを示しています。FTM 価格は、買われすぎゾーンにあるにもかかわらず、7 日間 RSI が投資家の関心の高さを示しており、ポジティブな市場センチメントによって支えられています。指数移動平均 (EMA) ラインが示唆する強気トレンドは、…


