Trading on the expectation of US recession, BTC recorded the second largest weekly decline in this cycle (03.03~03.09)
Informasi, opini, dan penilaian mengenai pasar, proyek, mata uang, dll. yang disebutkan dalam laporan ini hanya untuk referensi dan bukan merupakan nasihat investasi.
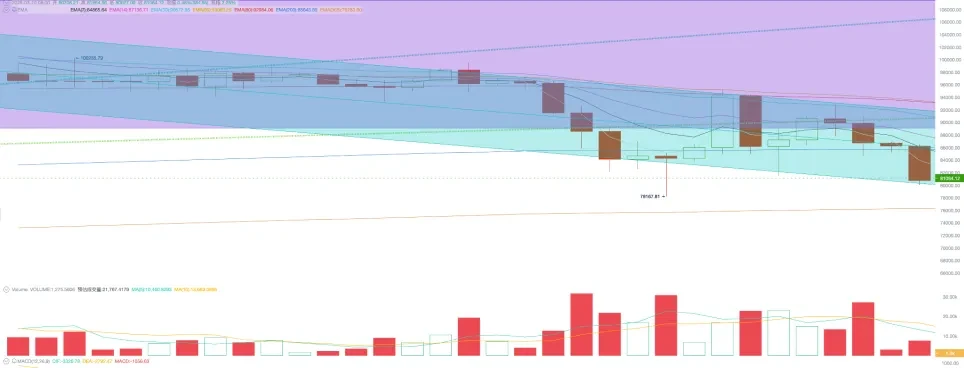
This week, BTC opened at $94,265.47 and closed at $80,699.17, a weekly plunge of 14.39% and an amplitude of 15.29%. The trading volume decreased compared with last week, but remained high. The BTC price fell below the Trump bottom (89,000 ~ 110,000 USD box), significantly retracing the gains of the Trump transaction.
Over the past two weeks, BTC has been experiencing both ice and fire.
On the one hand, as Trump’s tariff policy fluctuated and became chaotic, U.S. stocks began to trade in a “recession” and gave up most of the gains since the “Trump deal,” causing the BTC Spot ETF to suffer the largest outflow since its inception.
On the one hand, Trump signed the BTC Strategic Reserve Executive Order and held the first White House Cryptocurrency Summit to convey many positive information on kripto asset regulation and use cases. Texas also passed a state-level BTC reserve bill. It can be said that the use cases and policy environment of crypto assets including BTC in the United States are actually getting better.
However, investor sentiment dominates short-term price movements. With the US stock markets Trump Trade rally, BTC also fell 14.39% this week, the second largest weekly drop in this cycle. Although it did not fall below the lowest point on February 28, it has broken through the Trump bottom and the 200-day bull-bear dividing line. The Fear Greed Index fell back to 20 points, which is extreme fear.
With the release of non-farm data on Friday and the dovish speech of the Fed Chairman, the US stock index rebounded and stabilized temporarily, but the short-term and medium-term trend in the future is still not optimistic, depending on Trumps tariff policy and the trend of US economic data. The trend of BTC will continue to be constrained by the trend of US stocks and does not have the conditions to break out of the independent market.
Macro-financial and economic data
The U.S. job market showed signs of slowing down again on Friday. Nonfarm payrolls increased by 151,000 in February, slightly lower than market expectations, and the unemployment rate unexpectedly rose to 4.1% from 4% in the previous month, the highest since November last year.
Later, Fed Chairman Powell said that despite the uncertainties, the current US economic situation is still good, the job market is stable and balanced, and the Fed should remain cautious. There is no need to rush to adjust the policy interest rate at this stage. We can patiently wait for the situation to become clearer. The cost of being cautious is very, very low. The uncertainty caused by Trumps policy changes is still high. The Fed is evaluating the impact of changes in trade policies, and these changes have exacerbated economic uncertainty.
This statement is consistent with the Feds usual stance and is nothing new. However, it may be in response to the decline of US stocks and the markets fear of recession, so it subsequently released a dovish statement.
Powell said that if the economy continues to remain solid and inflation fails to fall further back to the 2% target, the Fed may maintain the current benchmark interest rate. However, if the job market unexpectedly weakens in the future or inflation falls significantly, the Fed will consider resuming interest rate cuts.
Based on signs of weakening economic data and adjustments in U.S. stocks, CME Fed Watch shows that traders are betting that the Federal Reserve will cut interest rates three times this year, by about 75 basis points.
Affected by this, the US dollar index fell 3.52% for the whole week, closing at 103.882. The Nasdaq rebounded on Friday, breaking through the annual line and closing above it, and the SP 500 broke through the 200-day line and closed above it. The 2-year US Treasury yield rose slightly, and the 10-year US Treasury rose by more than 1.89%.
Fridays non-farm payrolls data slightly improved traders expectations that had previously fallen sharply. However, concerns about a recession or stagflation in the U.S. economy have not been eliminated. At most, it is a correction to the previous sharp downward pricing. Whether the rebound of U.S. stocks and BTC can continue requires more observation, and whether it can bottom out and reverse requires more guidance from economic data.
One psychological support for long positions is that the Trump trade has been reversed in the U.S. stock market. The three major stock indexes have returned to the points before Trumps victory on November 5.
Technical Analysis
Compared to the U.S. stock market, BTC has maintained a relatively strong trend, and its current price is still around 15% higher than its high on November 5.
Technically, BTCs trend is still not optimistic. It has fallen out of the Trump bottom and is running below the first trend line of the bull market (the dark green dotted line in the figure). Moreover, since the historical high on January 21, BTC has formed a downward channel (the green box in the figure), suppressing BTCs rebound several times.
On Sunday night, bears attacked the market again, and BTC plunged below the 200-day moving average again. The intensity of this adjustment and weak performance are similar to the market performance from July to September 2024. The market is already in an extremely oversold state in the short term, but it may take more external conditions and time to get out of the downturn.
Selling pressure and selling
After the panic selling at the breakout last week, the selling pressure dropped significantly this week. Long and short hands sold a total of 147,351 coins, falling to the previous normal level. However, the exchange inventory increased by more than 5,000 coins, indicating that although the selling pressure has decreased, the buying power is still insufficient.
According to the data on the chain, the overall floating profit rate of the market is 198%, the long hand is 347%, and the short hand floating loss is 6%. Short hands continue to be under pressure. In a bull market, short hands in a floating loss state are often a good opportunity to enter the market in the medium term.
Stablecoins and BTC Spot ETF
Compared with the net outflow of 4.081 billion funds in the same direction in the two channels last week, the high pressure of trial production was alleviated to a certain extent this week, with a total inflow of 1.295 billion US dollars, of which stablecoins inflowed 2.107 billion US dollars and BTC Spot ETF outflowed 719 million US dollars. The outflow of the BTC Spot ETF channel was the source of selling pressure that caused the market to fall.

Crypto market capital inflow and outflow statistics (eMerge Engine)
In February, the 11 BTC Spot ETFs in the United States experienced the largest outflow since their approval, reaching $2.3 billion. After entering March, the outflow continued but the scale decreased. The outflow groups included retail and institutional selling, as well as the liquidation of CME contract arbitrage traders. From the perspective of the transmission path, the stabilization of BTC prices requires the stabilization of US stocks, and the ETF holders will turn from net outflows to net inflows.
Cycle Indicators
According to the eMerge engine, the EMC BTC Cycle Metrics indicator is 0.375, and the market is in an upward relay period.
EMC Labs didirikan oleh investor aset kripto dan ilmuwan data pada bulan April 2023. EMC Labs berfokus pada penelitian industri blockchain dan investasi pasar sekunder Kripto, mengambil pandangan ke depan industri, wawasan dan penambangan data sebagai daya saing intinya, dan berkomitmen untuk berpartisipasi dalam industri blockchain yang sedang booming. melalui penelitian dan investasi, serta mempromosikan blockchain dan aset kripto untuk memberikan manfaat bagi umat manusia.
Untuk informasi lebih lanjut, silakan kunjungi: https://www.emc.fund
This article is sourced from the internet: Trading on the expectation of US recession, BTC recorded the second largest weekly decline in this cycle (03.03~03.09)
This weeks highlights February 10 Berachain Foundation: The second part of the airdrop will be distributed to the wallet on February 10. Registration is required before claiming . B3.fun: The airdrop qualification query website is now online, and the token will be launched on February 10 ; February 11 (23:00) Federal Reserve Chairman Powell attends a Senate hearing and delivers semi-annual monetary policy testimony ; February 12 (21:30) The United States will release the January CPI data ; (23:00) Powell will deliver semi-annual monetary policy testimony to the House Financial Services Committee ; February 13 (21:30) The United States will release January PPI data at 21:30 on February 13 ; From February 10 to February 16, more noteworthy events in the industry are previewed below. February 10 It is rumored…


