Key indicators (November 11, 4 p.m. – November 18, 4 p.m. Hong Kong time)
-
BTC/USD price increased by 13.0% (81.2k-91.75k USD), ETH/USD price decreased by 0.3% (3.14k-3.13k USD)
-
BTC/USD ATM volatility at the end of December increased by 5.2 points (51.8->57.0), and the skewness on December 25th increased by 2.7 points (3.2->5.9)
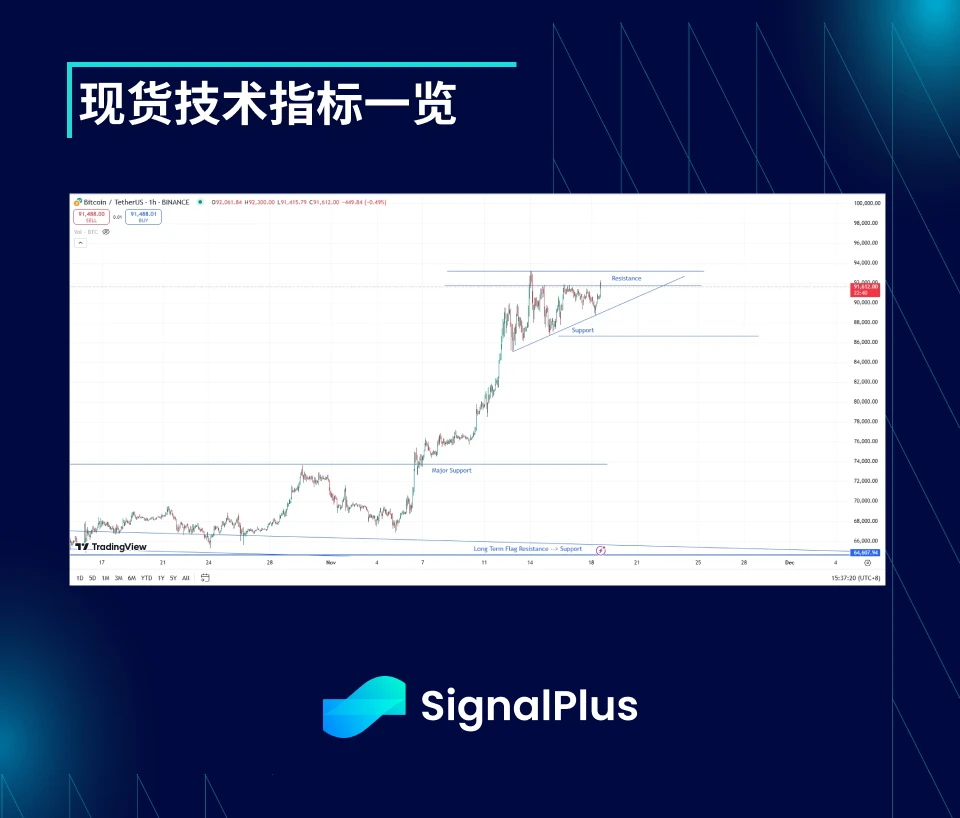
Spot technical indicators at a glance
The market started to accelerate upwards this past week, and any initial signs of overbought were eventually replaced by strong momentum. The market should have accumulated a lot of Gamma around 90k, because the market was initially blocked at this point many times, and then tried to break through upwards and finally reached 93.25k. At present, 91.75k-93.5k will be our top resistance level.
Referring to the chart above, the first support level is a diagonal support slightly below the current price level, which will continue to exert pressure to memandu the market to test the price high. If the price completely breaks down this support level, we will find good support around $85k-86.25k again. But further down we expect to see a wave of violent position liquidation.
The daily and hourly ranges have already started to show signs of contraction. If the price fails to break above $93.5k, we would expect to see realized volatility adjust downwards. We remain bullish in the long term and reasonably expect a target of $105k-115k in Q1 of next year. But in the meantime, we expect the market to stabilize and take a short break over the next 6 months. If we see stronger evidence of a contraction in the range (at least in the short term) in the next week or two, this view will be confirmed and begin to put pressure on Gammashi positions.
Pasar Theme
The “Trump trade” continued in full force this week. The USD continued to rise against other fiat currencies, while US Treasury yields continued to climb. Cryptocurrencies once again showed no correlation with the USD. Bitcoin surged to over $90k, while other small coins also saw amazing gains. US stocks had a good week and saw a sharp drop in the VIX index, before taking a break over the weekend. But this was just a small correction in this bull trend.
The focus has now turned to Trumps cabinet picks, with kripto eyes focused on the upcoming announcement of the Secretary of the Treasury. Scott Bessant initially looked like the most likely candidate, but Elon Musk endorsed Howard Lutnick over the weekend. Both could be considered crypto-friendly, though Lutnick is more so. However, it looks like the final pick is still a ways off, as Kevin Walsh and Mark Rowan have been added to the list in the past 24 hours.
It looks like there is continued demand after MSTR announced it bought over 27,000 BTC around the election, as the company’s shares are still trading at their highest point, with a 2.5x net asset premium to the spot price of Bitcoin. BTC/USD has been well supported on every pullback, and even with ETF outflows from ARKB and BITB on Thursday and Friday, the price still managed to re-enter $90k over the weekend.
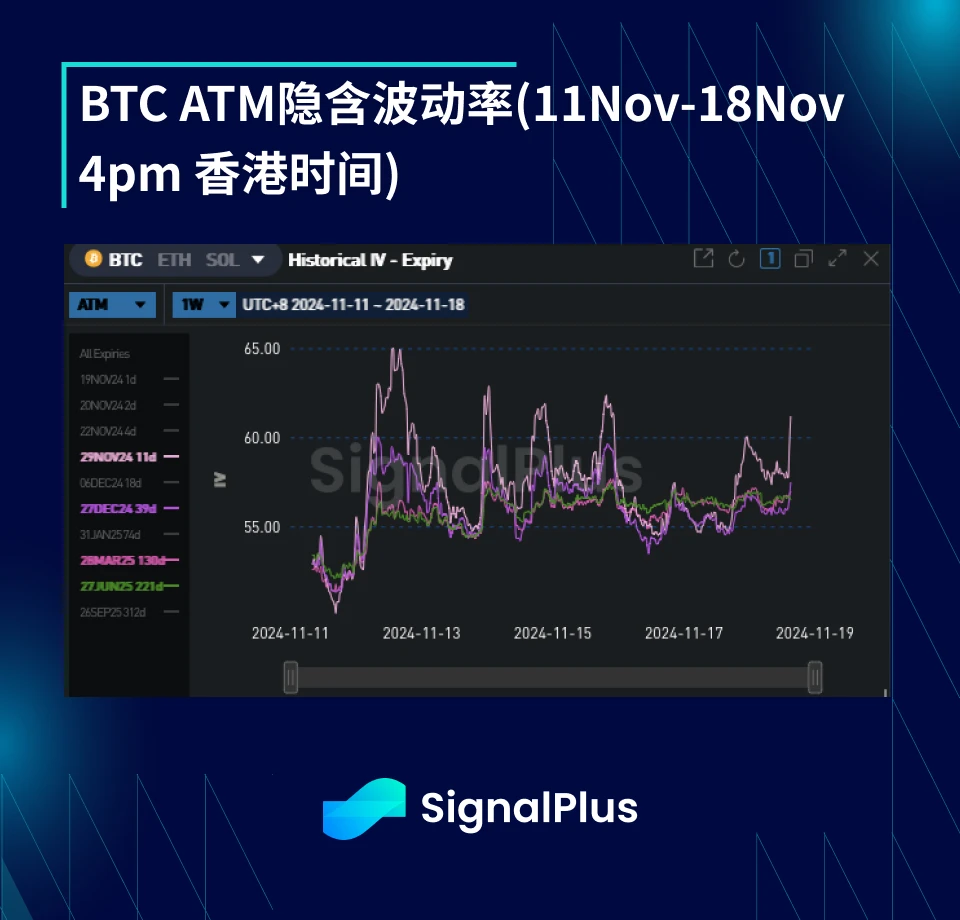
ATM Implied Volatility
-
After the price of the coin broke through the resistance level of 80k-82k USD on Monday night, it continued to rise, and the implied volatility level rose sharply. As the market reached the level of 93k USD, the high-frequency actual volatility was pushed to the 60s, and then the price of the coin returned to the range of 87k-93k USD with a rather violent oscillation level.
-
The volatility of the currency price came earlier than the market expected, and at the same time, the rapid increase in actual volatility caused the volatility term structure to invert rapidly. The ATM implied volatility on 29 Nov rose from a low of 47-48 10 days ago to a high of 65. The volatility levels farther out on the curve were also dragged up in a time-weighted manner.
-
There is a structural argument that volatility will gradually weaken in the new situation. If Trump succeeds in pushing for regulation of cryptocurrencies, a large amount of funds will flow in and eventually provide support for the price of the currency, further reducing volatility. Moreover, the current price level has already taken this into account to a large extent. Although the price of the currency is still fluctuating sharply, the actual volatility is still not above the 60s, and the implied volatility of the same-day expiration continues to range from the lowest 50s to the highest 60s (the average level this year is 45-50). But for now, bullish momentum has stimulated demand for the 100k-150k price range from the end of the year to the end of January next year, while providing support for implied volatility.
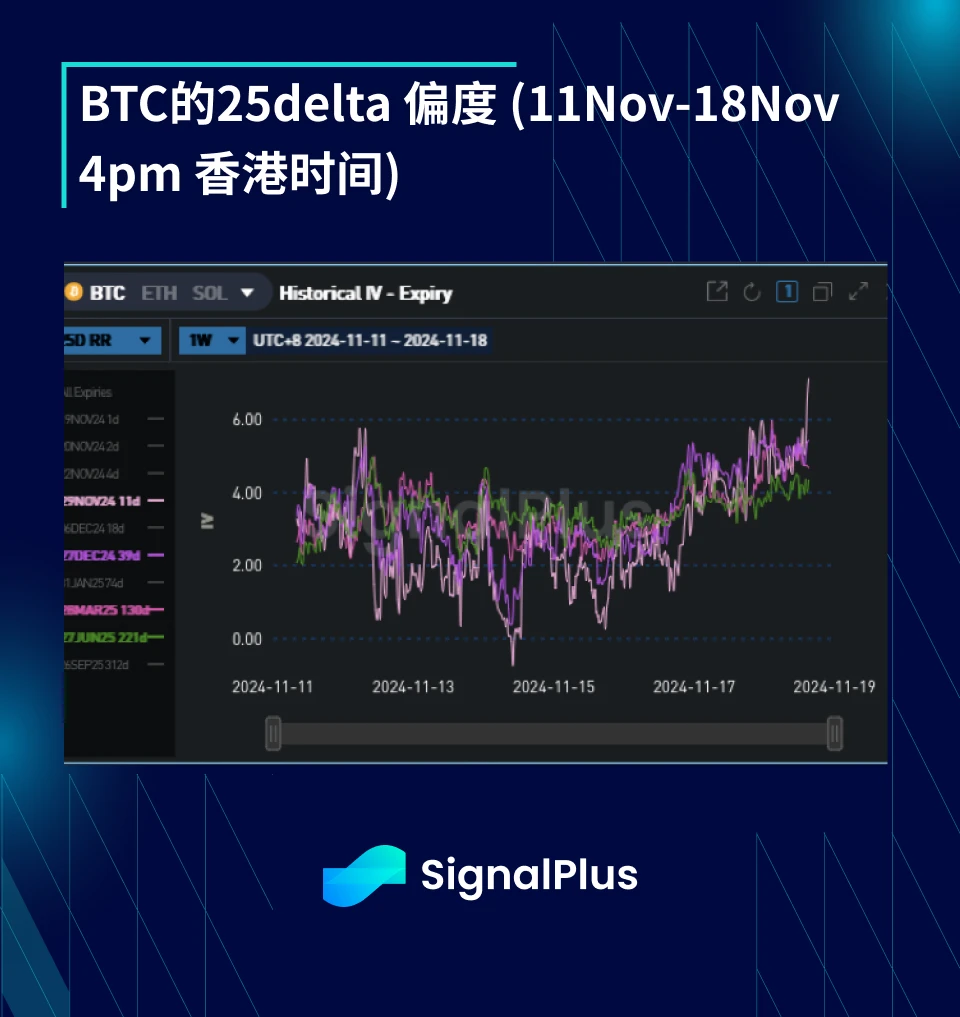
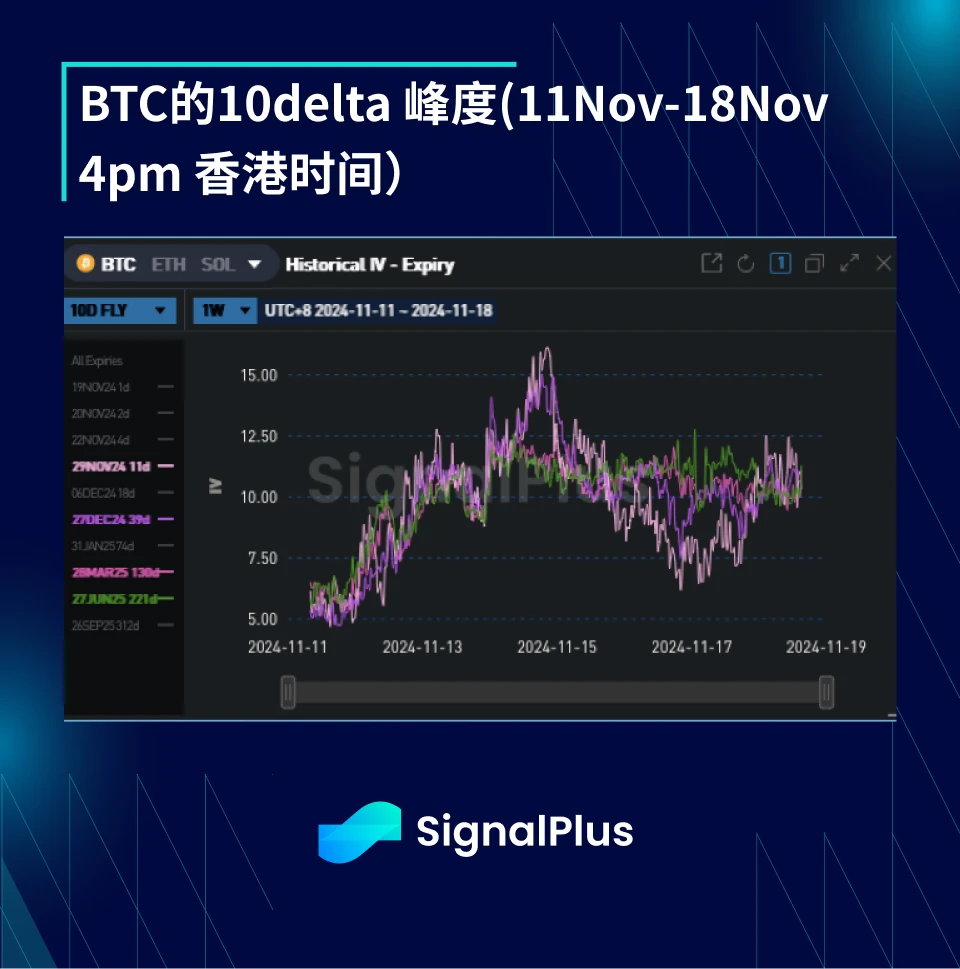
Skewness/Kurtosis
-
Skewness continued to rise this week (mostly on the bullish side), mainly because the market is eagerly waiting for the price to break further upward. Implied volatility continues to show a positive correlation with the price. When the price fell to the 87-88k range, the implied volatility was suppressed across the curve, but sellers quickly withdrew whenever the price tried to break through the 91.5k-93.5k USD range again. In addition, the closing of in-the-money call spreads and rolling positions also drove the skewness up.
-
As realized volatility moves faster, the kurtosis also increases significantly. This week we observed an increase in demand for upside wings, especially above $100k. We also saw some demand for downside wings in the shorter term, mainly for spot or margin protection.
Semoga sukses bagi semua orang di minggu mendatang!
Anda dapat menggunakan fungsi baling-baling perdagangan SignalPlus di situs web signalplus.com untuk mendapatkan informasi kripto terkini yang lebih banyak. Jika Anda ingin segera menerima pembaruan kami, silakan ikuti akun Twitter kami @SignalPlusCN, atau bergabunglah dengan grup WeChat kami (tambahkan asisten WeChat: SignalPlus 123), grup Telegram, dan komunitas Discord untuk berkomunikasi dan berinteraksi dengan lebih banyak teman.
Situs Web Resmi SignalPlus: https://www.signalplus.com
This article is sourced from the internet: BTC Volatility Weekly Review (November 11-November 18)
Dalam seminggu terakhir, BTC akhirnya berhasil menembus level tekanan sebelumnya dan memasuki kisaran $67.000-$69.000. Pada tanggal 21, BTC berhasil menembus $69.000 dan mencapai titik tertinggi $69.519. Meskipun mengalami resistensi dan turun ke $66.571 pada hari yang sama, BTC kembali ke atas $67.000 karena pasar membuka posisi pada saat penurunan. Pada saat artikel ini diterbitkan, harga BTC berfluktuasi sekitar $67.185 (data di atas berasal dari spot Binance, 22 Oktober pukul 15:00). Saat ini, BTC memiliki level resistensi yang kuat di dekat $70.000, dan harganya relatif ringan dalam jangka pendek. Namun, seiring mendekatnya pemilu AS, efek Trump secara bertahap muncul dan pasar mengatur posisi terlebih dahulu, jika BTC berhasil menembus level resistensi, diharapkan akan menantang…


“If you’ve lost money fraudulently to any company, broker, or account manager and want to retrieve it, contact www.Bsbforensic.com They helped me recover my funds!”