My XP
0
Gabung
Episode Dialogue Trader kali ini mengundang @BensonTWN , the founder of CoinKarma. Thanks to @sky_gpt for introducing us. Benson shared in great detail the changes in his trading strategies in different cycles and how CoinKarmas indicators memandu berdagang dalam berbagai kondisi pasar. Setelah mengobrol, saya merasa bahwa Benson selalu menggunakan cara berpikir nonkonsensus tentang cara membangun struktur perdagangannya sendiri untuk mengungguli orang lain, karena pada dasarnya, perdagangan kontrak adalah permainan tentang cara memenangkan hati kebanyakan orang.
*Semua teks hanya untuk berbagi dan tidak merupakan nasihat investasi.
1) Apa strategi perdagangannya?
Di pasar yang volatil, Benson akan mencari posisi dengan margin keamanan yang lebih tinggi berdasarkan indikator untuk berpartisipasi di pasar; pada saat yang sama, ia memperhatikan indikator seperti arus masuk BTC dan CVD bursa untuk menilai tren pasar.
Benson telah memberikan sebagian besar posisinya (lebih dari setengah) kepada strategi kuantitatif untuk apresiasi berbasis mata uang, terutama menimbun dan menyimpan koin; sekitar 40% dari posisinya sebagian besar adalah stablecoin, yang digunakan untuk perang gerilya, berpartisipasi dalam transaksi on-chain atau transaksi kontrak orde pertama.
Strategi perdagangan Benson tidak mencari pertumbuhan eksplosif, tetapi lebih berfokus pada stabilitas. Sasarannya adalah mengungguli pasar, dengan kinerja tahun berjalan sekitar 2 hingga 3 kali lipat.
Target yang berbeda memiliki metode operasi yang berbeda. Untuk target yang mungkin menjadi titik panas pasar, Benson akan menahannya hingga pasar memperhatikan atau pasar bullish berakhir; untuk token dengan kapitalisasi pasar yang lebih besar, ia akan menggunakan analisis teknis atau analisis fundamental untuk menentukan kemungkinan tren harga.
2) Mengapa strategi perdagangan seperti itu muncul?
Awalnya, Benson, seperti banyak trader pemula, sering melakukan stop loss dan mengalami kerugian besar karena mengejar naik turun. Pengalaman ini membuatnya menyadari bahwa fluktuasi pasar sering kali dimanipulasi oleh dana-dana besar, terutama di pasar kontrak, di mana investor-investor besar menciptakan fluktuasi untuk memanen investor ritel dengan likuiditas yang lemah. Perdagangan kontrak adalah permainan tentang bagaimana cara memenangkan hati kebanyakan orang, dan mengalahkan kebanyakan orang dengan cara konsisten dengan arahan para investor besar. Karena alasan ini, Benson mulai berpikir tentang bagaimana cara menggunakan data untuk mengikuti operasi para investor besar.
Dari tahun 2019 hingga 2022, Benson menemukan bahwa suku bunga pendanaan memiliki dampak signifikan pada perdagangan. Ketika bunga terbuka kontrak tinggi dan suku bunga pendanaan ekstrem, pasar dapat berbalik arah. Benson memperoleh laba di pasar bullish dengan beroperasi melawan sentimen pasar.
Namun, pada tahun 2022, Federal Reserve mulai menaikkan suku bunga. Benson percaya bahwa suku bunga Federal Reserve seperti kekuatan penstabil, yang memengaruhi seluruh pasar keuangan dan menentukan cara menentukan harga aset berisiko. Bitcoin tidak pernah mengalami kenaikan suku bunga yang begitu cepat dalam siklus pertumbuhannya, yang telah memengaruhi sensitivitas suku bunga pendanaan dalam lingkaran mata uang dan menyebabkan sistem perdagangan asli Benson gagal. Sejak saat itu, Benson mulai mempelajari data buku pesanan dan mengembangkan indikator CoinKarma untuk menemukan posisi perdagangan yang lebih aman.
1) Tentang pasar
Data apa yang harus digunakan untuk memandu perdagangan di pasar satu arah dan volatil?
Siklus dapat dibagi secara sederhana menjadi pasar satu arah dan pasar berosilasi:
Pasar sepihak: Pasar sepihak yang naik atau turun dengan cepat biasanya berlangsung dalam waktu singkat. Ambil contoh tahun ini. Pasar yang berlangsung selama lebih dari sebulan dari akhir Januari hingga pertengahan Maret adalah pasar sepihak. Saat itu, terlihat bahwa intensitas pembelian pasar di bursa utama dengan volume perdagangan spot yang besar sangat kuat, dan arus masuk dana bersih ke ETF BTC juga sangat berlebihan.
Pasar yang berosilasi: Setelah berakhirnya pasar satu sisi, pasar biasanya memasuki suatu kisaran, dan harga mata uang berfluktuasi secara luas dalam kisaran ini. Pasar yang berosilasi menempati sebagian besar waktu di seluruh pasar. Misalnya, dalam enam bulan terakhir, Bitcoin telah mengalami berbagai fluktuasi, dengan titik terendah sekitar 50.000 atau 60.000 dan titik tertinggi sekitar 70.000.
Pasar yang satu sisi relatif jarang terjadi, sedangkan pasar yang bergejolak lebih umum terjadi. Saat menilai pasar, Anda dapat menilai apakah itu pasar satu sisi atau pasar yang bergejolak dengan mengamati indikator seperti CVD (Volume Perdagangan Kumulatif) bursa dan netinflow dari ETF BTC.
CoinKarma adalah situs web data yang dikembangkan oleh Benson. Situs ini memperoleh data buku pesanan dengan mengakses API waktu nyata dari bursa utama dengan volume perdagangan spot yang besar, dan mengubah data ini menjadi indikator melalui beberapa algoritma untuk membantu pedagang menilai kondisi pasar.
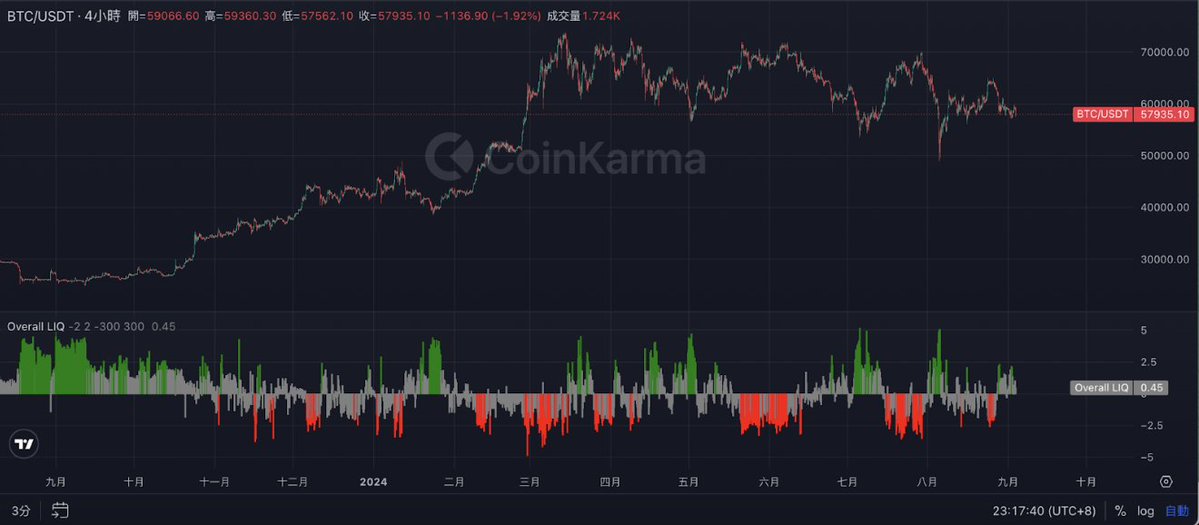
LIQ (Status Likuiditas Keseluruhan) secara keseluruhan merupakan indikator penting dalam CoinKarma. Prinsipnya adalah menentukan titik pembalikan harga yang memungkinkan dengan menggambarkan status likuiditas pasar. Secara khusus, CoinKarma memperoleh data buku pesanan dengan mengakses API bursa secara real-time, lalu menyusun data ini menjadi basis data untuk menggambarkan status likuiditas pasar saat ini. Ketika harga mendekati batas atas atau bawah kisaran yang ditentukan oleh LIQ Keseluruhan, pasar kemungkinan akan berbalik arah. Dalam pasar yang bergejolak, indikator ini membantu pedagang menemukan posisi dengan margin keamanan yang lebih tinggi. Misalnya, dalam berbagai fluktuasi Bitcoin dalam enam bulan terakhir, indikator LIQ Keseluruhan pada dasarnya dapat secara akurat mencerminkan puncak dan dasar lokal.

CVD (Cumulative Trading Volume) adalah indikator lain yang digunakan di CoinKarma untuk menilai situasi pasar. Indikator ini menilai apakah pasar bersifat fluktuatif atau unilateral dengan mengamati kekuatan order pasar. Ketika buku order berada di bawah tekanan jual yang besar, CVD tidak kuat, dan order pasar tidak kuat, kemungkinan penurunan lebih tinggi, dan pasar dapat dinilai berada dalam pasar yang fluktuatif; sebaliknya, ketika CVD kuat dan order pasar kuat, pasar unilateral dapat terjadi. Untuk deskripsi yang lebih rinci tentang kedua indikator ini, silakan lihat tweet Benson: https://x.com/BensonTWN/status/1829126733330821181
Bagaimana cara menentukan siklus melalui data?
Titik tertinggi pasar biasanya ditandai dengan fakta bahwa banyak orang luar mulai memperhatikan bidang tersebut. Misalnya, puncak NFT terjadi pada kuartal pertama tahun 2023, ketika banyak proyek Web2 dan Web3 dikaitkan dengan NFT. Pada putaran terakhir pasar bull, Coinbase APP berada di peringkat tiga teratas di antara APP keuangan Amerika Utara untuk waktu yang lama, tetapi peringkatnya belum mencapai level ini saat ini. Jumlah tampilan halaman Bitcoin di Wikipedia dapat menentukan apakah ada tanda-tanda masuknya investor ritel dalam skala besar.
Jika Bitcoin ingin menembus rekor tertingginya, atau jika suatu aset ingin menembus rekor tertinggi sebelumnya, harus ada modal eksternal yang terlibat, yang sulit dicapai hanya dengan dana di tempat. Misalnya, tahun ini, Bitcoin naik dari akhir Januari hingga pertengahan Maret, membentuk pasar sepihak, karena diamati bahwa kekuatan pembelian pasar dari bursa utama dengan volume perdagangan spot yang besar (seperti Coinbase, Binance dan Bitfinex, dll.) sangat kuat, dan arus masuk bersih dana ETF BTC juga sangat dibesar-besarkan.
2) Tentang altcoin
Mengapa Anda optimis terhadap SOL?
Perspektif teknis: Dalam kripto pasar, sebagian besar rantai publik dengan kapitalisasi pasar besar dan sejumlah besar pengguna kompatibel dengan EVM, tetapi Solana berbeda. Solana ditulis dalam bahasa Rust. Ini berarti bahwa pengembangan aplikasi di Solana mengharuskan pengembang untuk mempelajari bahasa dari awal. Dalam hal kemurnian aplikasi dan tingkat pengembang, Solana jauh lebih tinggi daripada rantai lainnya.
Nilai komunitas telah memenangkan dukungan dari pengembang inti: Solana telah mengalami keruntuhan FTX dan rencana Komite Kreditur FTX untuk menjual koin, tetapi di masa-masa yang paling sulit, ia menerima dukungan vokal dari taipan Ethereum Vitalik dan pendiri MakerDAO Christensen, serta dukungan dari ekosistem eksternal, yang menunjukkan kohesi komunitas yang kuat dan kemampuan anti-kerapuhan.
Dari perspektif kemampuan untuk bangkit dari abu harga pasangan BTC: Setelah melalui banyak kesulitan, tren Solana masih mampu mengimbangi pasar. Ini adalah salah satu dari sedikit Altcoin yang belum memasuki tren penurunan jangka panjang dalam pasangan perdagangan BTC sejak pasar bull terakhir. Dari perspektif tren harga, fundamental, dan kelahiran kembali siklus, Benson percaya bahwa jika Anda ingin memilih target yang dapat menembus titik tertinggi pasar bull terakhir, Solana memiliki peluang lebih tinggi. Solana adalah target yang berpotensi menembus titik tertinggi sebelumnya dari siklus sebelumnya.
1) Pemikiran seperti apa yang dibutuhkan untuk perdagangan dengan keuntungan tinggi?
Benson percaya bahwa kekuatan utama melikuidasi dengan menciptakan fluktuasi harga, mengejar keuntungan maksimum dengan biaya minimum. Hanya ketika investor memahami sumber fluktuasi pasar, badan utama fluktuasi, yaitu, kekuatan utama pasar, dan biaya serta potensi manfaat dari fluktuasi tersebut, mereka dapat lebih memahami operasi pasar dan merumuskan strategi perdagangan yang tepat. Setelah memiliki pemahaman dasar tentang pasar, mereka dapat mengembangkan strategi perdagangan mereka sendiri untuk menang di pasar.
Untuk membangun pola pikir yang tepat, Anda perlu menyadari bahwa sebagian besar orang di pasar menggunakan analisis teknis untuk berdagang, jadi Anda perlu memiliki perspektif yang berbeda atau fokus pada hal yang berbeda. Misalnya, saat menggunakan alat analisis teknis, Anda perlu mempertimbangkan refleksivitas perdagangan, memikirkan apa yang akan dilakukan banyak orang saat mereka melihat pola yang sama, lalu mengambil keputusan yang berbeda.
Efektivitas suatu indikator akan berubah. Terkadang bermanfaat, dan terkadang tidak berguna, yang berarti bahwa efektivitas indikator ini menurun, dan perlu untuk menemukan alpha deterministik baru untuk beradaptasi dengan perubahan pasar.
2) Bagaimana rutinitas perdagangan harian?
Di pagi hari, saya pertama-tama melihat gambaran likuiditas pasar. Melalui likuiditas mata uang utama dan pasar secara keseluruhan yang dirilis setiap jam di saluran Telegram, saya menilai apakah saya perlu mengambil tindakan dan hanya melakukan intervensi di pasar ketika pembalikan lebih mungkin terjadi. Berdasarkan kepastian peluang, saya memutuskan apakah akan beroperasi dengan posisi net long, net short, atau hanya melakukan lindung nilai pada posisi spot dengan leverage long, leverage short.
Periksa apakah altcoin yang dimiliki saat ini memenuhi harapan dan apakah alasan untuk terus menyimpannya masih ada. Jika harapan telah terpenuhi atau alasan untuk menyimpannya sudah tidak ada lagi, pilih untuk menjual.
3) Bagaimana cara menghindari kerugian besar dalam perdagangan?
Hindari membeli token dengan cara yang sama seperti membeli saham: Berinvestasilah pada beberapa proyek tipe alat dengan rasio PE yang tampaknya wajar, tetapi karena perubahan cepat dalam lingkaran mata uang kripto, proyek-proyek ini dapat runtuh saat titik panas memudar. Benson percaya bahwa saat berinvestasi, lebih banyak penekanan harus diberikan pada proyek-proyek yang memiliki keindahan dan imajinasi yang samar tetapi belum sepenuhnya diimplementasikan, daripada proyek tipe alat murni. Pada saat yang sama, perhatian harus diberikan pada apakah permintaan untuk proyek tersebut merupakan permintaan jangka panjang terakhir dan tidak akan berfluktuasi secara besar-besaran dengan perubahan dalam siklus.
Jual tepat waktu: Ketika suatu proyek telah mencapai harapan atau alasan untuk menahannya tidak ada lagi, proyek tersebut harus dijual tepat waktu.
Kendalikan leverage: Leverage umumnya tinggi di dunia mata uang kripto, tetapi volatilitas dunia mata uang kripto besar, dan penggunaan leverage yang tinggi dapat dengan mudah menyebabkan dipanen oleh kekuatan utama.
Klub Sepak Bola
Kami telah mengundang Benson ke acara Dialog dengan Pedagang hari ini. Sebelumnya, ketika kami membahas apakah ada pedagang yang bagus untuk direkomendasikan, seseorang menyebutkan Anda. Saya juga meninjau riwayat dan proses perdagangan Anda setelahnya. Sekarang pemahaman saya adalah bahwa Anda terutama menggunakan sistem perdagangan berbasis data dan telah memproduksi data ini, seperti indikator COINKARMA yang Anda buat. Hari ini kita akan berbicara tentang kisah dan pengalaman Anda seputar strategi perdagangan dan data ini.
Kita akan membahasnya dalam beberapa bagian. Pertama, mari kita bahas tentang latar belakang pribadi dan perdagangan Anda, dan mengapa Anda membentuk strategi Anda. Kemudian, kita akan menganalisis strategi perdagangan Anda secara mendalam sehingga setiap orang dapat lebih memahami metode operasi Anda. Terakhir, kita akan membahas tentang pengalaman pertumbuhan pribadi dan proses iterasi diri Anda. Bisakah Anda memperkenalkan diri secara singkat?
Bahasa Indonesia: Benson
Oke, terima kasih FC atas perkenalannya. Selamat datang di Twitter Space kami hari ini, saya Benson.
Saya mulai berdagang di dunia mata uang kripto secara penuh pada tahun 2019, dan sekarang sudah lebih dari lima tahun. Awalnya, seperti orang lain, saya tidak memiliki terlalu banyak ide sendiri selama proses perdagangan, sering mengejar naik turun, dan sering menghentikan kerugian. Setelah sekitar tiga bulan berdagang, saya secara bertahap menyadari beberapa kebenaran. Yang membuat saya terkesan adalah bahwa dalam satu setengah bulan pertama, saya kehilangan 8.000 dolar AS, dan kerugian maksimum mencapai 50.000 dolar AS. Jadi pengalaman berdagang tidak bagus di awal. Kemudian saya menyadari bahwa sebenarnya ada kekuatan utama di balik pasar dalam dunia mata uang kripto. Mereka mengendalikan dan menaikkan harga melalui pasar spot, dan kemudian memanen daun bawang di pasar kontrak. Saya menyadari hal ini setelah kehilangan sekitar 50.000 dolar AS.
Kemudian saya mulai berpikir, jika dalam jangka panjang, pemain utama di pasar selalu mereka yang menghasilkan uang, mereka menciptakan fluktuasi dan menyerang area-area dengan likuiditas yang lemah dan stop loss yang mudah, maka apakah ada cara bagi saya untuk mengikuti pemain utama untuk beroperasi? Antara tahun 2019 dan 2022, ada periode waktu ketika tingkat pendanaan sangat menguntungkan. Bagi mereka yang mulai memainkan kontrak lebih awal, seperti saya, yang memperhatikan data, mereka seharusnya dapat merasakannya dengan jelas. Selama kepemilikan kontrak di Binance, BitMEX dan beberapa bursa utama lainnya mencapai level tertentu, jika tingkat pendanaan menunjukkan nilai yang ekstrem, seperti sangat tinggi atau sangat rendah, sangat mungkin memicu pembalikan pasar.
Kemudian saya menemukan bahwa ketika kepemilikan kontrak tinggi dan tingkat pendanaan juga tinggi, itu berarti lebih banyak orang yang agresif dalam posisi long, yang akan mendorong harga kontrak dan menciptakan premi dengan spot. Saat itu, saya pikir strategi ini sangat sederhana dan efektif. Jadi saya mulai mengamati tingkat pendanaan bursa utama dan pada dasarnya beroperasi melawan sentimen pasar. Dengan menggunakan metode ini, saya menghasilkan banyak uang di pasar bull dari tahun 2020 hingga 2021.
Saat itu, saya berpartisipasi dalam kompetisi perdagangan FTX, dan saya juga mendapat akses ke operasi waktu nyata FTX di dunia nyata. mata uang kripto pasar. Saat itu, saya naik dari 400.000 dolar AS menjadi lebih dari 6 juta dolar AS, dan tertinggi mencapai posisi ke-18 dalam peringkat kontrak PNL. Jika saya ingat dengan benar, ini adalah proses perdagangan saya. Saya kehilangan banyak uang terlebih dahulu, lalu saya mulai berpikir tentang sifat pasar ini, dan akhirnya menemukan bahwa mereka yang menciptakan fluktuasi sebenarnya adalah mereka yang memanen likuiditas. Untuk memahami bagaimana orang-orang ini beroperasi, Anda harus melihat data kontrak.
Namun, strategi ini mulai gagal setelah tahun 2022. Alasan kegagalannya adalah karena Federal Reserve mulai menaikkan suku bunga pada saat itu. Konsep suku bunga pendanaan pada dasarnya adalah biaya dana yang perlu Anda bayarkan saat Anda membeli atau menjual kontrak, jadi ini juga merupakan konsep suku bunga.
Jika suku bunga Fed memengaruhi seluruh pasar keuangan, maka suku bunga tersebut menentukan bagaimana aset berisiko dihargakan. Suku bunga Fed seperti kekuatan penstabil. Sebelum kelahiran Bitcoin hingga tahun 2022, kekuatan penstabil ini berada dalam kondisi yang sangat rendah.
Namun setelah tahun 2022, Bitcoin mengalami kenaikan suku bunga yang sangat tajam dan belum pernah terjadi sebelumnya. Karena Bitcoin merupakan aset yang relatif baru, Bitcoin belum pernah mengalami kenaikan suku bunga yang begitu cepat oleh Federal Reserve selama siklus pertumbuhannya. Rekor kenaikan suku bunga pada tahun 2022 merupakan yang tercepat dalam 30 tahun terakhir, dan kenaikan suku bunga yang begitu cepat juga memengaruhi sensitivitas suku bunga pendanaan dalam lingkaran mata uang. Jadi pada saat itu, saya terus mencoba untuk melakukan long pada paruh pertama tahun 2022. Meskipun saya tahu bahwa saya mungkin telah memasuki pasar yang melemah, saya tetap ingin mencoba untuk bangkit kembali. Ternyata sistem perdagangan yang berhasil sebelumnya telah gagal, dan ditambah dengan berbagai peristiwa seperti ledakan Luna pada saat itu, saya memutuskan untuk berhenti sementara pada bulan Maret dan April 2022, karena taktik saya untuk sementara tidak berguna, jadi saya memilih untuk beristirahat sejenak. Ini adalah kisah dari masa lalu. Kemudian, saya mulai mempelajari beberapa hal baru dan menemukan petunjuk baru dari data buku pesanan. Saya pergi ke bursa utama untuk mencatat data buku pesanan mereka, dan menilai beberapa petunjuk melalui data dan tren harga ini.
Kemudian saya membuat sistem aliran pesanan ini menjadi situs web data yang disebut CoinKarma. Saya rasa saya dapat menjelaskan lebih lanjut tentang CoinKarma nanti, karena ada banyak konten di bagian ini. Ini adalah evolusi gaya perdagangan saya. Awalnya, saya seperti orang lain, tetapi kemudian saya menemukan bahwa saya harus memperhatikan data kontrak, karena fluktuasi pasar pada dasarnya diciptakan oleh pemain utama, yang mengambil likuiditas dengan menyebabkan rekanan meledakkan posisi mereka. Kemudian, saya menemukan bahwa pembuat pasar sebenarnya memiliki kisaran harga saat mereka menciptakan momentum. Jika Anda dapat menemukan batas atas atau bawah relatif dari kisaran harga ini, mudah untuk menemukan peluang pembalikan di pasar yang bergejolak.
Saya menemukan wawasan ini saat mengerjakan buku pesanan CoinKarma. Riset ini resmi dikomersialkan pada bulan Mei, dan sekarang ada sekitar 2.000 hingga 3.000 orang yang menggunakan produk ini. Saat ini, mereka yang membayar untuk menggunakannya menganggap produk ini sangat bagus. Produk ini dapat membantu mereka mempertahankan keyakinan mereka saat pasar panik, dan mengingatkan mereka untuk tidak menjadi gila saat pasar terlalu panas dan semua orang ingin pergi ke bulan. Sistem kami benar-benar dapat membantu semua orang melakukan ini. Oke, saya akan berhenti di sini dan melihat apakah ada masalah dengan FC.
Klub Sepak Bola
Oke, kalau begitu saya ingin bertanya, jika Anda menggunakan satu kalimat untuk meringkas gaya trading Anda saat ini, bagaimana Anda akan menggambarkannya? Termasuk pandangan Anda pada setiap siklus, seperti berapa lama siklus trading Anda, berapa keuntungan yang diharapkan setiap kali, dan bagaimana Anda melakukan pengendalian risiko, dapatkah Anda memberikan pengantar singkat?
Bahasa Indonesia: Benson
Oke, tidak masalah. Faktanya, lebih dari separuh posisi saya saat ini diberikan untuk kuantitatif. Karena saya mulai berhubungan dengan antarmuka API bursa tahun lalu, dan kemudian mulai melakukan perdagangan kuantitatif dari buku pesanan. Sekarang saya sedikit lebih tua, berusia tiga puluhan, dan sepertinya saya tidak akan begadang setiap hari untuk mengamati pasar. Jadi separuh dari posisi saya saat ini ada di bagian kuantitatif, terutama untuk apresiasi berbasis mata uang. Selama saya menilai bahwa siklus saat ini masih meningkat, saya akan mencoba menimbun dan menyimpan koin sebanyak mungkin. Untuk sisa 40% dari posisi, saya terutama akan menggunakan stablecoin untuk memainkan permainan gerilya, berpartisipasi dalam beberapa peluang perdagangan on-chain, atau melakukan beberapa transaksi kontrak orde pertama. Jadi alokasi posisi saya kira-kira 60% untuk apresiasi berbasis mata uang kuantitatif. 40% lainnya digunakan untuk permainan gerilya, karena keuntungan saya lebih pada perdagangan terpusat, dan perdagangan on-chain pada dasarnya dimainkan dengan teman-teman, yang sebenarnya tidak begitu saya kuasai. Jadi, operasi saya pada dasarnya didasarkan pada pasar yang besar, dan saya jarang memainkan mata uang kecil dengan kapitalisasi pasar yang lebih kecil. Kurva keuntungan saya bukanlah jenis pertumbuhan yang sangat eksplosif. Misalnya, pada pasar bullish terakhir, saya menghasilkan 400.000 yuan menjadi 6 juta yuan, yang berarti 15 kali lipat dalam waktu sekitar satu setengah tahun. Namun, pasar sangat bullish selama periode itu, dan saya tidak berpikir keuntungan saya sangat eksplosif, hanya saja mereka mengalahkan pasar. Jadi, saya bukanlah tipe pedagang yang dapat menghasilkan seribu atau seratus kali lipat, tetapi tipe yang dapat mengalahkan pasar. Kinerja saya tahun ini sekitar 2 hingga 3 kali lipat, karena operasi saya terutama didasarkan pada pasar.
Klub Sepak Bola
Pada siklus terakhir, titik awal Anda adalah sekitar $400.000, bukan? Siklus ini mungkin lebih besar lagi. Berapa laba yang Anda harapkan untuk siklus ini? Misalnya, apakah cukup untuk mengungguli BTC, atau apakah Anda memiliki batas laba?
Bahasa Indonesia: Benson
Sebenarnya, titik awal saya di babak ini cukup rendah, karena uangnya tertahan di FTX, jadi titik awalnya mungkin tidak setinggi yang dipikirkan semua orang. Namun, saya punya tujuan, yaitu pulih ke titik tertinggi sebelumnya, dan saya pikir itu saja. Titik awalnya relatif rendah, tetapi untuk angka ini, saya hanya bisa mengatakan bahwa mungkin butuh lebih dari 15 hingga 20 kali. Sejujurnya, pasar tahun ini tidak sebagus sebelumnya. Semua orang mengatakan bahwa dari Oktober tahun lalu hingga Maret tahun ini adalah periode yang paling lancar, dan kemudian memasuki mode neraka. Pasar pada dasarnya berfluktuasi menyamping, dan tidak banyak peluang eksplosif dan pasti untuk berpartisipasi. Anda hanya dapat mencoba menemukan titik masuk yang lebih baik dalam rentang fluktuasi yang luas ini, dan melakukan long atau short. Tetapi pasar semacam ini benar-benar tidak mudah bagi orang untuk menghasilkan banyak uang. Selama periode ini, saya mencoba melakukan lindung nilai dan menguangkan pada titik tertinggi, dan kemudian mengambil spot pada titik terendah untuk mencoba mengurangi biaya penyimpanan spot saya. Saat ini, biaya kue besar saya sekitar 30.000 hingga 34.000, karena saya telah berusaha menekan biaya semaksimal mungkin, melalui lindung nilai, jual call, dan jual put.
Klub Sepak Bola
Oke, saya mengerti. Saya mengerti bahwa Anda terutama berfokus pada BTC, bukan?
Bahasa Indonesia: Benson
Kanan.
Klub Sepak Bola
Oke. Kalau begitu, saya ingin tahu tentang strategi perdagangan Anda. Anda baru saja menyebutkan bahwa Anda telah mengomersialkan data Anda. Bisakah Anda memberi tahu saya secara spesifik dua data yang paling sering Anda lihat? Bagaimana data tersebut memandu perdagangan Anda? Misalnya, kapan Anda mulai membeli dalam siklus ini, mengapa Anda membeli, dan bagaimana data tersebut memandu Anda?
Bahasa Indonesia: Benson
Nah, sebenarnya indikator yang paling sering saya lihat adalah LiQ, yang merupakan singkatan dari LIQUIDITY INDICATION. Indikator ini adalah basis data yang saya gabungkan dengan menghubungkan ke API real-time dari bursa dengan volume perdagangan spot yang besar, lalu menggambarkan status likuiditas pasar saat ini dari basis data ini. Misalnya, ketika pembuat pasar membuat pasar, mereka akan memengaruhi tindakan harga mereka berdasarkan status buku pesanan.
Mari kita ambil contoh yang paling sederhana. Misalkan Anda memiliki $500.000, dan Anda memperdagangkan koin kecil dengan nilai pasar sekitar 10 juta dolar. Baik itu kontrak berjangka atau spot, Anda dapat mencoba membuka posisi dengan leverage dua atau tiga kali lipat, sekitar satu atau dua juta dolar, lalu mencoba menempatkannya pada posisi beli atau jual. Jika Anda menempatkannya pada posisi beli, Anda akan menemukan bahwa harga spot akan segera melonjak sedikit. Fenomena ini cukup menarik. Pasar Para pembuat akan menyesuaikan arah pembuatan pasar mereka menurut status buku pesanan. Apakah Anda mengerti maksud saya? Secara khusus, semakin dekat buku pesanan, semakin besar pengaruhnya terhadap harga.
Mengetahui hal ini, Anda perlu tahu cara belajar dari buku pesanan. Meskipun data buku pesanan bersifat publik, tidak mudah untuk menyatukan informasi publik ini menjadi gambaran yang lengkap. Saya menggunakan beberapa cara teknis dan melewati banyak jebakan untuk menangkap data ini, terutama data Binance, yang sangat sulit diperoleh. Saya mengumpulkan data ini dan mengubahnya menjadi indikator melalui beberapa algoritma. Indikator ini dapat dianggap sebagai rentang harga, yang akan disesuaikan secara dinamis. Ketika harga mendekati batas atas atau bawah rentang, pasar cenderung berbalik arah. Saya menjadikan data buku pesanan menjadi indikator yang dapat mengeluarkan peringatan ketika pasar mungkin berbalik arah.
Anda dapat melihat grafik dan informasi yang relevan di tweet terbaru saya. Saya baru saja mempostingnya, yang disiapkan khusus untuk Twitter Space hari ini. Saya jarang men-tweet, Anda dapat melihatnya. Pada dasarnya, dalam enam bulan terakhir, Bitcoin telah mengalami berbagai fluktuasi, dengan titik terendah sekitar 50.000 atau 60.000 dan titik tertinggi di 70.000. Indikator yang paling sering kita lihat adalah Status LIKUIDITAS Keseluruhan. Dalam enam bulan terakhir, indikator ini pada dasarnya secara akurat mencerminkan puncak lokal dan titik terendah lokal. Meskipun terkadang mungkin menunjukkan sinyal terendah, harga akan turun lagi, tetapi secara keseluruhan, masih memberikan peluang pembelian dalam posisi yang relatif baik, yang lebih baik daripada FOMO pada titik tertinggi.
Anda dapat pergi dan melihatnya, karena ketika saya memposting beberapa tweet sebelumnya, semua orang mengatakan saya orang yang suka melihat ke belakang. Jadi kemudian saya berpikir, mengapa tidak memposting beberapa prediksi terlebih dahulu. Saya memberi tahu editor bahwa saya merasa kemungkinan penurunan pada tanggal 26 Agustus cukup tinggi, jadi mengapa tidak memposting artikel untuk mengingatkan semua orang. Hasilnya benar-benar akurat. Pada tanggal 26 Agustus, harga Bitcoin berada di sekitar 64.000. Kami baru saja memposting artikel tersebut, dan dua hari kemudian, yaitu kemarin, Bitcoin turun dari 64.000, 65.000 menjadi 57.000, yang merupakan koreksi lebih dari 10%. Saya sebenarnya kurang aktif di komunitas baru-baru ini karena saya sibuk dengan produk dan transaksi saya sendiri. Namun saat itu saya terutama ingin memberi tahu semua orang bahwa indikator ini memiliki efek memprediksi pasar. Karena banyak orang akan mengatakan bahwa saya hanya berbicara setelah kejadian, jadi saya berpikir, mengapa tidak keluar terlebih dahulu untuk mengingatkan semua orang ketika kami merasa bahwa tingkat kemenangan relatif tinggi, itu mungkin naik atau turun. Pada gambar yang baru saja saya posting, Anda dapat melihat bahwa pada angka 57.000 dan 58.000, indikator LIQ Keseluruhan menunjukkan keadaan dengan kolom vertikal, yang biasanya merupakan sinyal dasar lokal.
Namun, ini juga masalah probabilitas. Kami telah melakukan pengujian ulang dan menemukan bahwa ketika indikator LIQ Keseluruhan menunjukkan kolom hijau, probabilitas Bitcoin naik 5% terlebih dahulu dan turun 5% terlebih dahulu masing-masing adalah 7:3% dan 2:7%. Jika kami melakukan pengujian ulang dengan data dua tahun terakhir, ketika LIQ Keseluruhan adalah kolom merah, probabilitas naik 5% terlebih dahulu adalah 33%, dan probabilitas turun 5% terlebih dahulu adalah 67%. Ini sudah signifikan secara statistik. Setiap orang harus memperhitungkan bahwa Bitcoin telah naik banyak dalam satu atau dua tahun terakhir, dari lebih dari 20.000 menjadi maksimum 73.000, dan sekarang menjadi sekitar lebih dari 60.000. Jadi, jika ada indikator yang memiliki peluang 5% untuk jatuh terlebih dahulu dalam situasi ini, dan tingkat kemenangan ini setinggi 2/3, maka itu secara statistik sangat signifikan. Kami tidak membuat prediksi acak, karena dalam tiga bulan terakhir, banyak pengguna kami yang merasakan hal ini saat mereka berada di puncak lokal dan dasar lokal.
Sering kali, ketika pasar mengatakan bahwa Bitcoin akan melambung tinggi, dan semua orang mengharapkan Bitcoin Conference yang melonjak, basis pengguna kami sebenarnya sangat konservatif. Kebanyakan orang melakukan short selling atau setidaknya mempertimbangkan untuk menguangkan atau mencoba untuk tidak melakukan long leverage pada saat itu. Ketika semua orang panik, seperti pada awal Agustus atau awal Juli, kami akan memasuki pasar. Beberapa orang mungkin memasuki pasar lebih awal dan mungkin menghentikan kerugian terlebih dahulu, tetapi posisi masuk kami biasanya setelah pasar banyak terkoreksi. Karena sistem perdagangan kami membantu kami menemukan posisi masuk dengan margin keamanan yang cukup tinggi. Jika Anda membaca posting terbaru saya di Twitter, Anda benar-benar dapat melihatnya hanya dengan melihat gambarnya. Tidak perlu dijelaskan terlalu banyak. Mungkin seperti itu.
Klub Sepak Bola
Oke, ya, saya ingin mengucapkan terima kasih kepada Sky terlebih dahulu, karena Sky yang memperkenalkan kita, dialah mak comblang kita, benar? Itulah sebabnya kita berbincang hari ini. Saya lihat Sky ada di sini. Kembali ke pertanyaan yang Anda sebutkan tadi, saya memahami bahwa indikator data Anda pada dasarnya adalah untuk memahami dari sudut pandang kekuatan utama, saat ini, keuntungan naik lebih besar, atau keuntungan turun lebih besar, benarkah demikian?
Bahasa Indonesia: Benson
Ya, saya dapat menambahkannya. Faktor-faktor yang memengaruhi tren pasar kripto dapat dibagi menjadi faktor jangka panjang dan faktor jangka pendek. Faktor jangka panjang adalah untuk melihat apakah aset-aset ini, terutama aset yang dipimpin oleh Bitcoin, secara bertahap diakui oleh pasar arus utama yang lebih luas, seperti tingkat adopsinya, dan sebagai aset keuangan, apakah semakin banyak orang menganggapnya sebagai cadangan nilai, dll., yang menentukan tren jangka panjangnya. Namun dalam proses tren jangka panjang, akan ada defipasti ada benjolan, kan? Bagaimana benjolan jangka pendek ini muncul?
Pada dasarnya, kita dapat mengatakan bahwa fluktuasi jangka pendek terutama berasal dari likuidasi leverage tinggi. Yang disebut likuidasi leverage tinggi mengacu pada pembuat pasar atau pemain utama dalam lingkaran mata uang, yang sebenarnya mampu mengendalikan harga. Jika mereka ingin memaksimalkan kepentingan mereka sendiri, mereka akan menarik pasar ketika ada banyak short, atau menghancurkan pasar ketika ada banyak long. Contoh yang paling jelas adalah pasar pada tanggal 5 Maret, yang telah meningkat hingga hari itu ketika tiba-tiba turun 10.000 poin. Mengapa turun begitu banyak? Itu karena ada begitu banyak orang yang melakukan leverage long pada waktu itu. Begitu mereka menghancurkannya, sedikit sentuhan akan memicu rantai likuidasi.
Jadi dari perspektif pemain utama, Anda akan menemukan bahwa mereka melakukan satu hal: bagaimana mendapatkan pengembalian maksimum dengan biaya terendah dalam proses menarik atau menghancurkan pasar. Misalnya, jika saya ingin melikuidasi posisi long, saya hanya perlu mengeluarkan 2 juta dolar AS untuk menghancurkan pasar, dan saya mungkin menghasilkan 4 atau 5 juta dolar AS pada akhirnya, jadi saya akan melakukannya. Sebaliknya, jika saya ingin melikuidasi posisi short, saya hanya perlu mengeluarkan 2 juta dolar AS untuk menarik pasar, dan saya mungkin menghasilkan 4 atau 5 juta dolar AS di pasar kontrak, dan saya mungkin juga menghasilkan 4 atau 5 juta dolar AS di pasar berjangka atau opsi, jadi saya akan melakukannya. Sistem kami, yaitu, indikator LIQ ini, yang dilakukannya adalah mencari tahu biaya yang perlu dikeluarkan pemain utama ketika mereka ingin menarik atau menghancurkan pasar. Jika biaya ini sangat besar, pemain utama dapat mempertimbangkan apakah mereka benar-benar ingin melakukannya. Karena jika mereka menghabiskan 20 juta dolar AS untuk menghancurkan pasar, keuntungan akhirnya tidak pasti, dan mereka mungkin hanya mendapatkan kembali 5 juta dolar AS atau 10 juta dolar AS pada akhirnya, maka mereka mungkin tidak mengambil tindakan. Apakah Anda mengerti maksud saya?
Bahasa Indonesia: Benson
Jadi mengapa saya katakan bahwa peran indikator Likuiditas Keseluruhan adalah untuk melihat di mana batas atas pasar yang memungkinkan. Batas atas ini akan disesuaikan dari waktu ke waktu. Ini bukan garis tetap, tetapi kita dapat mengidentifikasi posisi yang memungkinkan. Dalam berbagai fluktuasi dalam enam bulan terakhir, pada dasarnya selama Bitcoin mendekati 70.000, biaya untuk menaikkannya akan sangat tinggi, karena tekanan jual pada 70.000 sangat berat, dan posisi short yang dapat dilikuidasi terbatas. Pada saat ini, kekuatan utama mungkin memilih untuk menyerah menarik pasar dan beralih ke menghancurkan pasar, karena dengan cara ini mereka dapat meraih lebih banyak likuiditas. Jadi sistem kita adalah memiliki pola pikir ini terlebih dahulu, dan kemudian membuat indikator ini. Karena fluktuasi jangka pendek di pasar terbentuk dengan cara ini, kita mencoba menemukan garis ketika sejumlah besar chip dibutuhkan untuk menarik atau menghancurkan pasar. Setelah garis ini ditemukan, kita dapat mengetahui bahwa harga kemungkinan akan berbalik pada posisi ini. Ini adalah teori dan logika kita di baliknya. Setidaknya dalam enam bulan terakhir, fitur ini masih sangat berguna, dan lokal atas dan lokal bawah dapat diidentifikasi.
Klub Sepak Bola
Oke, saya paham bahwa seharusnya ada dua skenario aplikasi, benar? Yang pertama, saya sedang memikirkan kapan saya akan menggunakan indikator ini. Misalnya, beberapa waktu lalu, salah satu LP saya bertanya kepada saya, haruskah saya membeli Bitcoin saat harganya turun dari 78.000 menjadi 60.000? Saya pikir indikator saat ini sebenarnya dapat menentukan apakah harganya berada di titik terendah relatif atau titik tertinggi relatif di pasar yang bergejolak, atau di pasar yang sedang dalam rentang. Ini adalah salah satu skenario. Skenario kedua mungkin selama seluruh rentang yang bergejolak, saat tidak ada pasar unilateral, indikator ini dapat digunakan untuk melakukan operasi kotak, benar? Saya paham bahwa ini terutama adalah dua skenario ini, yang dapat memberi tahu Anda apakah ini adalah titik tertinggi relatif atau titik terendah relatif. Apakah saya paham dengan benar?
Bahasa Indonesia: Benson
Padahal, jika kita mengklasifikasikan keseluruhan siklus, pada dasarnya dapat dibagi menjadi pasar satu sisi dan pasar yang berosilasi. Dengan asumsi bahwa kita membaginya secara kasar ke dalam dua kategori ini, durasi pasar satu sisi sebenarnya sangat singkat. Biasanya pasar satu sisi bergerak cepat, lalu memasuki suatu rentang, dan berosilasi secara luas dalam rentang ini. Jadi, dapat dikatakan bahwa proporsi pasar satu sisi di seluruh pasar sangat kecil, dan sebagian besar waktu berada dalam osilasi yang luas.
Dalam dunia mata uang kripto, pasar unilateral tidak ditentukan oleh pemain utama di dunia mata uang kripto. Pasar unilateral membutuhkan aliran masuk dana eksternal yang berkelanjutan atau aliran keluar dana internal yang berkelanjutan untuk menyebabkan kenaikan atau penurunan unilateral. Faktor-faktor tersebut biasanya hanya berlangsung dalam jangka waktu yang singkat dalam setiap siklus, mungkin satu hingga dua bulan, lalu memasuki suatu rentang, lalu berosilasi dalam jangka waktu yang lama dalam rentang ini hingga arah selanjutnya diputuskan. Oleh karena itu, produk yang kami sediakan adalah untuk membantu Anda menemukan posisi dengan margin keamanan yang lebih tinggi di sebagian besar kondisi pasar, terutama di pasar yang bergejolak, untuk berpartisipasi dalam pasar.
Adapun cara mengidentifikasi pasar yang berat sebelah, kami juga memiliki metode. Kami mengamati CVD bursa, yaitu Volume Perdagangan Kumulatif. CVD dinilai dengan mengamati kekuatan order pasar. Jika buku order sangat tebal, misalnya, order jual sangat tebal, Anda memerlukan banyak order pasar untuk mengalahkan order jual ini. Kami menjadikan kekuatan beli pasar sebagai indikator. Jadi pada akhir Juli dan awal Juni tahun ini, kami mengamati fenomena bahwa kekuatan CVD tidak tinggi saat itu, kekuatan order pasar tidak kuat, dan tekanan jual dari atas sangat kuat. Dalam hal ini, kemungkinan jatuh akan lebih tinggi, yang berarti bahwa kita masih berada di pasar yang bergejolak, belum akan memasuki pasar yang berat sebelah. Oleh karena itu, kami menyediakan sistem perdagangan yang sangat berguna di pasar yang bergejolak, tetapi kami juga memiliki indikator lain untuk membantu Anda menilai apakah itu pasar yang bergejolak atau pasar yang berat sebelah. Inilah yang sedang kami lakukan.
Klub Sepak Bola
Baik, jadi saya ingin tahu apakah Anda dapat membicarakannya? Misalnya, 70.000 yang Anda sebutkan tadi, saya pikir tekanan jualnya sangat tinggi, bukan? Dari sudut pandang pedagang jangka panjang, bagaimana saya dapat menilai indikator mana yang dapat digunakan untuk menentukan apakah 70.000 mungkin ditembus kali ini? Tentu saja, dari perspektif eksternal, mungkin ada beberapa perubahan dalam faktor makro, seperti kenaikan suku bunga, pemotongan suku bunga, atau faktor positif lainnya. Kemudian dalam indikator Anda, dapatkah Anda melihat bahwa kali ini benar-benar dapat menembus level tertinggi sebelumnya dan mengembangkan tren baru? Ini juga yang lebih dikhawatirkan semua orang, karena semua orang telah berfluktuasi, bukan? Beberapa waktu lalu, hampir 76.000 dan kemudian turun lagi, bukan? Kapan ini akan berakhir? Bagaimana Anda melihat ini?
Bahasa Indonesia: Benson
Ya, biar saya jelaskan begini. Pada dasarnya, jika Anda ingin menembus resistance yang sangat kuat, mustahil untuk menariknya naik hanya dengan dana internal. Jadi kita akan melihat status dana eksternal. Mengambil contoh tahun ini, pasar unilateral yang paling jelas adalah dari akhir Januari hingga pertengahan Maret, yang berlangsung selama lebih dari sebulan. Selama waktu itu, kami mengamati bursa utama dengan volume perdagangan spot yang besar, seperti Coinbase, Binance, dan Bitfinex. Kekuatan pembelian pasar dari bursa-bursa dominan ini sangat kuat. Termasuk arus masuk BTC ETF, arus masuk dana bersih juga sangat dilebih-lebihkan. Hanya dalam kasus ini, dana eksternal terus mengalir masuk dan memengaruhi pasar, tekanan jual atas dapat dipatahkan dan pasar unilateral terbentuk. Jadi singkatnya, jika Anda ingin menilai apakah kali ini akan menembus atau terus berfluktuasi, pada dasarnya lihat arus masuk BTC dan CVD dari bursa yang baru saja saya sebutkan.
Dalam sistem perdagangan kami, jika LIQ Keseluruhan saat ini sangat merah, itu berarti tekanan jual dari atas sangat berat, dan kekuatan utama atau pembuat pasar menghadapi perlawanan besar ketika menariknya ke atas, tetapi tidak ada cukup dana eksternal untuk mendorongnya ke atas, seperti arus masuk ETF tidak kuat, dan kekuatan pesanan pasar CVD tidak kuat. Kami akan lebih yakin bahwa posisi ini mungkin memiliki kemungkinan lebih tinggi untuk jatuh kembali, dan tidak akan menembus secara langsung. Ini adalah indikator yang kami perhatikan ketika melihat pasar. Tentu saja, setiap orang mungkin melihat indikator yang berbeda, dan cara menilai unilateral atau berosilasi juga berbeda, tetapi ini adalah cara kami.
Klub Sepak Bola
Oke, saya mengerti. Saya ingin tahu pertanyaan berikutnya, tentang beberapa altcoin. Misalnya, saya juga melihat bahwa Anda memiliki beberapa pendapat tentang
Sol. Bagaimana kalau kita bicarakan ini terlebih dahulu. Menurut Anda, apa logika di balik terobosan Sols terhadap level tertinggi sebelumnya? Silakan bagikan pendapat Anda.
Bahasa Indonesia: Benson
Nah, mengenai Sol, saya rasa kita bisa mulai dengan hal-hal mendasar. Kita bisa melihat bahwa rantai publik dengan kapitalisasi pasar yang relatif besar dan lebih banyak orang yang bermain di pasar kripto pada dasarnya memiliki satu karakteristik, yaitu, mereka kompatibel dengan EVM, bukan? Artinya, selama Anda dapat menulis Solidity, Anda dapat dengan cepat menerapkan DApp pada rantai yang kompatibel dengan EVM ini. Sebaliknya, Solana berbeda, ia ditulis dalam Rust. Jika Anda menggunakan analogi yang lebih sederhana untuk menjelaskannya, rantai lain mungkin hanya perlu menulis Solidity, dan Anda dapat dengan cepat mentransplantasikan DApp ke dalamnya.
Jadi, jika Anda benar-benar ingin membangun ekosistem di Solana, sebenarnya ada sedikit kekurangan. Yaitu, jika saya curang, saya dapat dengan cepat menyelesaikannya. Namun, di Solana, sebagai insinyur kontrak pintar, Anda mungkin harus mempelajari bahasa dari awal dan kemudian mengembangkan aplikasi di dalamnya. Jadi dalam hal kemurnian aplikasi, atau tingkat pengembang, saya pikir Solana jelas lebih tinggi daripada rantai lainnya. Ini adalah salah satu alasan mengapa saya optimis tentang Solana. Keduanya adalah TTVL, yang mungkin dua miliar atau tiga miliar. Mereka mungkin juga memiliki dex, swap, dan exchange untuk directivederivatives. Jadi mana yang dapat disalin secara langsung, dan mana yang mungkin perlu dikembangkan perlahan dari awal. Terutama di siklus terakhir, selain hubungan dengan FTX, ini adalah salah satu alasan mengapa saya optimis tentang Solana.
Alasan kedua adalah logika ini masih ada hingga saat ini. Sebagian besar rantai masih menganggap kompatibilitas EVM sebagai fitur penting. Dari perspektif siklus, jika sebuah koin dapat menjadi aset jangka panjang dan ada alasan bagi orang untuk bersedia menyimpannya dalam waktu lama, koin tersebut harus memiliki satu syarat, yaitu kemampuan untuk terlahir kembali dari abu dan menunjukkan sifat antikerapuhannya. Yang disebut sifat antikerapuhan adalah ia memiliki kemampuan untuk kembali ke garis depan dalam keadaan yang sangat tidak menguntungkan. Saya pikir di antara semua koin, hanya sedikit yang memiliki kemampuan ini. Bitcoin tentu saja salah satunya. Setelah lebih dari sepuluh tahun, ia telah dipandang rendah oleh media arus utama berkali-kali. Ethereum juga salah satunya, karena hampir runtuh setelah ICO, tetapi akhirnya bangkit kembali. Lalu ada BNB, yang telah mengalami insiden 94, penangkapan CZ, dan peristiwa lainnya, dan masih hidup dan sehat, dan trennya tidak terlalu buruk.
Lalu ada Solana. Solana mengalami ledakan FTX dan kekacauan saat komite kreditor FTX berniat menjual koin. Saat Solana berada di titik terendah, bukan orang-orang di dalam Solana yang mendukungnya, melainkan Vitalik, bos besar Ethereum. Ia mengatakan bahwa jika ETH menang karena kegagalan Solana, ia akan merasa sangat menyesal. Hal ini dikatakan oleh Vitalik sendiri. Saat itu, makerDAO juga mempertimbangkan untuk beralih ke rantai lain, dan Solana adalah salah satu opsi yang mereka pertimbangkan. Jadi saat Solana berada di titik terendah, ekosistem eksternallah yang mendukung rantai ini dan memberi semua orang rasa percaya diri.
Jadi menurut saya dari perspektif teknologi, nilai komunitas, kesulitan pengembangan, dan kemampuan untuk bangkit kembali dari abu, Solana adalah target investasi yang relatif bagus. Karena target investasi tersebut dibandingkan. Jika kita melihat tren Solana terhadap ETH atau Solana terhadap BTC, pada dasarnya ia berada dalam kondisi bangkit kembali dari abu. Sebagian besar altcoin mengalami penurunan nilai tukar terhadap BTC. Banyak koin yang sedang booming pada siklus terakhir, tetapi kali ini mereka tidak dapat mengikuti pasar, tetapi Solana dapat mengikutinya. Jadi dari perspektif Price Action, dari perspektif fundamental, dan dari kemampuan untuk bangkit kembali dari abu secara berkala, menurut saya Solana adalah target yang berpotensi untuk menembus titik tertinggi sebelumnya pada siklus sebelumnya, setidaknya bagi saya.
Klub Sepak Bola
Begitu ya. Lalu, bisakah Anda jelaskan, misalnya, bagaimana Anda menyelesaikan seluruh proses transaksi setiap hari atau dalam satu siklus? Misalnya, data apa yang Anda lihat setiap hari, dan tindakan apa yang Anda ambil berdasarkan indikator data apa? Bisakah Anda jelaskan proses ini? Karena Anda sekarang memiliki produk sendiri, bukan? Bagaimana seluruh proses transaksi diselesaikan?
Bahasa Indonesia: Benson
Kita bisa membahasnya sebentar. Oke, sebenarnya, setiap pagi, pertama-tama saya akan melihat gambaran umum likuiditas pasar terkini. Kami memiliki saluran Telegram yang menerbitkan likuiditas mata uang utama dan pasar secara keseluruhan setiap jam. Saya akan melihatnya terlebih dahulu. Pada dasarnya, saya hanya akan melakukan intervensi di pasar ketika pembalikan lebih mungkin terjadi. Ada banyak cara untuk melakukan intervensi di pasar. Jika kepastiannya relatif tinggi, Anda dapat melakukan leverage long atau leverage short. Jika kepastiannya tidak terlalu tinggi, Anda dapat memilih untuk melakukan lindung nilai spot, atau membeli beberapa put, atau melakukan beberapa operasi manajemen keuangan mata uang ganda ketika ada spot.
Jadi, hal pertama yang harus dilakukan adalah melihat profil likuiditas pasar untuk menentukan apakah saya perlu menjual. Kemudian, karena saya masih memiliki beberapa kepemilikan ocoinaltcoin, saya akan melihat apakah itu memenuhi harapan saya dan apakah alasan bagi saya untuk terus memegang masih ada. Saya mungkin akan melihatnya. Jika itu telah memenuhi harapan saya, misalnya, ada koin dalam siklus ini, dan nilai pasarnya awalnya sekitar 200, dan saya berharap itu akan berada di 30 teratas, maka saya mungkin memilih untuk menjualnya pada tahap ini. Mungkin bahkan jika itu memiliki peluang untuk masuk sepuluh besar lagi nanti, tetapi saya pikir risikonya lebih besar dan probabilitasnya lebih rendah, maka saya mungkin memilih untuk menjualnya.
Pada dasarnya, seperti ini: pertama-tama lihat likuiditas untuk menentukan apakah ada peluang untuk melakukan intervensi, lalu putuskan apakah akan melakukan net long net short atau hedge spot leverage long, leverage short berdasarkan kepastian peluang. Langkah selanjutnya adalah kepemilikan OcoinAltcoin yang ada. Jika belum mencapai ekspektasi dan alasan untuk menahan masih ada, maka teruslah menahan. Jika telah mencapai ekspektasi atau alasan untuk menahan tidak ada lagi, maka Anda dapat memilih untuk menjualnya, kira-kira seperti ini.
Klub Sepak Bola
Begitu ya. Terakhir kali Anda menjual token, menurut Anda perubahan apa saja yang terjadi? Bisakah Anda memberi tahu saya alasan Anda membeli dan menjualnya? Saya rasa ini cukup menarik. Atau variabel apa saja yang Anda perhatikan terkait token altcoin?
Bahasa Indonesia: Benson
Baiklah, saya dapat memberikan dua contoh. Salah satunya adalah FTT. Saya adalah salah satu pemegang awal FTT pada waktu itu, dan biaya rata-rata untuk membuka posisi kurang dari tiga yuan. Kemudian, ketika Coinbase terdaftar, nilai pasar perdagangan pra-pasar mencapai lebih dari 100 miliar dolar AS. Saya menghitungnya dan merasa bahwa nilai pasar ini agak meningkat, karena pencatatan Coinbase pada waktu itu menyebabkan lonjakan seluruh mata uang platform. Pada saat itu, FTT melonjak dari kurang dari 10 yuan pada awal tahun menjadi 60 yuan, dan BNB melonjak dari 30 atau 40 yuan menjadi 500 atau 600 yuan. Saya menjual sekitar 30 hingga 40 persen FTT pada 60 yuan, karena saya pikir pasti akan ada peluang untuk membelinya kembali dengan harga yang lebih rendah nanti. Pasar sudah terlalu panas pada waktu itu. Tentu saja, FTX mengalami masalah kemudian, tetapi itu cerita lain. Ini adalah contoh spot jangka panjang yang pernah saya jual.
Contoh lainnya adalah Solana. Saya membelinya dengan harga lebih dari tiga yuan, dan kemudian mengalami koreksi yang relatif besar, terkoreksi hingga lebih dari satu yuan. Saat saya membelinya, nilai pasar yang beredar sekitar 100, dan ekspektasi saya adalah jika bisa masuk 30 teratas dalam siklus ini, saya rasa itu akan bagus. Jadi saya menjual semua Solana saya sebelum 60 yuan, meskipun kemudian naik menjadi 260 yuan, yang saya jual dengan kerugian. Tetapi bahkan jika saya menjualnya dengan kerugian, saya rasa tidak ada yang bisa memprediksi bahwa itu akan masuk sepuluh besar. Saya pikir kemungkinan masuk sepuluh besar sangat rendah, jadi saya tidak berharap itu akan menarik begitu keras nanti. Kedua contoh ini masing-masing menggambarkan ekspektasi saya terhadapnya dan keputusan akhir untuk menjual.
Klub Sepak Bola
Oke, saya mengerti. Apakah ada yang perlu Anda tambahkan pada data ini?
Bahasa Indonesia: Benson
Tidak untuk saat ini.
Klub Sepak Bola
Oke, mari kita bahas tentang pengendalian risiko dan daftar hal-hal yang harus dilakukan. Operasi apa yang saat ini pasti tidak Anda lakukan? Beberapa pengalaman masa lalu membuat Anda lebih memperhatikannya sekarang, seperti ketika situasi tertentu terjadi, Anda akan memilih untuk menghentikan kerugian atau mengambil keuntungan. Ini adalah pertanyaan pertama. Pertanyaan kedua adalah, kebiasaan perdagangan apa yang telah menyebabkan Anda menderita kerugian besar di masa lalu, dan Anda pasti tidak akan melakukannya sekarang? Bisakah Anda berbagi dengan semua orang?
Bahasa Indonesia: Benson
Baiklah, pertama-tama saya akan berbicara tentang kerugian besar yang saya alami dalam trading. Karena saya sebenarnya memiliki cukup banyak pengalaman di bidang ini. Dulu, saya sering merasa bahwa selama jalurnya baik-baik saja dan tidak ada target investasi lain yang lebih baik, saya akan terus bertahan. Dari perspektif rasio PE, beberapa jalur mungkin tampak cukup masuk akal. Namun kemudian saya menemukan bahwa bagian yang paling menarik dari lingkaran mata uang adalah keindahan yang samar. Apa itu keindahan yang samar? Artinya, proyek tersebut belum sepenuhnya terlaksana. Ketika belum terlaksana, ceritanya dapat diceritakan secara besar-besaran, dan rasio PE memiliki banyak ruang untuk imajinasi. Misalnya, kita dapat mengatakan bahwa suatu proyek tertentu adalah jaringan komputasi terdesentralisasi di dunia. Lalu, dari perspektif nilai pasar, berapa banyak yang harus naik untuk menyamai posisi ini? Poin ini sulit diperkirakan, bukan?
Namun kemudian, beberapa target yang saya investasikan adalah proyek-proyek yang benar-benar berjenis alat, dan rasio PE mereka mudah dihitung, dan masuk akal jika dibandingkan dengan PE saham. Misalnya, PE beberapa saham mungkin lima atau sepuluh kali, tergantung pada industrinya. Jadi pada saat itu, saya juga berpikir bahwa jika koin tertentu memiliki PE 5 hingga 10 kali, koin itu layak dibeli. Pemikiran awal saya adalah membeli token dengan cara yang sama seperti membeli saham, karena kepemilikan utama saya saat itu adalah token dari bursa, dan rasio PE token ini relatif mudah dihitung.
Namun kemudian saya menemukan bahwa cara berpikir seperti ini tidak berlaku di dunia mata uang kripto, karena laju perubahan di dunia mata uang kripto sangat cepat. Beberapa proyek mungkin memiliki rasio PE yang wajar untuk jangka waktu tertentu, tetapi ketika titik panasnya hilang, itu mungkin benar-benar runtuh. Misalnya, OpenSea. Pada saat itu, valuasi OpenSea mencapai puncaknya di lebih dari 10 miliar dolar AS. Logika di balik valuasi ini adalah bahwa volume perdagangan OpenSea sangat tinggi pada saat itu, dan dapat menghasilkan banyak uang hanya dengan mengumpulkan biaya transaksi. Saya lupa berapa banyak PE yang mereka gunakan untuk menghitung valuasi pada saat itu, tetapi valuasi puluhan miliar dolar pada saat itu tampaknya merupakan investasi yang masuk akal. Namun, kita semua tahu bahwa pasar NFT mendingin kemudian, bukan? Jadi rasio PE yang wajar pada saat itu mungkin telah menjadi ratusan kali sekarang, yang tidak masuk akal.
Dengan pengalaman ini, saya memahami bahwa di dunia mata uang kripto, proyek dengan keindahan yang samar sebenarnya merupakan target yang lebih baik. Sebaiknya pilih proyek yang memiliki ruang untuk imajinasi tetapi belum sepenuhnya diterapkan, daripada proyek yang murni bertipe alat. Saya pikir token yang bukan bertipe alat memiliki lebih banyak ruang untuk imajinasi dan cenderung tidak memiliki masalah yang baru saja saya sebutkan.
Jadi, jika saya berinvestasi dalam koin sekarang, jika itu masih jenis alat, saya akan melihat apakah permintaannya adalah permintaan panjang terakhir, yang tidak akan berfluktuasi besar dengan perubahan siklus. Sebaliknya, proyek yang mungkin memiliki pengembalian 100 kali lipat mungkin sekarang hanya memiliki pengembalian 1%, yang tidak layak untuk diinvestasikan. Saya akan lebih fokus pada proyek dengan permintaan jangka panjang. Ini adalah salah satu kerugian terbesar yang saya derita dalam perdagangan. Ketika saya berinvestasi di beberapa jalur, saya memperlakukannya sebagai saham dan berinvestasi ketika saya pikir rasio PE wajar. Hasilnya benar-benar buruk pada akhirnya. Mungkin ketika saya akhirnya keluar, hanya 5% dari harga saat itu yang tersisa. Misalnya, 100 yuan masuk, dan saya hanya mendapat 5 yuan kembali pada akhirnya, yang pada dasarnya berarti saya kehilangan segalanya.
Klub Sepak Bola
Saya mengerti. Maksud Anda adalah ketika sebuah proyek belum laku, sentimennya masih punya banyak ruang untuk berimajinasi. Namun begitu benar-benar laku, ketika Anda menggunakan valuasi untuk mengukurnya, ruang untuk penurunannya mungkin lebih besar, bukan? Jadi, apa metode perdagangan Anda sekarang? Apakah Anda akan keluar saat Anda mencapai laba yang diharapkan, atau menurut Anda lebih baik menjual pada titik berapa?
Bahasa Indonesia: Benson
Saya pikir target yang berbeda akan memiliki pendekatan yang berbeda. Saya pikir beberapa target mungkin menjadi hot spot pasar berikutnya. Selama saya secara subjektif percaya bahwa pasar masa depan tidak akan mendingin sepenuhnya dan tidak akan memasuki awal pasar yang melemah, saya mungkin akan bertahan sampai topik ini meledak. Misalnya, saya pikir dalam putaran siklus ini, gelombang koin Meme tidak dapat dikatakan sepenuhnya berakhir, tetapi sulit untuk memicu gelombang antusiasme lain seperti sebelumnya. Selanjutnya, beberapa koin yang benar-benar memiliki fundamental yang baik dan telah diremehkan untuk waktu yang lama dapat dipilih untuk mendapatkan kembali perhatian. Misalnya, Aave baru-baru ini dipilih untuk dibahas karena trennya bagus, dan dalam proyek DeFi, pendirinya tidak menghabiskan uang secara sembarangan dan telah mengembangkannya dengan serius. Saya pikir jika ada beberapa hot spot di putaran siklus berikutnya, semuanya tidak akan terkonsentrasi pada koin Meme seperti di babak pertama. Dalam hal ini, saya tidak akan terlalu memperhatikan target harga, tetapi lebih memperhatikan apakah pasar mengikuti pandangan saya. Tentu saja, ada kemungkinan pandangan saya salah dan pasar mungkin tidak memperhatikan target ini.
Namun jika alasan saya membelinya pada awalnya adalah karena saya merasa pasar belum memperhatikan jalur ini, dan saya mengira jalur ini akan naik, maka saya akan menahannya hingga pasar memperhatikannya, atau saya merasa pasar bullish sudah berakhir dan pasar sudah benar-benar mendingin, maka saya juga akan memilih keluar.
Klub Sepak Bola
jernih.
Bahasa Indonesia: Benson
Untuk beberapa token, harga sangatlah penting, karena token tersebut mungkin memiliki sejarah yang panjang, dan saya dapat menggunakan beberapa analisis teknis atau analisis fundamental untuk menentukan secara kasar ke mana harga akan bergerak. Untuk token dengan nilai pasar yang relatif besar, saya akan membuat penilaian ini.
Klub Sepak Bola
Begitu ya. Sebenarnya saya punya pertanyaan lain tadi, tentang hubungan antara data dan siklus. Anda menyebutkan siklus, jadi bagaimana Anda menentukan tahap siklus mana yang sedang kita jalani saat ini? Misalnya, siklus saat ini sudah berjalan dua pertiga, ya kan? Apakah ada indikator data yang mendukung hal ini?
Bahasa Indonesia: Benson
Saya rasa sangat sulit untuk mengatakan tentang kemajuannya. Saya tidak memiliki kemampuan untuk menilai apakah kemajuan saat ini adalah sepertiga, dua pertiga, atau telah selesai. Namun saya merasa bahwa dari siklus sebelumnya, akan ada titik puncak siklus, dan titik puncak tersebut biasanya memiliki karakteristik, yaitu banyak orang di luar mulai memperhatikan bidang ini. Misalnya, titik tertinggi NFT sebenarnya terjadi pada kuartal pertama tahun 2023. Saat itu, semuanya benar-benar harus ditautkan ke NFT, dan semua web2 dan web3 proyek-proyek yang terlibat dalam NFT. Namun setidaknya dalam siklus ini, saya belum melihat fenomena serupa.
Baru-baru ini, banyak orang akan memperhatikan sebuah indikator, yaitu peringkat Coinbase APP, bukan? Di pasar bull sebelumnya, peringkat Coinbase APP pada dasarnya akan berada di tiga teratas untuk waktu yang lama. Misalnya, di putaran terakhir 64.000 dan 69.000, ia berada di peringkat tiga teratas di APP keuangan Amerika Utara untuk waktu yang lama. Namun kali ini, peringkat teratas hanya keempat, dan hanya bertahan selama satu hari. Jika kita melihat jumlah tampilan halaman Bitcoin di Wikipedia, tidak ada tanda-tanda masuknya leek dalam skala besar. Jadi, jika 73.000 benar-benar puncak siklus, maka karakteristik puncak ini benar-benar berbeda dari yang sebelumnya. Setidaknya dari sudut pandang pribadi saya, saya pikir masih banyak variabel apakah Q4 berikutnya dapat menetapkan tertinggi baru, atau bahkan apakah dapat menetapkan tertinggi baru di Q1 tahun depan. Salah satu variabelnya adalah arah politik Amerika Serikat. Awalnya, semua orang mengira Trump memiliki peluang besar untuk terpilih, tetapi kemudian Biden mungkin akan menarik diri dari pemilihan dan Harris Kamala Harris akan mengambil alih, jadi variabel ini relatif besar. Jadi sejujurnya, sangat sulit untuk menilai sekarang, tetapi saya pribadi cenderung optimis. Saya pikir peluang siklus ini terus naik masih relatif tinggi, setidaknya Bitcoin memiliki peluang untuk mencapai titik tertinggi baru. Namun, ini hanya bias optimis pribadi saya. Jika kita berbicara tentang verifikasi baru-baru ini, saya pikir setidaknya kita harus membuktikan bahwa 65K bukanlah titik tertinggi yang lebih rendah, bukan titik tertinggi yang lebih rendah pada level harian. Jika kita ingin menemukan titik masuk di sisi kanan nanti, setidaknya harga penutupan pada level harian harus di atas 65K atau 66K. Dan garis itu juga merupakan MA 200, yang masih merupakan garis yang sangat penting dalam situasi saat ini. Jadi secara subjektif, saya pikir ada peluang untuk menembus titik tertinggi sebelumnya nanti. Tetapi dalam operasi aktual, ketika mengambil posisi, saya akan memberi perhatian khusus pada apakah posisi 65K dapat ditembus. Jika tembus, level harian tidak akan membentuk level tertinggi yang lebih rendah, tetapi bisa jadi merupakan sinyal pembalikan, atau semacam itu.
Klub Sepak Bola
Saya rasa bagian terakhir dari sesi kita adalah sesuatu yang juga membuat saya penasaran. Anda menggunakan tingkat pendanaan untuk menilai arah pasar di awal, dan Anda juga memperoleh keuntungan yang baik saat itu. Kemudian Anda menemukan bahwa pasar telah berubah, bukan? Jadi, bagaimana Anda terus mengamati perubahan di pasar agar strategi perdagangan Anda tidak gagal? Saya ingin tahu bagaimana Anda melakukannya. Anda telah mempelajari sesuatu yang baru. Apakah Anda memiliki pedagang yang direkomendasikan, atau apa saja sumber informasi yang Anda perhatikan?
Bahasa Indonesia: Benson
Ini pertanyaan yang menarik. Menurut saya, daripada berfokus pada jenis pedagang atau data apa yang harus diamati, lebih baik memiliki pemahaman dasar tentang pasar. Misalnya, saya juga menggambar garis, mengamati pola, menganalisis moving average, dan bahkan menggunakan Fibonacci retracement di awal. Namun, kemudian saya menyadari bahwa 90% orang di pasar menggunakan analisis teknis untuk berdagang. Jadi, jika Anda juga menggunakan analisis teknis untuk berdagang, hanya ada satu cara untuk menang di pasar kontrak, yaitu, meskipun Anda menggunakan alat yang sama, pandangan Anda harus benar-benar berbeda dari orang lain. Misalnya, jika Anda juga mengamati pola puncak kepala dan bahu, Anda harus memikirkannya. Begitu banyak orang melihat puncak kepala dan bahu, apa yang mungkin mereka lakukan? Lalu, apa yang harus Anda lakukan? Anda harus memperhitungkan refleksivitas perdagangan.
Saya menemukan bahwa jika saya juga menggunakan analisis teknis untuk berdagang, saya pasti bisa melakukannya, tetapi mungkin saya tidak cukup percaya diri untuk melakukannya dengan baik dalam hal ini. Jadi pada saat itu saya mulai berpikir, karena kebanyakan orang di pasar berdagang dengan cara ini, dapatkah saya menggunakan serangkaian metode lain untuk mengamati pasar? Kontrak adalah pasar dengan jumlah nol. Untuk menghasilkan uang di pasar ini, Anda harus mengamati hal yang sama tetapi memiliki ide yang berbeda, atau mengamati hal yang sama sekali berbeda untuk menang di pasar kontrak.
Cara berpikir seperti ini berlaku universal di pasar. Misalnya, tingkat pendanaan sangat berguna di masa lalu. Saya juga biasa melihat rasio long-short dan open interest. Kemudian, saya tidak sering menyebutkannya. Mengapa? Karena begitu orang mulai memperhatikan, refleksivitas perdagangan akan terjadi. Hal-hal yang sebelumnya berguna akan tiba-tiba menjadi tidak berguna, atau terkadang berguna dan terkadang tidak berguna. Ketika ini terjadi, Anda harus tahu bahwa ketika ini terjadi sering kali, sistem mungkin gagal, dan Anda mungkin harus menemukan alpha deterministik baru.
Indikator Likuiditas yang sering saya gunakan sekarang sebenarnya awalnya gratis di grup saya. Saya buat menjadi channel, yang kemudian memiliki lebih dari 500 subscriber dan diberikan secara gratis selama hampir dua tahun. Kemudian, ada yang menyarankan agar alat ini tidak boleh digunakan secara gratis karena siapa pun bisa bergabung. Saya memutuskan untuk menutup grup dan melindungi Alpha ini dengan membatasi hak akses sebanyak mungkin agar tidak semua orang bisa menggunakan atau menontonnya.
Jadi, ketika Anda melihat pasar ini, pertama-tama Anda harus memiliki pola pikir bahwa Alpha harus terus-menerus efektif dan tidak banyak orang yang mengetahuinya. Jika Anda memiliki Alpha dan merasa bahwa itu berguna di banyak tempat, lalu tiba-tiba terkadang berguna dan terkadang tidak berguna, ini mungkin berarti bahwa itu telah dikenal oleh banyak orang.
Untuk melindungi versi alpha, CoinKarma juga akan membatasi jumlah pengguna. Misalnya, kami akan menghapus versi gratis baru-baru ini karena kami hanya menyediakan indikator LIQ untuk BTC dan ETH dalam versi gratis, yang sebenarnya sangat berguna. Beberapa anggota yang membayar khawatir hal itu akan memengaruhi versi alpha, jadi kami memutuskan untuk menghapusnya. Jika jumlah anggota meningkat di masa mendatang, kami akan mengendalikan kuantitas berdasarkan harga dan mencoba menjaga jumlah pengguna di bawah satu orde besaran.
Hal lain yang sering saya katakan, di pasar ini, leverage umumnya sangat tinggi. Misalnya, di bursa umum seperti Binance, Anda dapat membuka leverage 50 hingga 100 kali lipat pada banyak mata uang. Leverage tinggi ini hanya muncul di pasar valuta asing, dan di pasar valuta asing, amplitudo tahunan mungkin hanya 10%, jadi mereka menggunakan leverage yang begitu tinggi untuk memperbesar hasil. Namun, di lingkaran mata uang kripto, amplitudonya mungkin melebihi 20% dalam seminggu. Jika Anda masih membuka leverage yang begitu tinggi, siapa lagi yang akan menjadi kekuatan utama jika bukan Anda?
Jadi cara berpikir yang kedua adalah, Anda perlu mengetahui pasar jangka panjang, fluktuasi jangka pendek, mengapa terkadang garis ditarik dengan sangat cepat? Faktanya, hal itu untuk membunuh strategi kuantitatif perdagangan frekuensi tinggi dan investor ritel dengan leverage tinggi. Ketika pembuat pasar memanen chip, mereka terkadang menciptakan tren yang sangat kuat. Jadi, Anda harus terlebih dahulu memiliki pemahaman dasar ini, dan kemudian mengembangkan strategi perdagangan Anda, untuk menang di pasar. Jika tidak, jika Anda tidak tahu di mana garis likuidasi investor ritel dengan leverage tinggi, sistem perdagangan Anda akan sering tidak lengkap.
Saya pikir lebih baik memiliki pemahaman dasar tentang operasi pasar ini daripada mempelajari sesuatu. Anda perlu tahu dari mana fluktuasi ini berasal dan siapa yang menciptakan fluktuasi ini? Berapa biaya yang mereka keluarkan untuk menciptakan fluktuasi, dan berapa potensi keuntungan mereka. Ini semua adalah hal-hal yang akan dihitung oleh para pemain utama sebelum menciptakan fluktuasi. Saya harus mengeluarkan berapa banyak uang untuk menjual chip yang saya buang, dan saya harus memastikan saya bisa mendapatkan kembali chip ini, sehingga saya selalu dapat mempertahankan kendali atas target ini.
Dengan cara berpikir dan model ini, Anda akan memiliki pemahaman yang lebih tepat tentang pasar. Saya pikir ini adalah sesuatu yang jarang disebutkan oleh orang di pasar, tetapi sangat penting jika Anda ingin mempertahankan keunggulan di pasar kontrak untuk waktu yang lama.
Klub Sepak Bola
Oke, terima kasih. Pertanyaan terakhir saya adalah, apakah Anda memiliki trader, baik di industri kami maupun di luar, yang memiliki pengaruh besar terhadap Anda? Jika seseorang ingin menjadi trader seperti Anda, sistem pengetahuan apa yang menurut Anda harus mereka pelajari? Bagaimana seharusnya proses pembentukan jalur pengetahuan ini? Ini adalah pertanyaan terakhir.
Bahasa Indonesia: Benson
Bagaimana cara membentuk jalur pengetahuan?
Klub Sepak Bola
Ya, pertama-tama, bisakah Anda memberi tahu saya apakah ada pedagang yang memiliki pengaruh lebih besar terhadap Anda?
Bahasa Indonesia: Benson
Sebenarnya, sepertinya tidak ada hal seperti itu. Kalau Anda benar-benar bertanya kepada saya, saya rasa tidak ada hal seperti itu. Saya harus mengatakan bahwa saya tidak memiliki idola di bidang perdagangan. Saya tidak memiliki tipe idola "panutan" tertentu. Namun, saya akan merujuk pada pendapat orang-orang dari berbagai aliran pemikiran.
Klub Sepak Bola
Oke, tentu.
Klub Sepak Bola
Saya rasa waktunya sudah hampir habis, kita sudah berbicara sekitar 1 jam 5 menit. Terima kasih, Benson. Ada lagi yang ingin Anda tambahkan? Anda dapat melihat tweet-nya yang disematkan. Faktanya, gambar itu adalah yang baru saja ia sebutkan. Akan lebih baik jika Anda mendengarkan rekaman kami dengan gambar itu. Ada lagi yang ingin Anda tambahkan?
Bahasa Indonesia: Benson
Tidak untuk saat ini.
Klub Sepak Bola
Oke, dari apa yang saya dengar, intinya adalah poin yang Anda sebutkan di awal. Ketika semua orang melihat sebuah indikator, indikator itu mungkin menjadi tidak valid. Intinya, Anda berpikir tentang cara membangun struktur perdagangan Anda sendiri dari perspektif yang unik, atau pendekatan non-konsensus, agar dapat mengungguli yang lain. Karena pada dasarnya, perdagangan kontrak adalah permainan tentang cara untuk memenangkan hati kebanyakan orang, bukan? Cara yang Anda temukan adalah untuk memenangkan hati orang lain dengan bersikap konsisten dengan kepentingan kekuatan utama, dan kemudian membentuk sistem perdagangan Anda sendiri. Saya tidak tahu apakah ringkasan ini dapat mewakili pendekatan Anda.
Bahasa Indonesia: Benson
Baiklah, saya rasa itu merangkum semuanya dengan sangat baik.
Klub Sepak Bola
Oke, kami akan menyusun konten hari ini ke dalam versi teks dan mengirimkannya kepada Anda, lalu menambahkan beberapa gambar untuk membantu semua orang lebih memahami seperti apa sistem perdagangan Anda.
Saya pikir setiap trader memiliki gaya dan ide uniknya sendiri. Anda dapat belajar dengan cara yang sesuai dengan Anda, atau menggabungkan keunggulan orang lain untuk memperkaya diri sendiri. Ini juga merupakan tujuan awal dialog dan komunikasi kita, sehingga setiap orang memiliki ruang yang berbeda. Saya pikir sangat sulit untuk sepenuhnya menyalin strategi trading orang lain. Yang terpenting adalah kepribadian dan jalur pertumbuhan setiap orang berbeda. Jadi saya berharap lebih banyak orang dapat melihat gaya trading yang berbeda. Terima kasih sekali lagi, Benson. Meskipun kita baru saling kenal dalam waktu singkat, terima kasih telah berbagi tanpa ragu. Mari kita akhiri di sini hari ini, oke?
Bahasa Indonesia: Benson
Oke, terima kasih FC atas waktumu. Sekian untuk hari ini. Sampai jumpa.
Klub Sepak Bola
Oke, selamat tinggal semuanya.
Bahasa Indonesia: Benson
Selamat tinggal.
Artikel ini bersumber dari internet: Dialog dengan pedagang Benson: Bagaimana mereka yang menggunakan perdagangan berbasis data menghasilkan uang?
Original article by: Andrew Redden Original translation: zhouzhou, BlockBeats Editors note: tetesan udaras were once an important tool to promote the development of crypto projects, but over time, they have gradually exposed the drawbacks of short-term speculation and have difficulty maintaining the long-term loyalty of users and developers. Many projects rely on airdrops and funding programs, but what they attract is hot money that quickly disappears. In the future, blockchain projects should focus on building long-term, value-driven models to incentivize users and developers to continue to participate and contribute, so as to achieve a more stable ecosystem development. It’s time to focus on building long-term, value-driven models that ensure user and developer loyalty. After more than a decade of running a cryptocurrency startup, I’m ready to declare a paradigm shift: airdrops…


