Task
Ranking
已登录
Bee登录
Twitter 授权
TG 授权
Discord 授权
去签到
下一页
关闭
获取登录状态
My XP
0
Original title: The fallacy of daily active addresses
Original article by Donovan Choy, Blockworks
मूल अनुवाद: टेकफ्लो
Blockchain generates a lot of public data. On Crypto Twitter, people are constantly comparing blockchain A to blockchain B, and investors, researchers, and opinion leaders (KOLs) have many metrics to refer to when defending their opinions. However, the wrong use of these numbers often blurs peoples understanding of the field.
In today’s 0x Research article, we’ll explore three metrics and the issues they present: active addresses, blockchain “profitability,” and total value protection.
“Active addresses” refers to how many active, paying users there are on a certain protocol.
“Facebook has three billion monthly active users” is a useful piece of information that tells us something about the social network. Since there aren’t enough profitable opportunities for spammers to flood Facebook, active addresses are a good way to assess the true value of the platform to consumers.
But for blockchains, active addresses are less valuable due to how easy it is to create new wallets and the obvious opportunities to profit through airdrops or protocol incentives.
For example, the chart below shows a clear case: Solana has the most daily active addresses over the past month, so Solana looks very active.
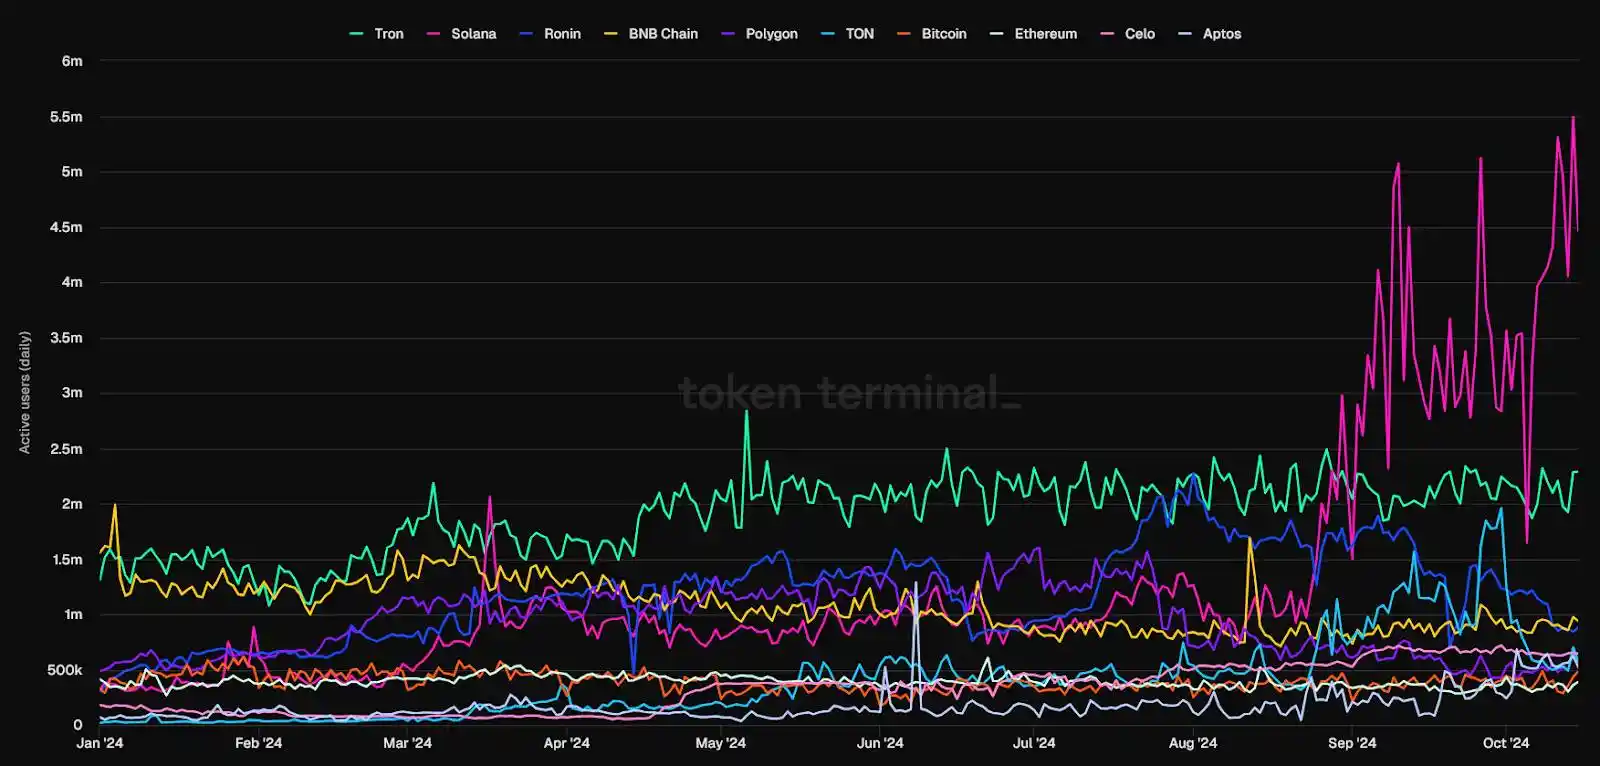
स्रोत: टोकनTerminal
Most Solana users trade on decentralized exchanges (DEXs), so we need to take a closer look at activity on DEXs. When we drilled down into Solana’s active addresses on its DEX, we found that the majority of addresses — about 3.4 million, 4.4 million total — traded less than $10 in lifetime volume over the past day.
This suggests that there may be a large amount of spam or bot activity due to Solana’s low transaction fees, rather than a large number of “quality” users.

Source: Blockworks Research
Here’s another example I mentioned earlier: Celo L1 (now L2) saw a surge in daily active addresses sending stablecoins to 646,000 in September. This number surpassed Tron, and thus caught the attention of Vitalik Buterin and CoinDesk.
After further analysis, Jack Hackworth, a data analyst at Variant Fund, found that 77% of Celo addresses transferred less than two cents, mainly because thousands of users received tiny amounts of funds through a universal basic income protocol called GoodDollar. In both cases, active addresses showed high usage, but after careful analysis, this statement did not hold true.
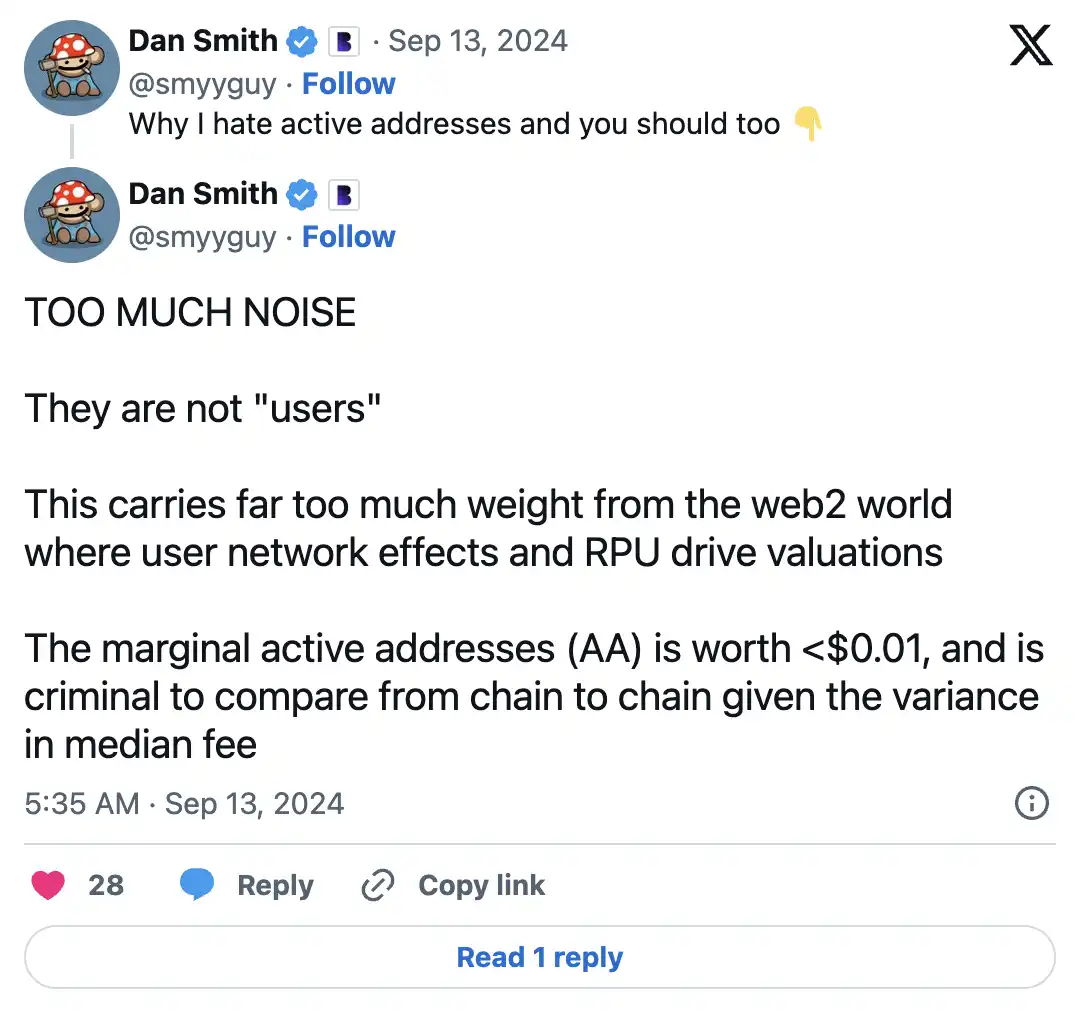
For more information, see Dan Smith’s research, which focuses on the misuse of daily active addresses.
ब्लॉकचेन गतिविधि का अध्ययन करने के लिए सक्रिय पतों पर ध्यान केंद्रित करने के बजाय, नेटवर्क शुल्क मीट्रिक को देखना बेहतर है। शुल्क प्रोटोकॉल का उपयोग करने की कुल गैस खपत को दर्शाते हैं, गुणवत्ता वाले उपयोगकर्ताओं के मुद्दे को ध्यान में रखे बिना।
Fees are often used by analysts and investors to determine which blockchains generate the most “revenue.” We then consider the issuance of tokens that a blockchain pays to validators as a cost. The result is the “profitability” of the blockchain.
This is how Token Terminal generates “financial statements” for क्रिप्टो protocols. For example, the chart below shows that Ethereum L1 has accumulated millions of dollars in losses in the past two months.
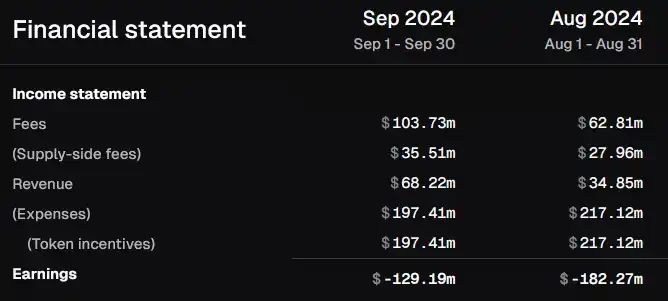
Source: Token Terminal
The only problem is that this calculation fails to take into account a key factor: unlike PoW chains (like Bitcoin), users on PoS chains can also easily earn token issuance rewards.
After all, if I can get 5% ETH/SOL staking yield from liquid staking platforms like Lido or Jito, why should I care if the network is unprofitable? Therefore, it is problematic to conclude that Ethereum is unprofitable by considering token issuance as a cost.
In the real world, inflation is harmful because when central banks print large amounts of money, the increased money supply reaches different participants in the economy at different times, and those who get the new money first benefit before real prices adjust. This is known as the Cantillon effect.
In a PoS blockchain economy, this is not the case, because inflation (i.e. token issuance) is received by everyone at the same time. Therefore, no one becomes richer or poorer as a result – everyones wealth remains the same.
Instead, we can consider using an alternative metric called Real Economic Value (REV). REV combines network fees and MEV tips to validators, but does not include token issuance as a cost.
Based on this, we can see that Ethereum has actually been profitable over the past two months:
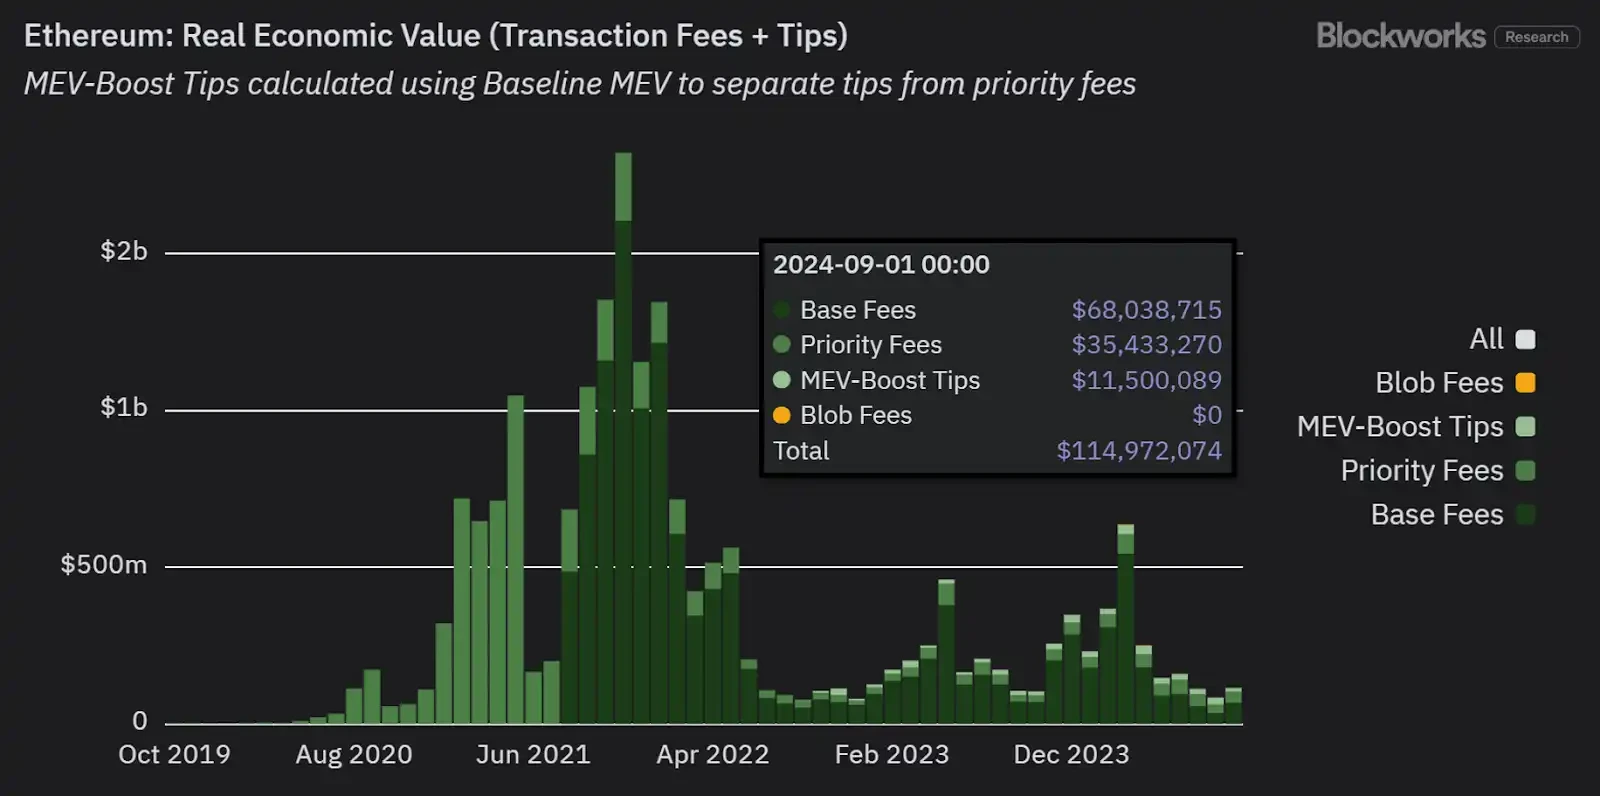
Source: Blockworks Research
REV is arguably a better indicator of the true demand for the network and a more comparable revenue metric to traditional finance (TradFi).
In summary, traditional profit and loss accounting methods are not easily and directly applicable to blockchain.
For more on this complex topic, listen to the recent Bell Curve podcast with Jon Charbonneau.
Oracles are critical infrastructure for blockchains to obtain off-chain data. Without Oracles like Chainlink, the blockchain economy cannot reliably reflect real-world prices.
A common way to compare the market share of Oracle providers is to use the “Total Value Secured” (TVS) metric, which aggregates all TVL secured by Oracles. DefiLlama explicitly calculates this:
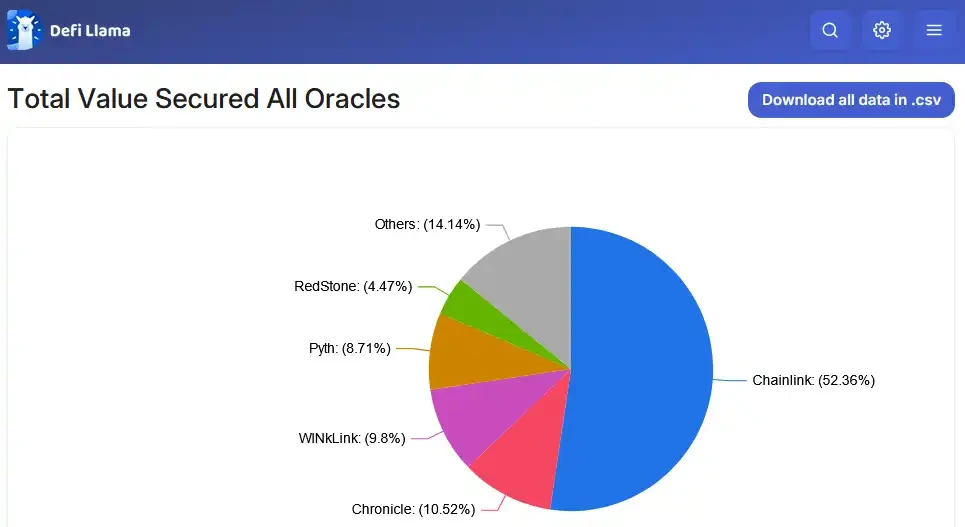
स्रोत: डेफिलामा
The problem with TVS is that it obscures the activities that Oracles actually secure.
For example, Oracles that power high-frequency trading products such as perpetual contract exchanges continuously “pull” price updates from off-chain data sources with sub-second latency.
This is in contrast to “push” oracles used in lending protocols, which only need to update prices on-chain a few times a day because they don’t need to be updated frequently.
TVS focuses on the total value managed by Oracles, but ignores the performance strength of Oracles providers.
In other words, its like saying that a fancy steak and a salad are both priced at $50 on the menu, so they are of equal value to the diner. But obviously, it takes a lot more work to make a steak than a simple salad, and thats a factor worth considering.
An alternative metric is total transaction value (TTV), which takes into account periodic transaction volume using Oracle update pricing.
TTV excludes low-frequency applications such as lending, CDPs, and re-collateralization, but as Ryan Connor explains, “Only 2-9% of oracle price updates come from these low-frequency protocols, which is a small percentage in the cryptocurrency space given the high volatility of the underlying indicators.”
When Oracles are evaluated based on TTV, market share changes dramatically.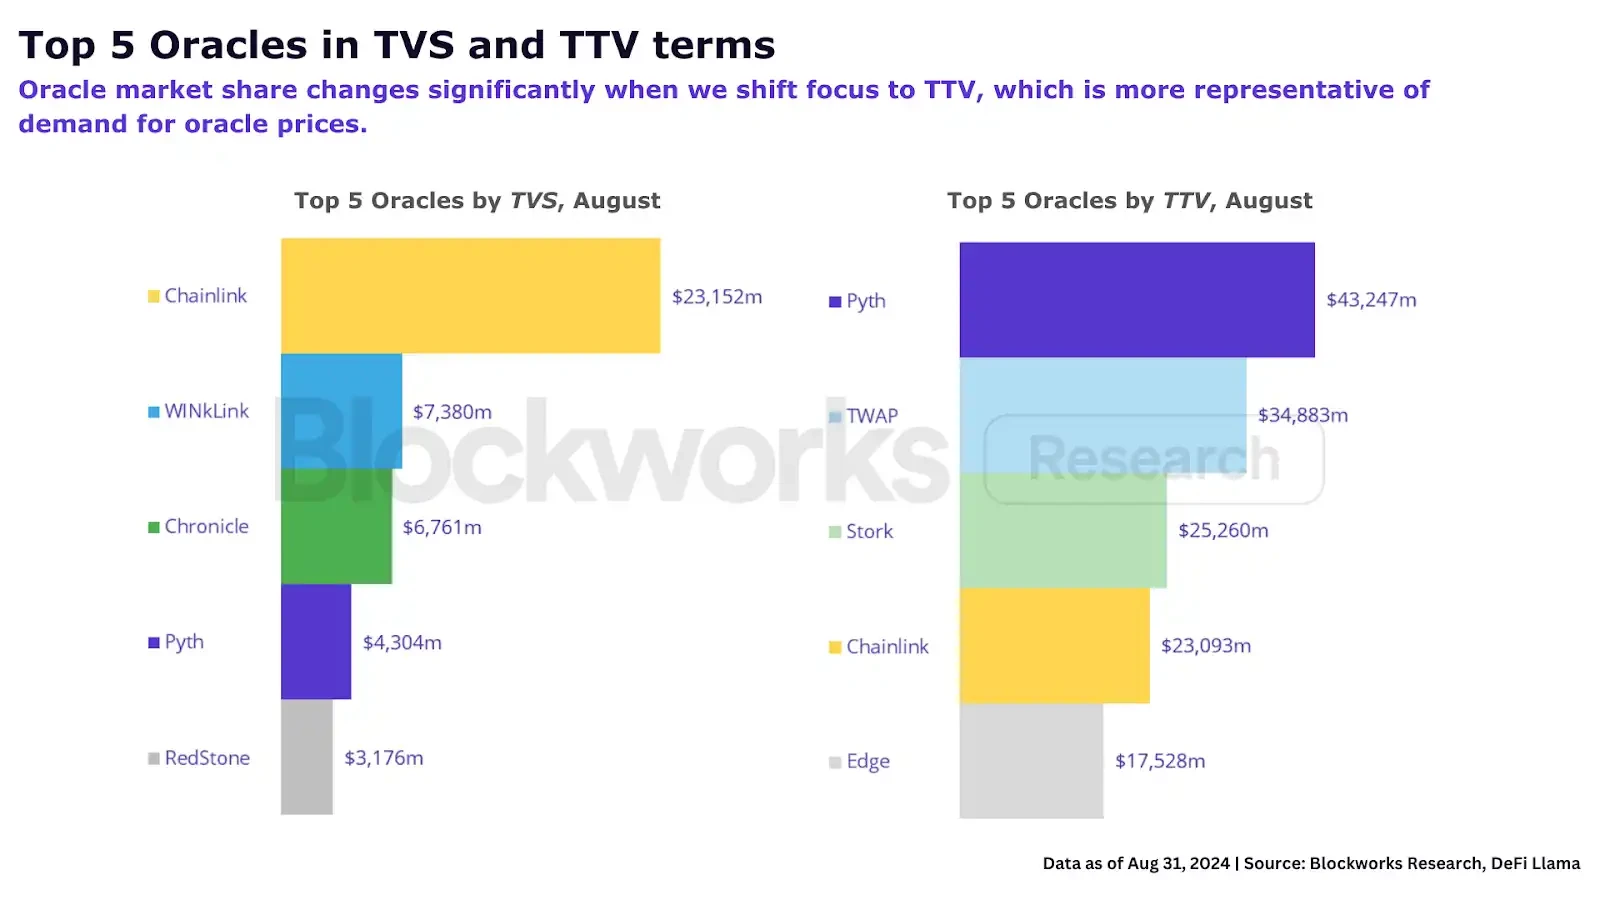
अधिक जानकारी के लिए देखें Blockworks Research’s report on how TTV can better reflect Oracles’ fundamentals.
This article is sourced from the internet: Separate the true from the false, and stop using the daily active addresses indicator to mislead your investment research judgment
Related: Analysis of the Pump Fun Phenomenon
In the recent cryptocurrency market, Pump Fun, as a representative of the new generation of Meme token issuance platforms, has set off an unprecedented speculative craze. Everyone fantasizes about exchanging 0.02 SOL for multiple returns, or even realizing the dream of getting rich overnight. This article will analyze the phenomenon, profitability and future of PumpFun. We will also pay attention to the Sun Pump project on the XRP chain to explore whether it can replicate the success of Pump Fun. In my opinion, when money becomes the core driving force, it will be more difficult to build a community that truly represents Meme culture. 1. Analysis of the Pump Fun Phenomenon Pump Fun Project Background and Its Rise in the बाज़ार The rise of Pump Fun is closely related to…


