पीएसई ट्रेडिंग: मैक्रो और डेटा विश्लेषण से सकारात्मक दृष्टिकोण का पता चलता है
मूल लेखक: @zhili , @MacroFang , @chenchenzhang
प्रमुख बिंदु
Part I Macro Market
-
Market status : The collapse of the yen carry trade led to the liquidation of a large number of positions, the market corrected its mistakes, and the Topix index led the deep V reversal.
-
Data adjustment : Although recent CPI, PPI and other data are in line with expectations, there are doubts such as the forced adjustment of energy and used car prices, which will reduce the markets implied volatility.
-
Fed Movement : Speeches by Fed officials indicate cautious policy adjustments, and the September dot plot is expected to continue to maintain an accommodative stance.
-
Federal deficit : The Feds dovish stance, the Treasurys short-term bond issuance, and the bond repurchase program have eased market tensions. Although large-scale financing programs may put pressure on market liquidity, the increase in reserves and the flexibility of fiscal operations help maintain market stability.
-
Corporate Performance and Buybacks : SP 500 companies performed steadily in the second quarter. The opening of the corporate buyback window will enhance liquidity, and the U.S. stock market is expected to continue to grow in the short term.
-
Medium-term market outlook : The market outlook is complex, and uncertainties such as inflation, change of government, policies and fiscal deficits need to be closely monitored.
Part II Crypto Data
-
Stablecoin growth : Stablecoin issuance continued to rise in 2024, indicating that market demand remains strong.
-
ETF liquidity : Bitcoin spot ETF net inflows decreased after May, and market sentiment turned to wait-and-see.
-
Holding cycle : Nearly half of Bitcoin is controlled by long-term holders, and market confidence is solid.
-
Holding coin cost : The on-chain holding coin cost is higher than the current market price, and the market still has room to rise.
-
Market resilience : Despite the volatility, investors are willing to hold on to their money and the market is healthy and stable.
Part I Macroeconomics enters a turning point
1. August: Will recover from the turmoil
1.1 The collapse of the yen carry trade led to the liquidation of a large number of positions, the market corrected its mistakes, and the Topix index led the deep V reversal
August 5 Bank of Japan rate hike: triggering collapse of yen carry trade
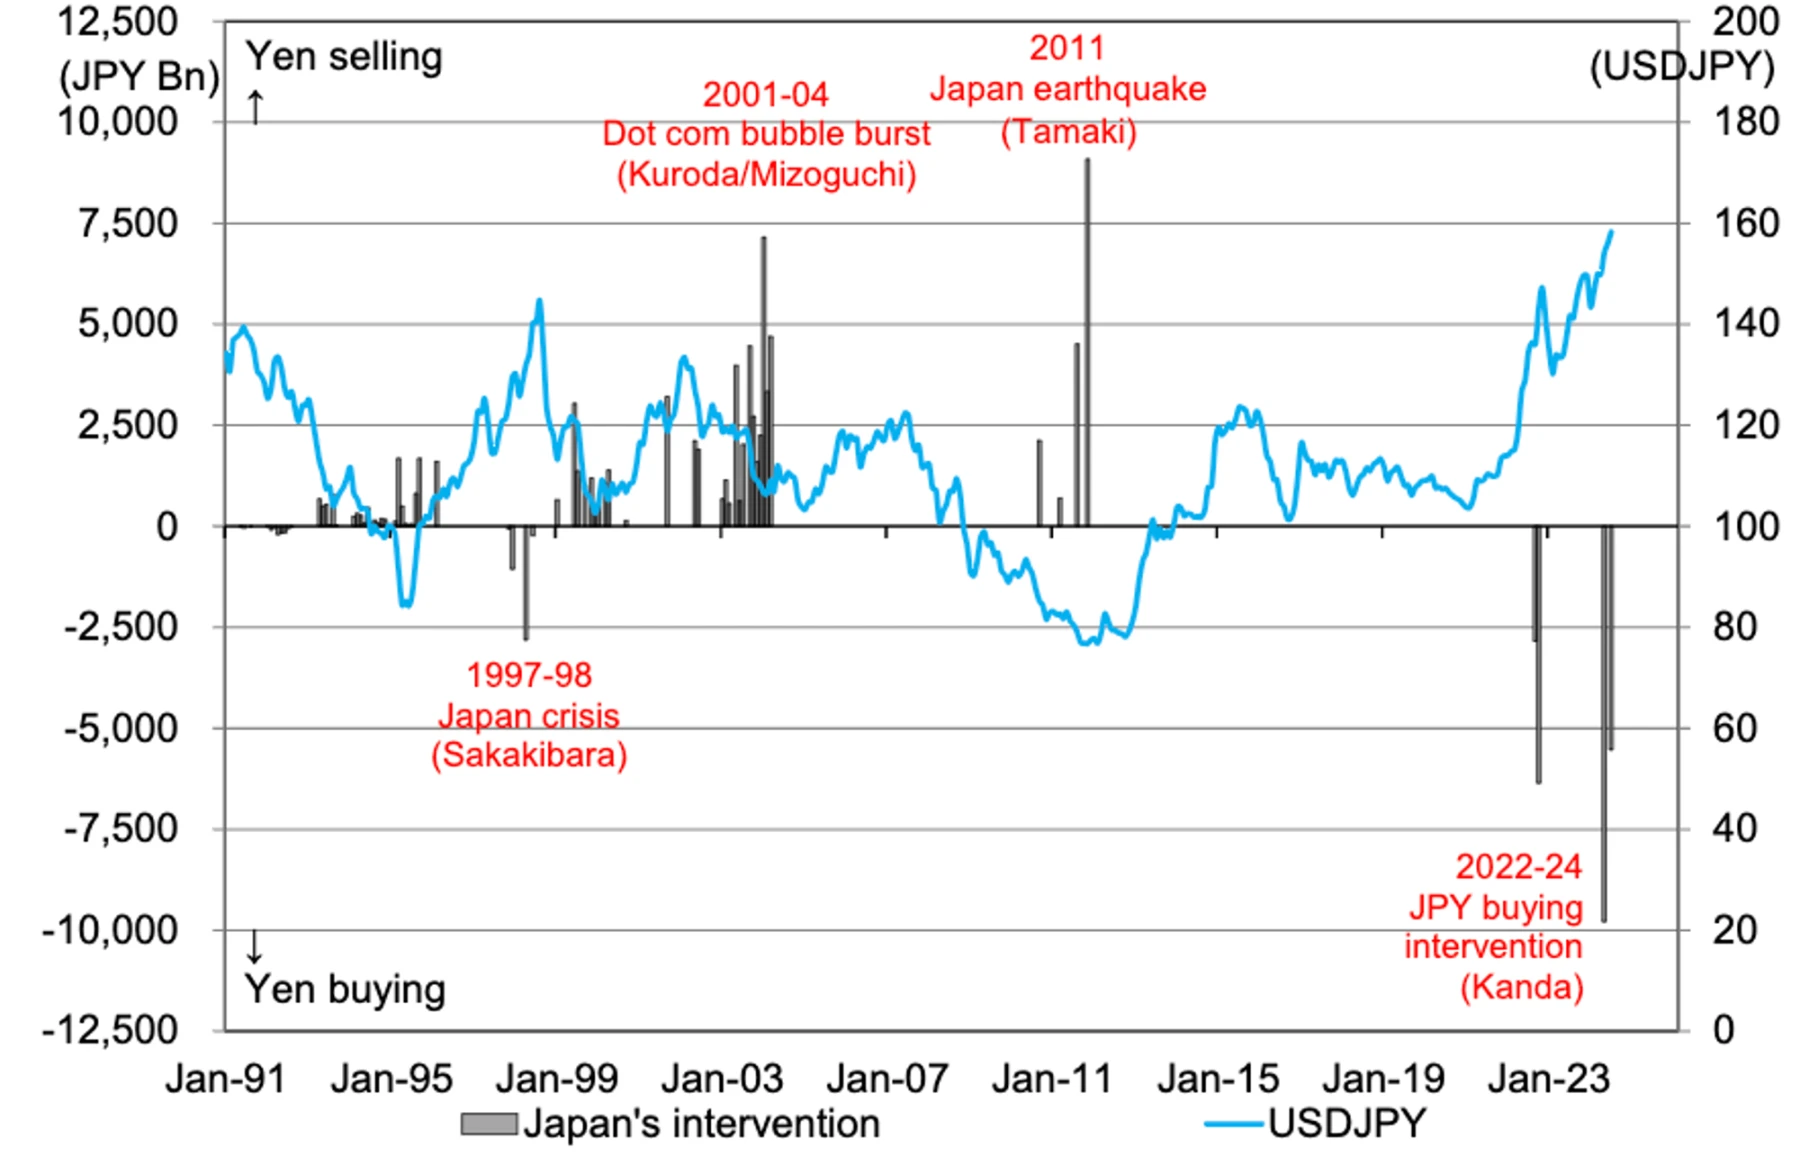
USD/JPY has fallen sharply over the past four weeks, from nearly 162 JPY/USD to around 142 JPY/USD, consistent with our bearish outlook. This sharp decline was triggered by the Bank of Japan’s rate hikes and the Japanese government’s intervention to buy yen on July 11 and 12. While some doubt the effectiveness of FX intervention, we support its ability to change market trends by shifting supply and demand.
USDJPYs recent move mirrors similar declines in 1990 and 1998, but it is worth noting that this move does not always signal a long-term trend reversal for USDJPY, unlike EURJPY and AUDJPY, which deserves further consideration.
Panic selling on August 5: Global markets crash
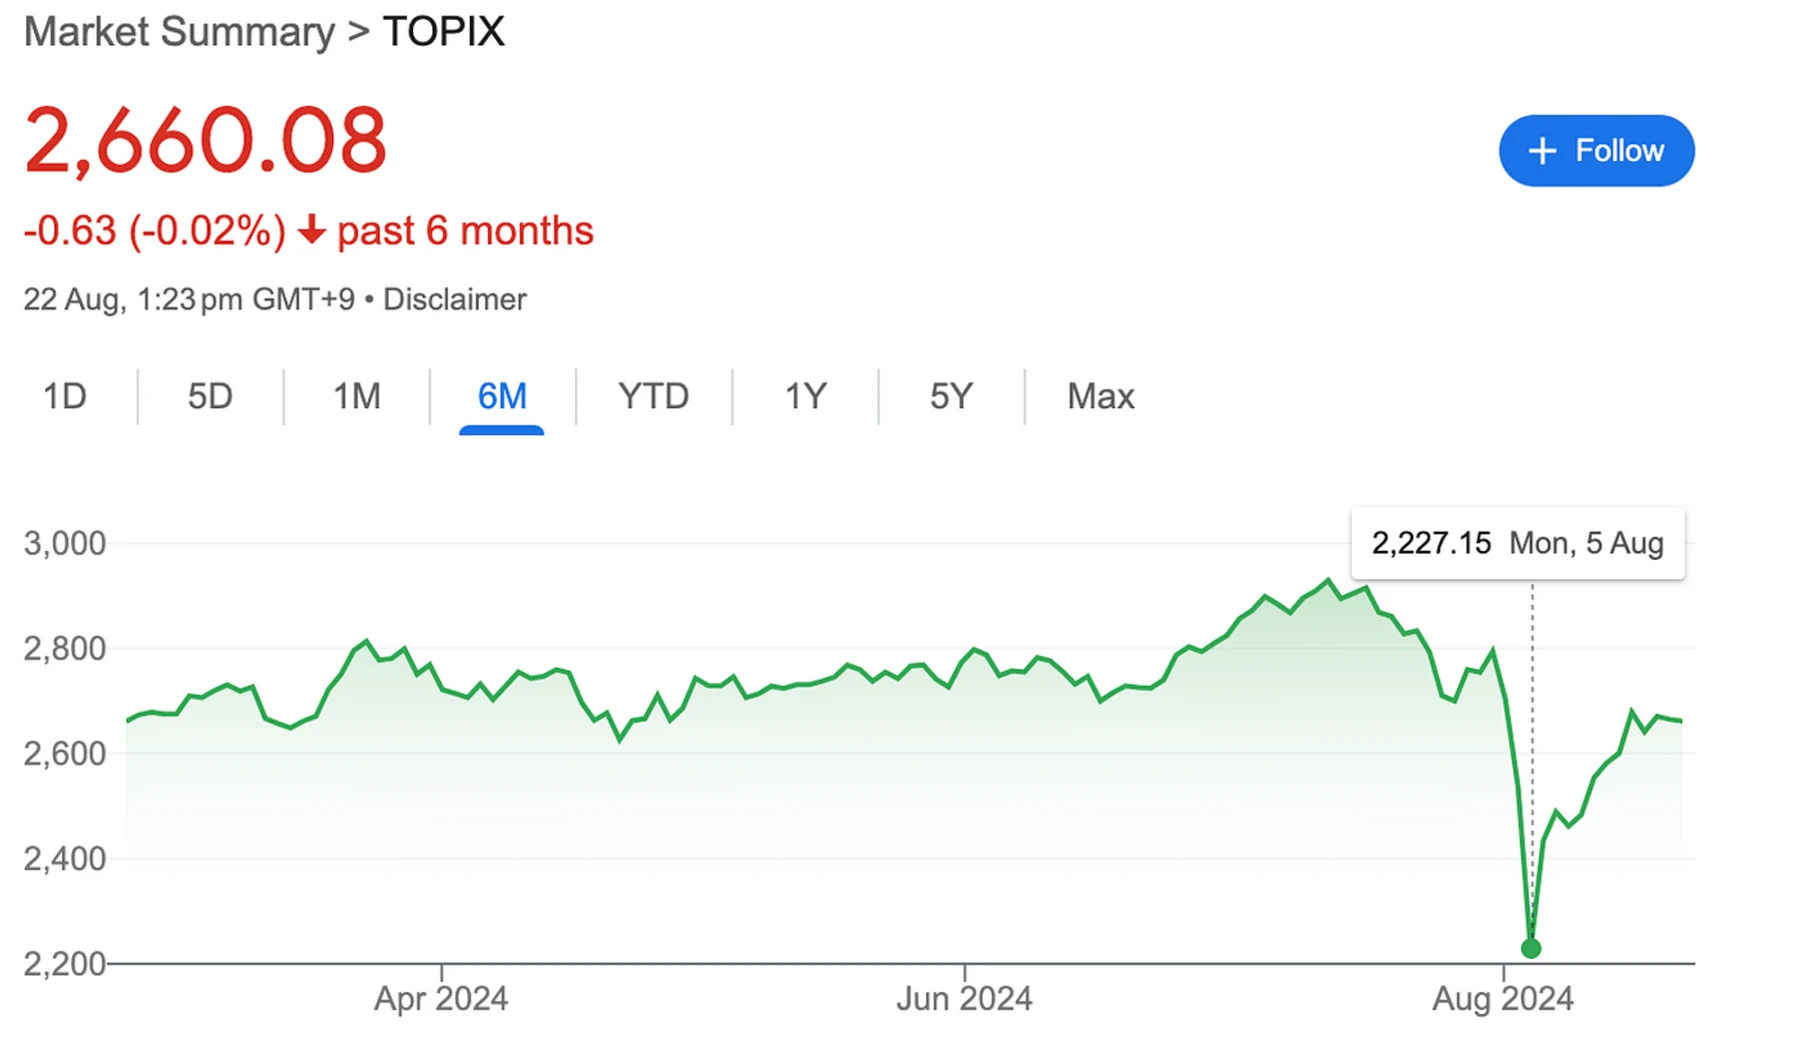
The Bank of Japan’s surprise rate hike caused the Topix to fall 20% in a single day as investors panicked to cover their positions. Stocks fell sharply over several trading days as recession risks rose and fears that sharp moves in the yen would trigger a broader de-risking.
Weaker-than-expected ISM data, rising unemployment claims, and disappointing nonfarm payrolls paint a gloomier picture of the U.S. macroeconomic outlook, raising concerns about an impending recession. Our economists note that rising unemployment and weak ISM may already signal the start of a recession cycle.
Despite the absence of risk events over the weekend, SP futures fell nearly 5%, NDX fell over 6%, and VIX surged above 60. FOMC news hinted at a possible rate cut in September.
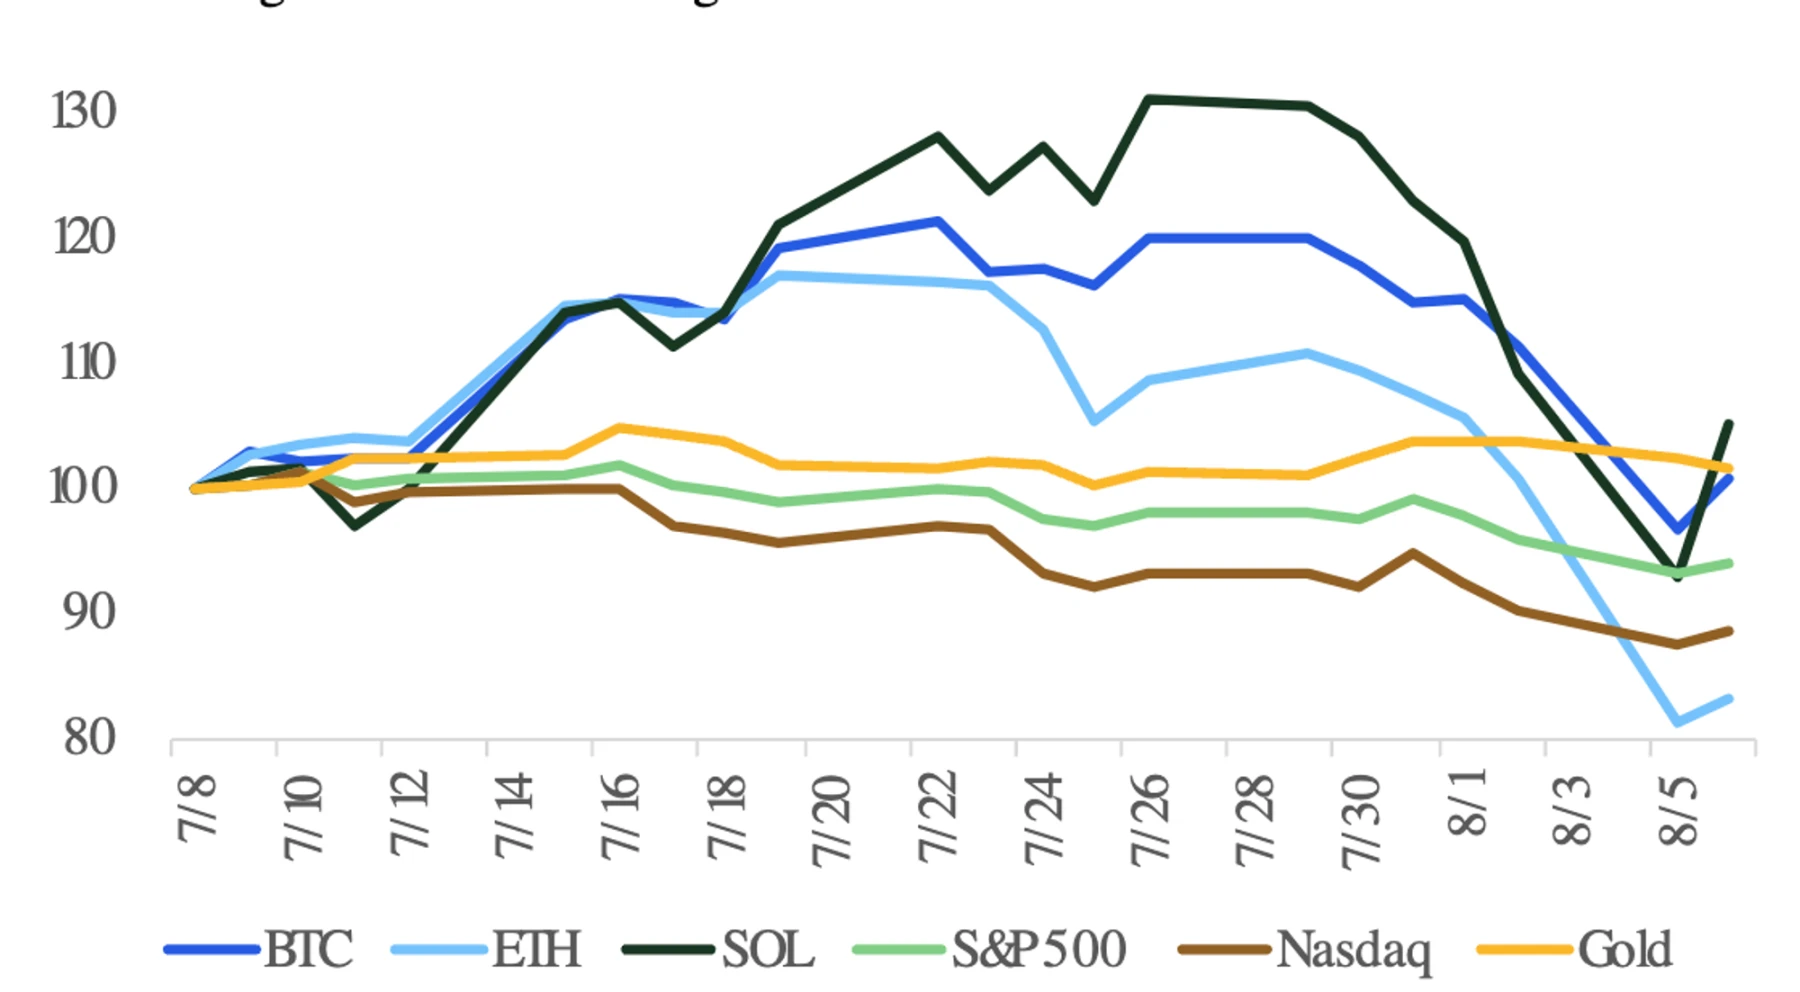
High leverage in the system, especially in cryptocurrencies and large-cap stocks, has contributed to the market size and volatility. Notional volume was three standard deviations above normal, the largest volume on a non-index rebalancing day in the U.S. market since February 2022. Investor activity was mixed, with SP bullish positioning declining and Nasdaq positioning relatively unchanged despite greater volatility. We expect Fridays large new short positions to have a large impact on Nasdaqs net-long position in the coming sessions.
1.2 Market turmoil: Macroeconomic positives trigger risk appetite
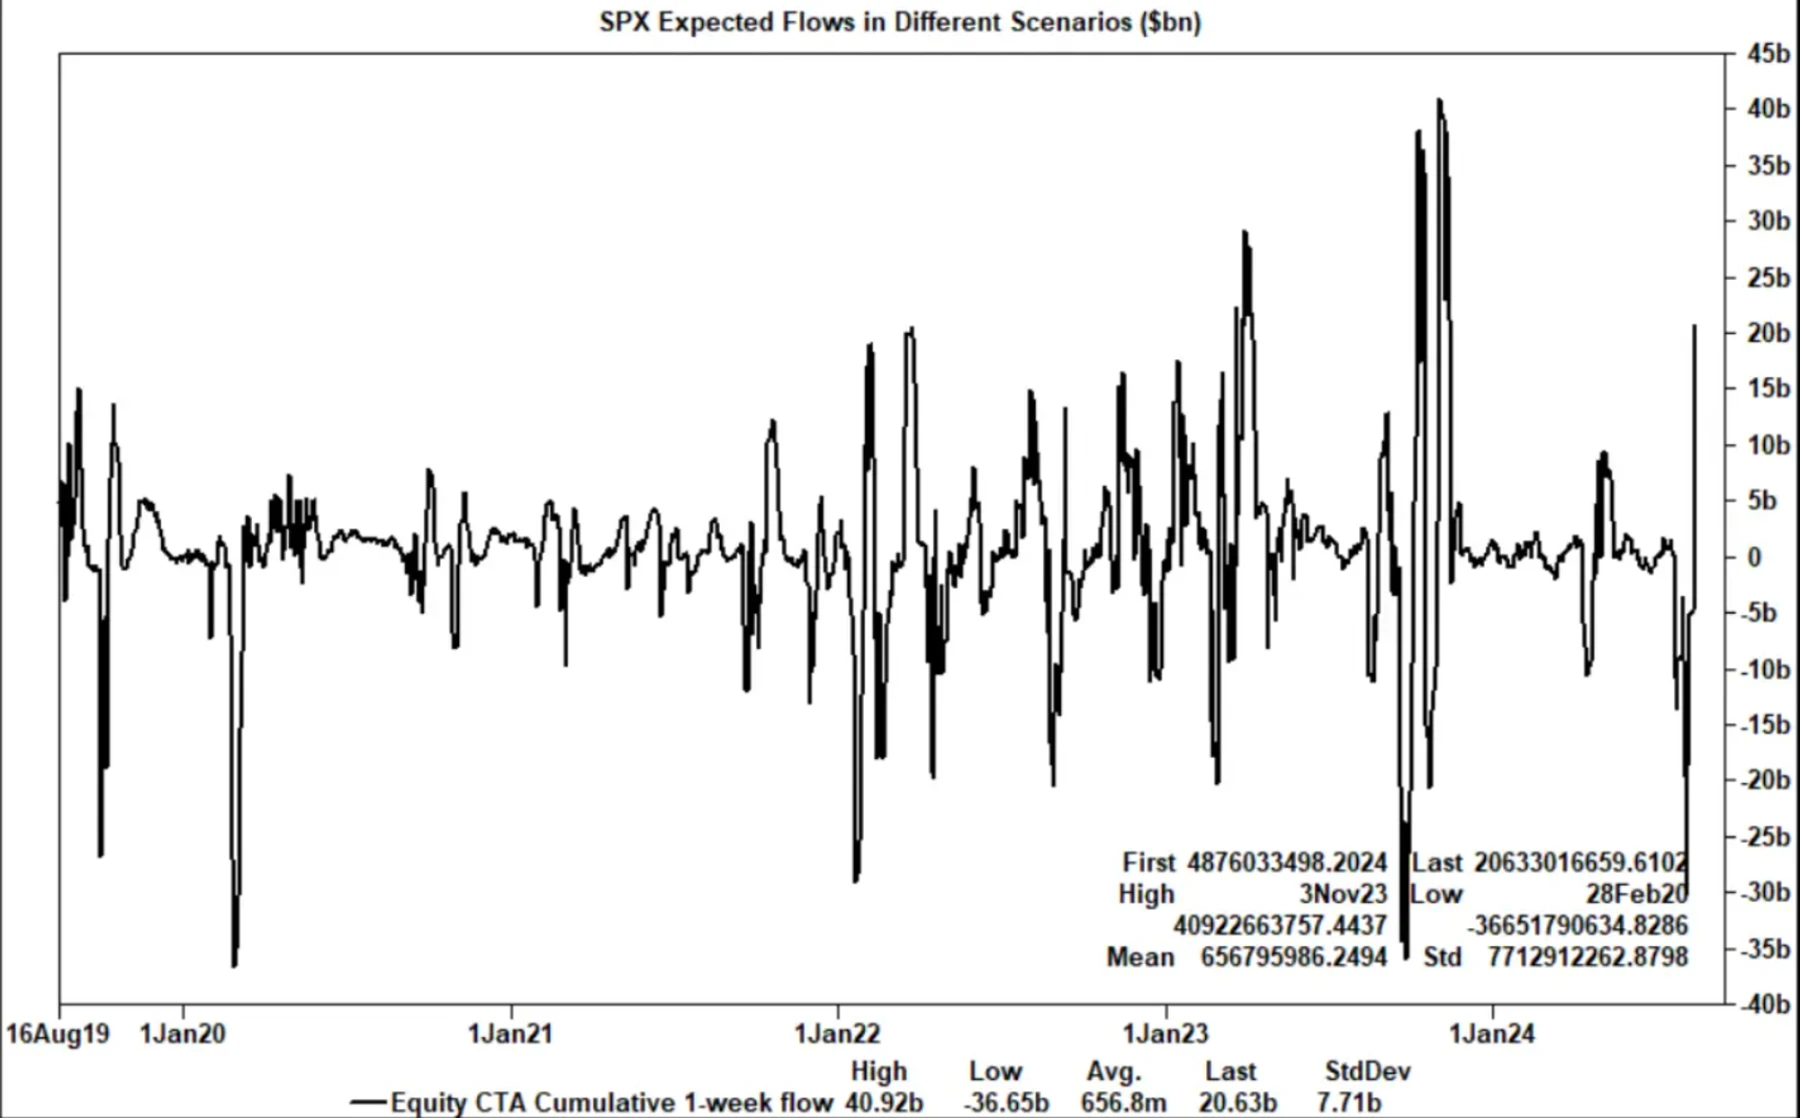
After the leverage was removed, the market rebounded sharply, led by the Topix. Positive macroeconomic data released last week drove bullish investor flows back to the US indices, with more than $16 billion of new funds added to the SP and further positions expanded. The Nasdaq and Russell 2000 indices rose modestly, with losses on Nasdaq long positions easing. Global market sentiment was positive, with nearly all European and Asian indices rising in nominal terms. The DAX and FTSE turned net positive, while the KOSPI and Nikkei continued their bullish momentum. Nikkei flows were strongest in Asia, while the KOSPI hit a nearly three-year high. In contrast, the China A 50 Index remained bearish, with limited position risk.
CTA quantitative buying also drives huge liquidity into the market, and in the short term, it is expected that CTA will buy more than 60 billion stocks, 30 billion will flow into US stocks, and strong buying demand will drive the market further up. According to statistics from Scott Rubner of Goldman Sachs, in the past three weeks, the Gamma of traders has changed by 16 billion, and long positions have turned into short positions and then into long positions. The Gamma of traders is no longer short-term and will serve as a buffer for the market in the future.
2. Data inconsistency
2.1 Data falsification helps restore market sentiment and strengthens expectations of a Fed rate cut
Last weeks CPI, PPI, retail data, and PMI data all just happened to meet market expectations, dispelling market expectations of a recession while maintaining the Feds expectations of a rate cut. However, we see the irrationality in the coincidence of the data. For example, the PPI data, while energy remained unchanged from the previous month, rose by about 2% year-on-year. Although this can be explained by exports and government purchases, the CPIs used car sub-item (-10.9%) does not conform to normal logic.
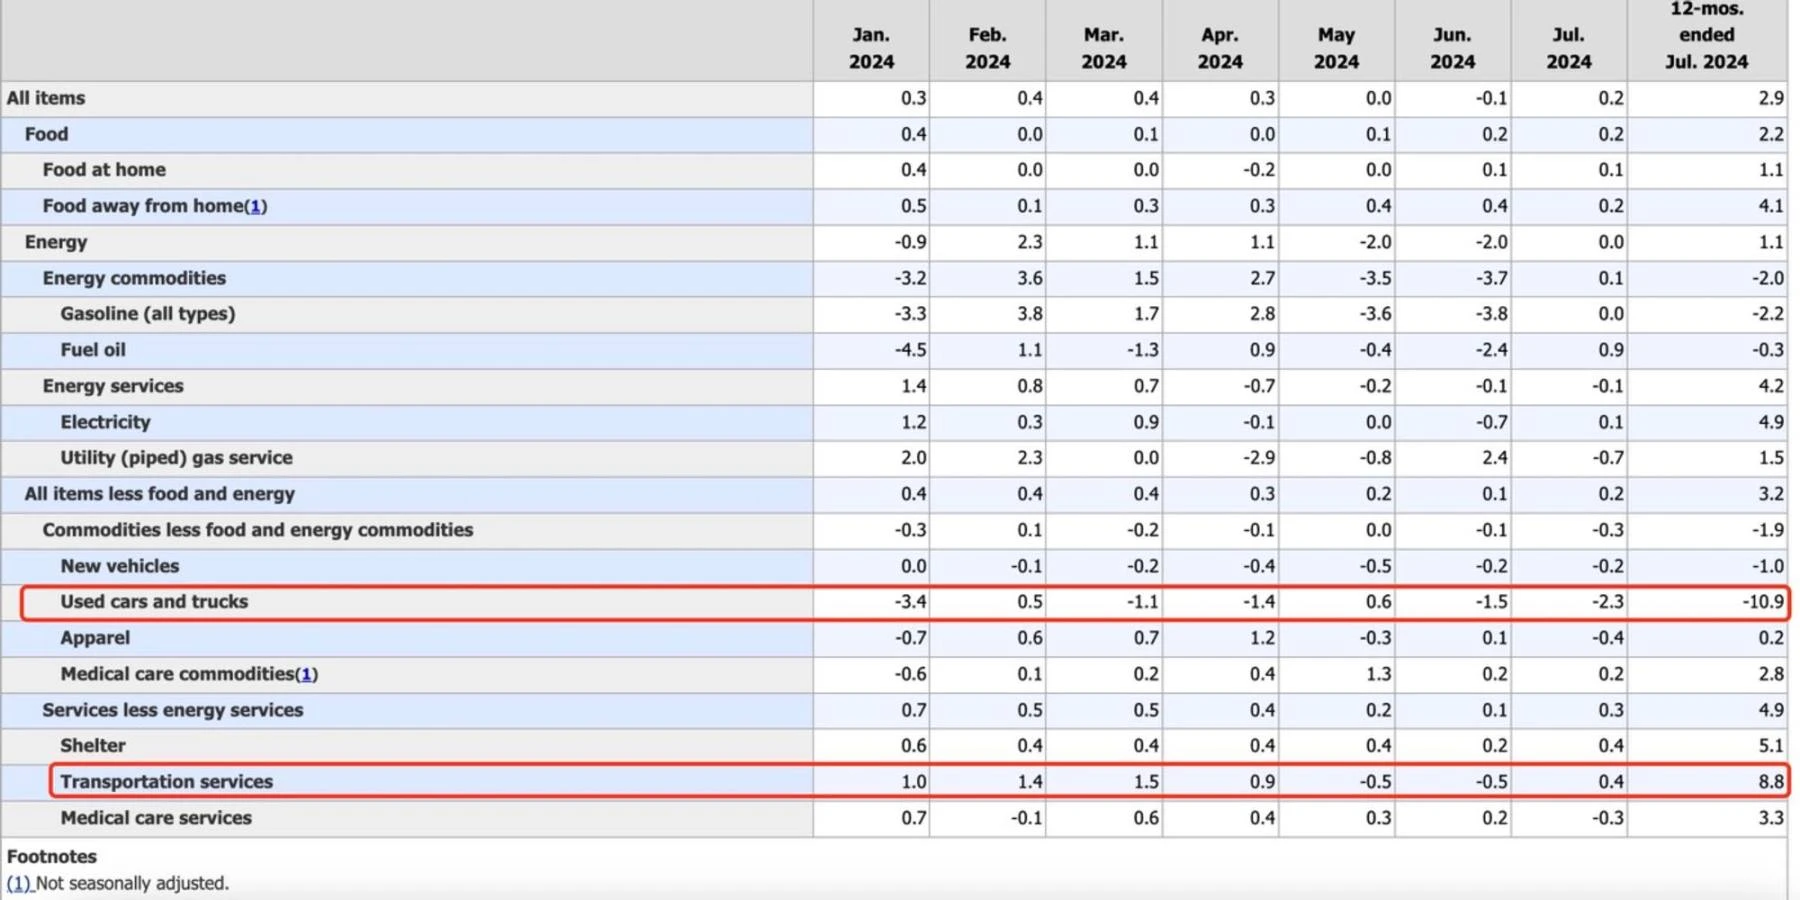
Due to the network failure of CDKs software and technology in June, most used car dealers were unable to deliver vehicles, resulting in a large backlog of orders. According to the Mannheim Used Car Report, both transaction volume and transaction price increased in the first half of July (1.6%). We expect a decline in the second half of July, but according to our estimates, a year-on-year decline of more than -10.9% is very unreasonable, far exceeding our expectation of -4.3%.
In general, although the recent CPI, PPI, retail and PMI data are in line with expectations, there are doubts, such as energy risks in PPI and used car price fluctuations in CPI, which show that the real data may be biased, reducing the implied volatility of the future market.
3. Fed’s moves
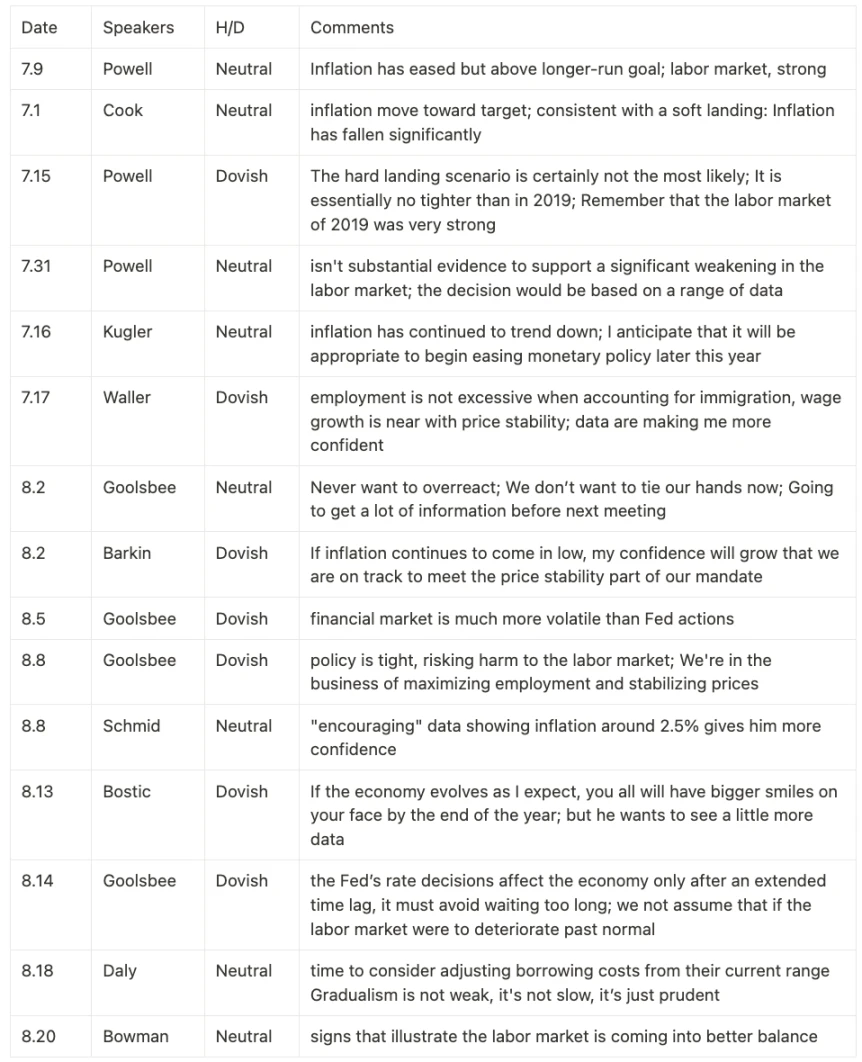
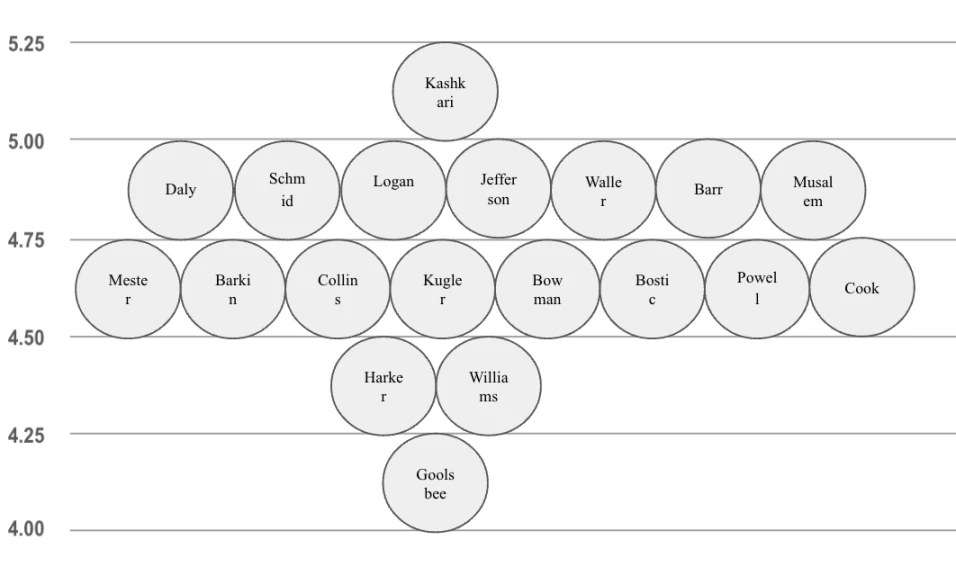
In response to recent adjustments in remarks by Federal Reserve officials, we expect that the future dot plot will emphasize expectations for three rate cuts.
3.1 Official Statements
3.2 Dotmap Prediction
Powells speech and interest rate changes in September are not expected to cause volatility. What will determine the market trend is more likely to be the dot plot in September. Combining the above Fed speeches and our subjective judgment of officials in the long term, we believe that the median and mode of the dot plot shown in September are 75 bps.
3.3 Interest rate cuts will usher in a super cycle
In recent minutes, most federal officials support easing policy if data meets expectations. Chairman Powell acknowledged that a rate cut was mentioned in the July discussion, and several officials also supported a 25 basis point cut, while leaning towards a trend of a possible larger rate cut in September. Officials expressed confidence in slowing inflation due to slowing wage growth and consumer resistance to high prices, while risks to employment increased.
While August employment data will be key to determining the size of the September rate cut, the minutes suggest that officials are likely to support a larger 50 basis point rate cut. In addition, if the labor market continues to deteriorate, the balance sheet reduction may end in December, otherwise it may extend to the second quarter of 2025.
Yesterdays revised employment data from the Bureau of Labor Statistics showed a loss of 818,000 jobs over the past 12 months, reinforcing the signal of labor market weakness, which will affect market sentiment and FOMC pricing.
Labor force data on September 6 will be critical, but we view the risk of this event as low.
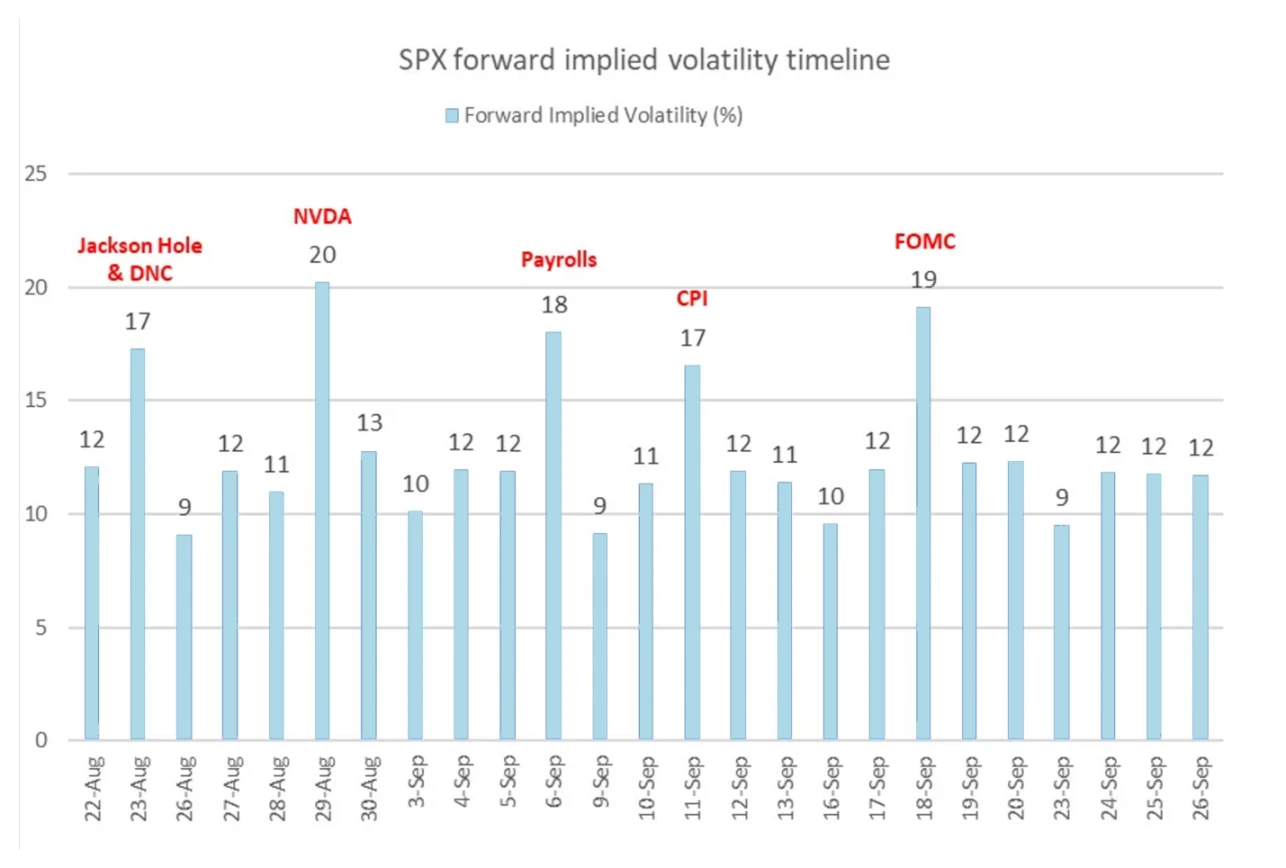
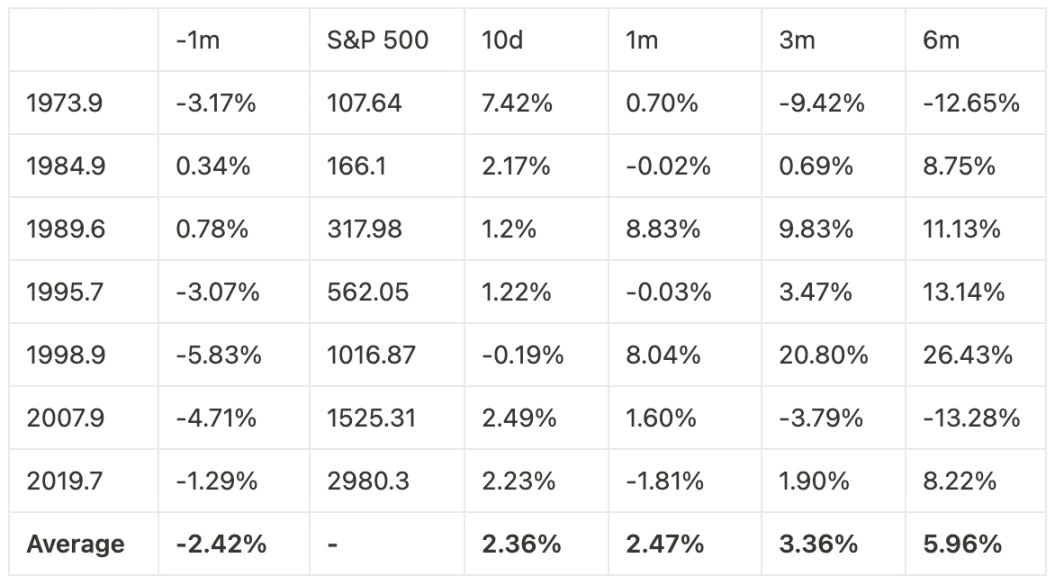
The SP 500 is likely to end the month with a rise. In the past, it was rare to see a rise before a rate cut (1973-Now), only in 1984 and 1989, and there was no significant correction within 1m, 3m and 6m after the rate cut. (However, due to the small amount of data, the judgment on the market trend after this rate cut is limited, for reference only).
4. Federal Deficit
——The federal deficit has widened, but the Fed’s dovish stance, the Treasury’s short-term bond issuance and bond repurchase programs have eased market tensions. Although large-scale financing programs have put pressure on market liquidity, increased reserves and the flexibility of fiscal operations will maintain market stability.
4.1 Adequate financial liquidity
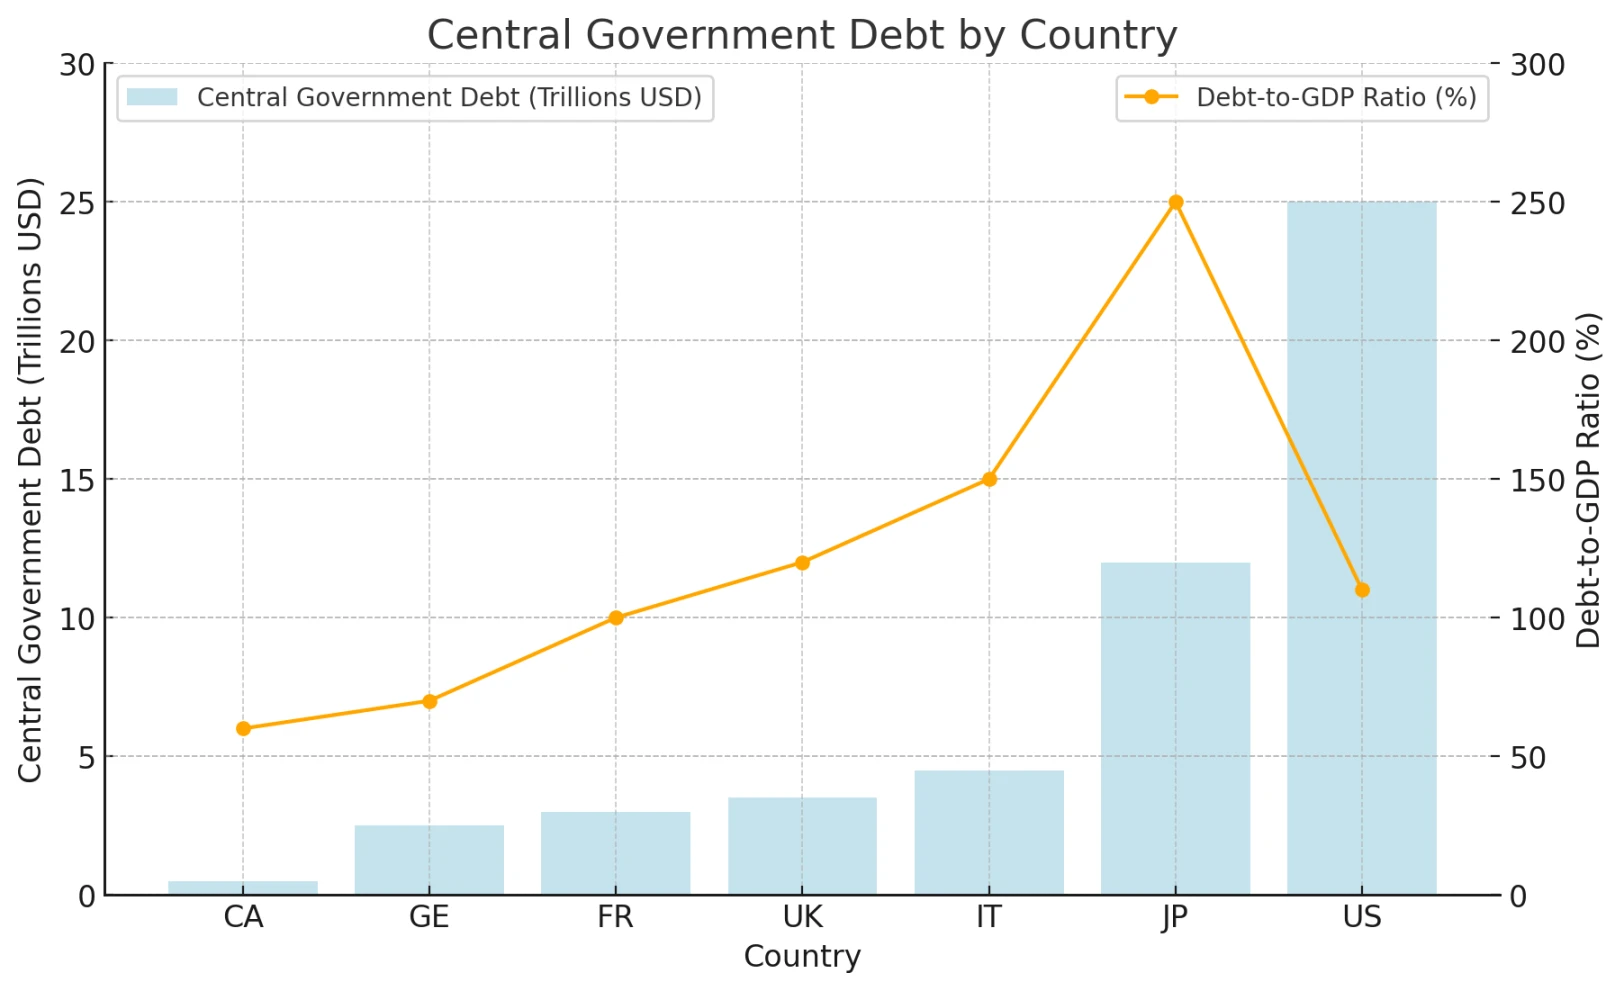
Markets expect the deficit to total $1.6 trillion this fiscal year, or about 6% of GDP. The increase in debt levels alone has led to higher interest payments that surged by $185 billion year-over-year. The relief is that the federal governments total debt as a percentage of GDP remains around 110%, which is relatively healthy among major economies.
Major primary dealers have accumulated record-high U.S. debt and must reduce leverage. In the long run, this will put great pressure on the U.S. government, but in the short term it will allow the Fed to maintain a more dovish tone. Quantitative indicators such as the Chicago Feds Financial Conditions Index (NFCI) show that financial conditions have reversed all the tightening pressures that the Fed has experienced when raising interest rates.
4.2 Debt structure adjustment
The Ministry of Finance plans to raise 740 B in July-September and 565 B in October-December. Although the amount is large, it is slightly lower than our teams forecast (due to the Feds slowing pace of quantitative tightening and the higher cash surplus at the end of the quarter due to higher tax revenue in the previous quarter).
There are voices in the market that are worried that the Treasurys massive financing plan will drain liquidity from the reserve market, leading to a market decline. We are not pessimistic about this.

Since the Fed began quantitative tightening in June 2022, ON RRP balances have decreased by $1.68 trillion, while reserves have increased by $15.5 billion. ON RRP balances fell by $127.7 billion in the last week and by $141.1 billion in the last four weeks. Reserves increased by $186.2 billion in the last week, an increase of $30.5 billion from the previous month. Therefore, the impact of the balance sheet reduction is felt more in ON RRP balances without directly affecting reserves, the main source of financial liquidity.
The Treasury introduced liquidity management repo at its last refunding in May, and while cash management repo has not yet been initiated, we believe it makes sense to conduct repo in the weeks leading up to the September tax period, which would reduce the need for T-Bill issuance in September.
In the future, the market estimates that the proportion of T-Bills held by the Ministry of Finance may rise to more than 20% (meaning that the scale of long-term bond issuance will be relatively reduced), which will drive down the term financing premium in the medium and long term and further guide the loose financial market. However, due to the negative attention caused by the recent TBAC financing guidance, the Ministry of Finance may not abandon the guidance of 15%-20% in the short term.

5. Corporate earnings and buybacks
SP 500 companies performed stably in the second quarter and are expected to continue to grow rapidly in the next two quarters; market repurchase activities will also continue to inject liquidity into the market.
5.1 Optimistic profit growth
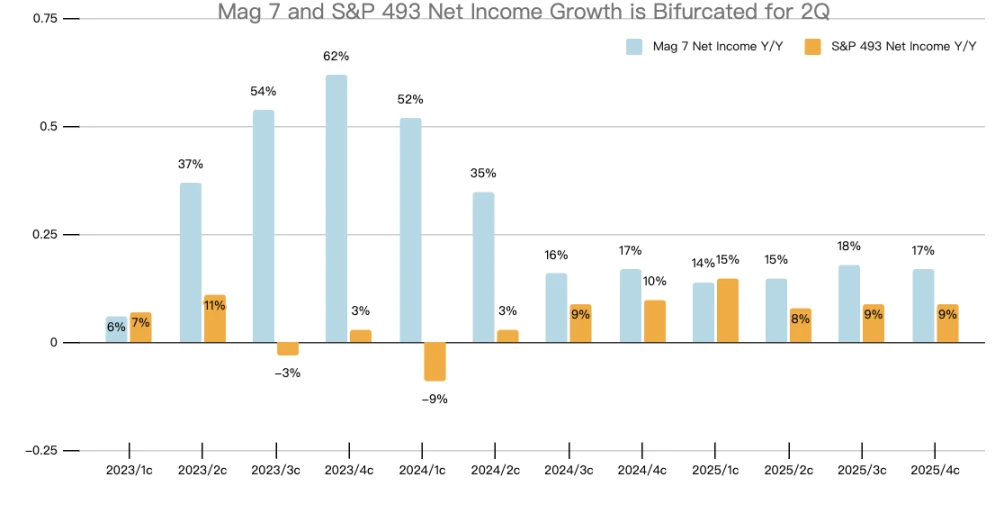
Although the market is obviously more picky about the performance of the highly valued M7, the SP 500 as a whole performed normally in the Q2 earnings season. This quarter is different from the previous growth quarters led by M7. The Q2 earnings of SP 493 are one of the important factors driving the rise of US stocks in this quarter, offsetting some of the impact of the M7 earnings not meeting the standards. We expect that the earnings of SP 493 in Q3 and Q4 will usher in double-digit growth, while driving up risk appetite, and risk assets (Russell 2000 and Bitcoin, etc.) will usher in spring.
5.2 The scale of corporate buybacks is huge
Most companies are now in an open window for repurchases. When the market fluctuated greatly on August 5, the speed of corporate repurchases increased significantly. According to Goldman Sachs block trader data, the repurchase volume is 1.8 times the average daily trading volume (ADTV) so far in 2023; the repurchase volume is 1.3 times compared with the ADTV so far in 2022. On September 13, most companies entered the repurchase lock window before the financial report, so we expect that the liquidity of the US stock market will be relatively abundant in the short term (before mid-September), and the amount of corporate repurchases will exceed $ 50 B per day.
6. Medium-term outlook
The macro market is in a very complex state. We can only infer short-term market trends based on the currently available information. For the medium term, our judgment will be vague.
6.1 Inflationary pressure still exists
The decline in inflation is mainly due to the sharp decline in oil prices and used car prices, while service inflation, especially housing inflation, remains high. The layoff rate has not increased, and the wage growth rate is even higher than the inflation index. When the Fed cuts interest rates, companies will inevitably speed up financing and expand their business territory, which will be more unfavorable to curbing inflation.

6.2 Change of government increases uncertainty
-
Tariffs – Harriss policies will be more moderate than Trumps, especially in terms of tariffs, which will help reduce global trade disputes. Trumps policy of significantly increasing tariffs will greatly increase the possibility of global trade disputes, especially increasing tariffs on China, which will lead to increased commodity prices, a significant increase in domestic employment, and huge pressure on inflation.
-
Federal Reserve – The short-term impact of the change of leadership on the Federal Reserve is not significant. The president cannot directly influence the independent Federal Reserve in the short term, but if Trump comes to power, he can appoint a friendly chairman when Powells term expires in May 2026, increasing our uncertainty.
-
Deficit – According to the CBOs forecast, the initial deficit rate in 2025 is expected to drop to 3.1% from 3.9% in 2024. However, if Trump is elected, we expect the deficit rate to increase to 4.1% (based on Trumps tariff policy, tax policy, immigration policy, energy policy, etc.). When fiscal stimulus continues to increase, monetary policy will continue to fluctuate in order to maintain the inflation rate. At the same time, it will also increase market concerns about the sustainability of debt, which is very unfavorable for us to judge future market trends.
6.2.1 Bipartisan attitudes towards cryptocurrencies
-
Republican-Trump criticized Bidens anti-cryptocurrency stance, including the expulsion of Bitcoin mining companies and the threat of potential tax increases, and stressed that the government and U.S. Securities and Exchange Commission Chairman Gary opposed the FIT 21 bills regulatory measures as unreasonable.
-
Democratic Party – The Democratic Party has also been increasingly accepting of cryptocurrencies, recognizing the importance of attracting crypto-enthusiast voters in a heated race. Democratic presidential candidate Harris plans to promote the cryptocurrency industry, and at a Bloomberg roundtable at the Democratic National Convention in Chicago, Nelson emphasized Harriss commitment to supporting policies that promote the thriving of emerging technologies. In addition, Harris has begun to engage with cryptocurrency executives to better understand and advocate for the development of the industry.
6.3 About Japanese Yen Carry Trade
The carry risk of the Japanese yen is worth noting. The market expects that the BOJ will resume raising interest rates early next year. Combined with the Feds rate cut, the yen-US bond yield spread will inevitably narrow significantly. However, the specific carry positions and risks cannot be measured now. We prefer to discuss this issue in November.
7. Summary
We believe that whether from the perspective of market sentiment, capital flow, business conditions, fiscal capital flow and monetary policy, our team is bullish in the short and medium term. In the short term, the cryptocurrency market may be affected by the volatility of the US stock market or Nvidias financial report, but it will not change the overall trading logic of the market.
The specific performance of the market next year will depend on changes in political arena, monetary policy, fiscal policy and inflation data.
PART II Crypto on-chain data
Prices are usually the result of the interaction of multiple forces. Some of these forces may not show their effects immediately, and it may take a long time to reflect the results. We have also proposed our own on-chain analysis framework, which covers liquidity, holding period and average cost.
1. Liquidity
1.1 On-chain stablecoin value
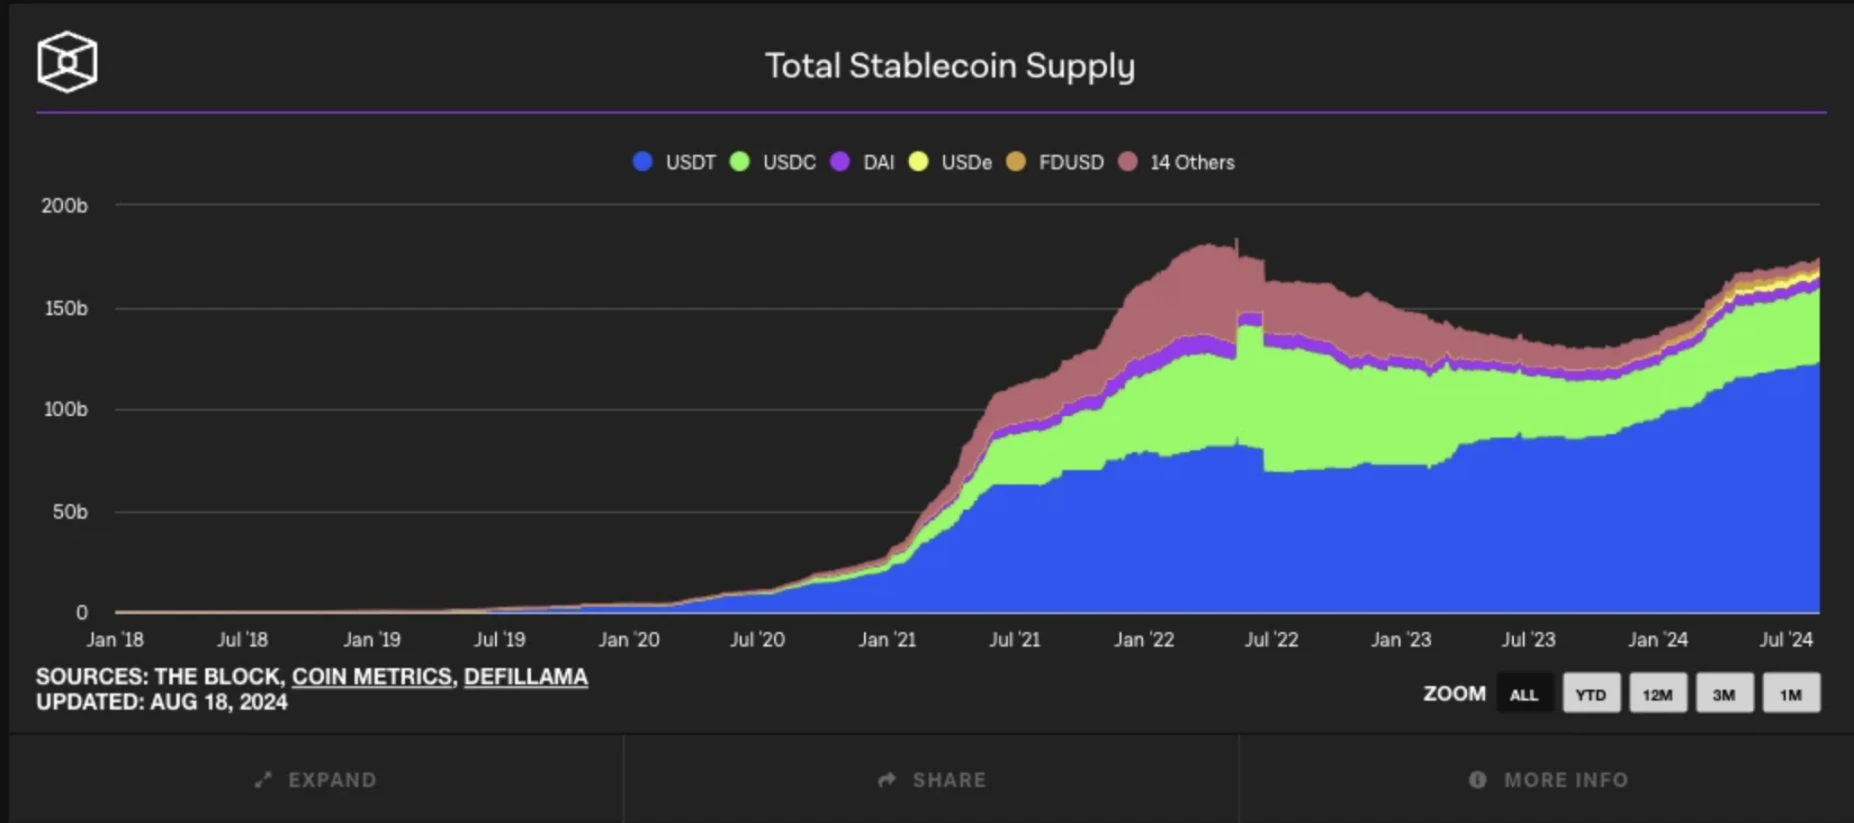
The issuance of on-chain stablecoins is highly correlated with the market. The supply of stablecoins has increased significantly in the past few years, especially from 2020 to 2021. The rapid growth of stablecoins during this period is closely related to the prosperity of the global cryptocurrency market.

After entering 2024, the issuance of stablecoins has slowed down, but it still maintains an overall growth trend. As can be seen from the chart, compared with the rapid expansion in previous years, the growth rate of stablecoin supply in 2024 has slowed down significantly, and the curve has flattened. This shows that although the market demand for stablecoins still exists, compared with the explosive growth in previous years, the market is gradually entering a more mature and stable stage.
The recent supply of stablecoins has re-entered the issuance phase after slowing down, and has set a new high in this round of rising cycle. Overall, the stablecoin market in 2024 is still in a growth trend, and it should also have a corresponding boost to the sluggish market.
1.2 ETF Data
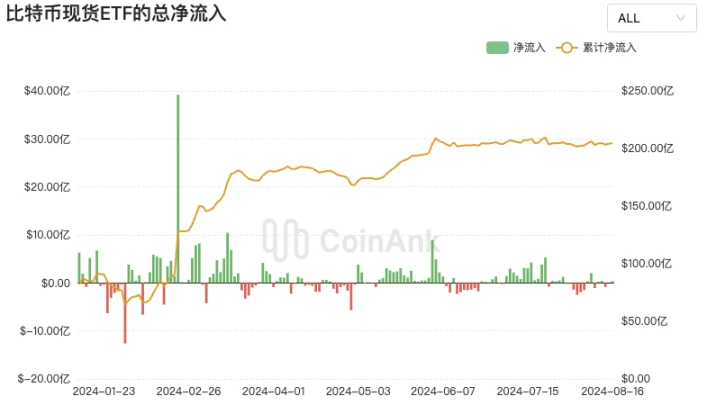
From the beginning of the year to the beginning of March, the cumulative net inflow rose rapidly, indicating that the market demand for Bitcoin spot ETFs was strong. However, as time went on, especially after May, the funds flowing into the market decreased, and the cumulative net inflow began to stabilize, maintaining at around US$20 billion, failing to reproduce the previous growth momentum. We can see that although there are occasional large-scale inflows, the overall net inflow has decreased since May, accompanied by some net outflows. This further proves the change in market sentiment, from active buying to more wait-and-see and cautious, and the effect of spot ETF in bringing in new funds has also weakened.
2.HOLD Wave
2.1 BTC: Realized Cap HODL Waves
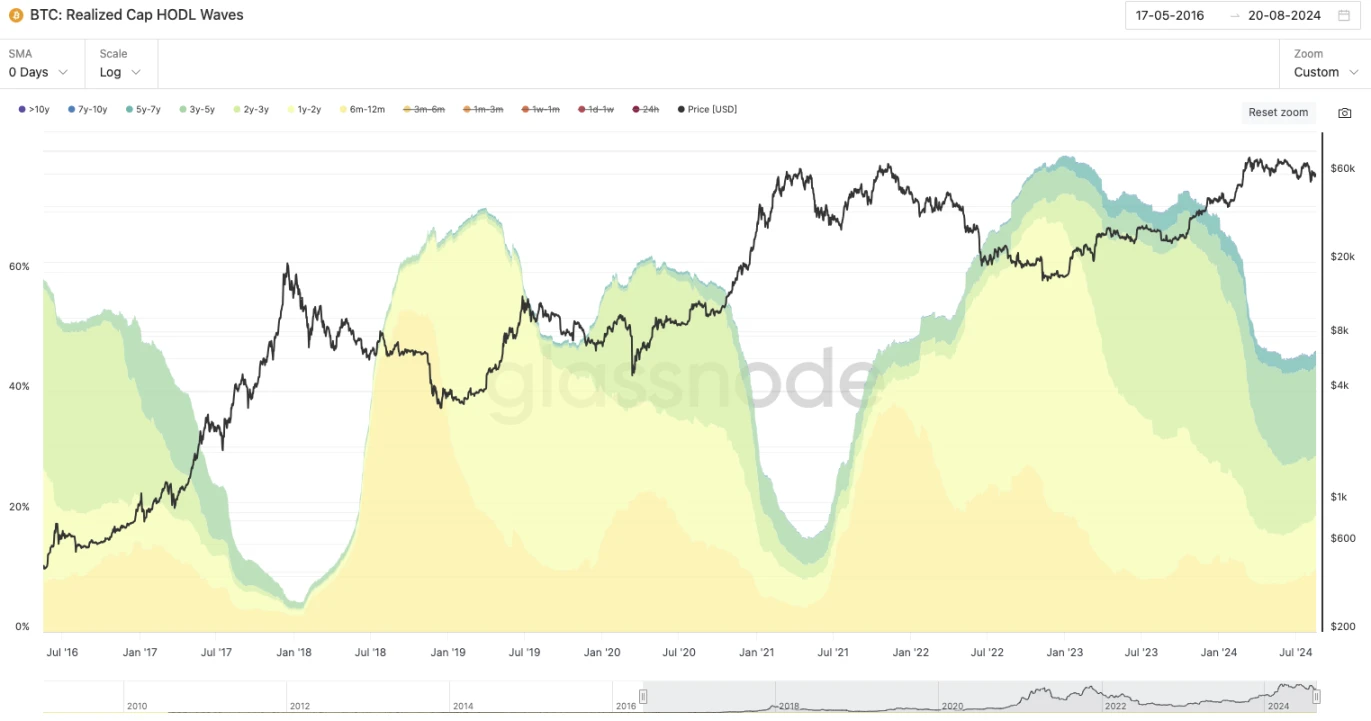
Bitcoin’s Realized Cap HODL Waves , used to analyze holding time and maturity in the market.
The entity part of the graph below represents the percentage of holders who have held the coins for more than 6 months. As of August 20, the total percentage of holders who have held the coins for more than 6 months is 47.097% , which means that nearly half of the Bitcoin in the market is in the hands of long-term holders. In the previous two bull markets, this value was below 20% at the top of the rise.
This means that the current on-chain situation is that the proportion of long-term holders is still high, which shows that despite price fluctuations, many investors choose to continue holding Bitcoin rather than selling.
2.2 Trend Accumulation Score

Swinging between selling and holding, the current status is returning to the HOLD cycle.
This chart shows how the Trend Accumulation Score of Bitcoin holding groups of different sizes changes over time. The bluer the color, the more on-chain holders tend to hold or buy, and the redder the color, the more investors tend to sell.
After the selling pressure some time ago, both large and small holders tend to hold their coins.
2.3 Bitcoin: Long/Short-Term Holder Supply Ratio
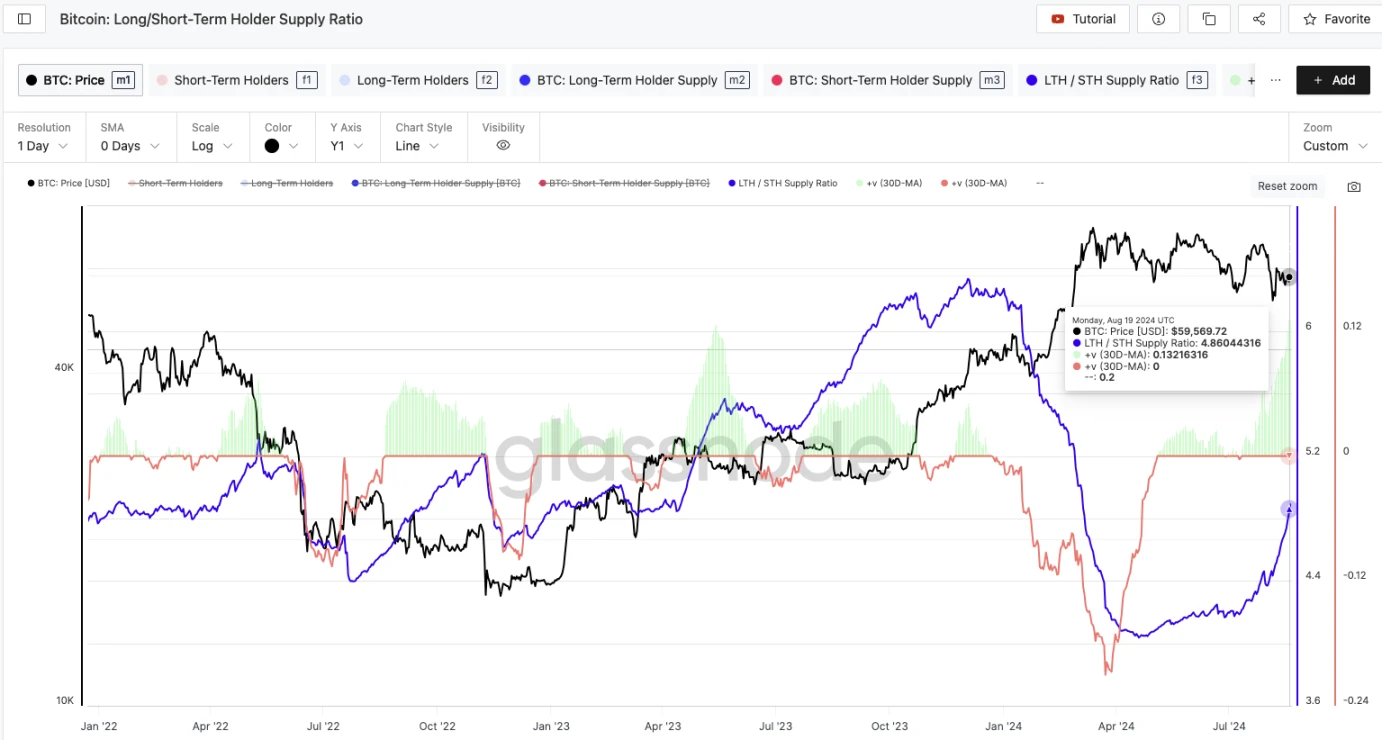
This chart shows how the supply ratio of Bitcoin to long-term holders (LTH) and short-term holders (STH) changes over time.
It should be noted that the holding period for long-term and short-term holders is 155 days, with a 10-day buffer period.
The current LTH/STH supply ratio is 4.8604, and there is a clear upward signal, up 13% from the 30-day average (visible in the green bar chart).
3. Holding costs
3.1 Bitcoin: Realized Price-to-Liveliness Ratio

-
Blue line: Realized Price. The blue line represents the “realized price”, which is the average holding price of all bitcoins on the chain (based on BTC transfer data).
-
Orange line: Realized Price-to-Liveliness Ratio (RPLR), the orange line represents the Realized Price-to-Liveliness Ratio, which is an indicator that combines the realized price and Bitcoin holding behavior. It adjusts the realized price by comparing Bitcoins activity (that is, the time Bitcoin is held or spent) to estimate Bitcoins active address holding cost.
The current value: As of August 11, the on-chain coin holding cost is (31.3k; the on-chain active address holding cost is ) 51.3k.
Current market prices are above these cost prices.
3.2 Bitcoin: Pi Cycle Top Indicator

This indicator is composed of 350 DMA* 2 and 111 DMA. 350 MA refers to the 350-day moving average, which is used to calculate the average closing price in the past 350 days.
In every bull market in history, the 111 DMA crosses the 350 DMA* 2, which means the short-term moving average crosses the 2 x long-term moving average. The intersection of the two moving averages is often the top range. Currently, there is still a gap between the two moving averages. Currently:
-
350 DMAX 2: $102,579
-
111 DMA: $63,742
3.3 Market Cap BTC Dominance
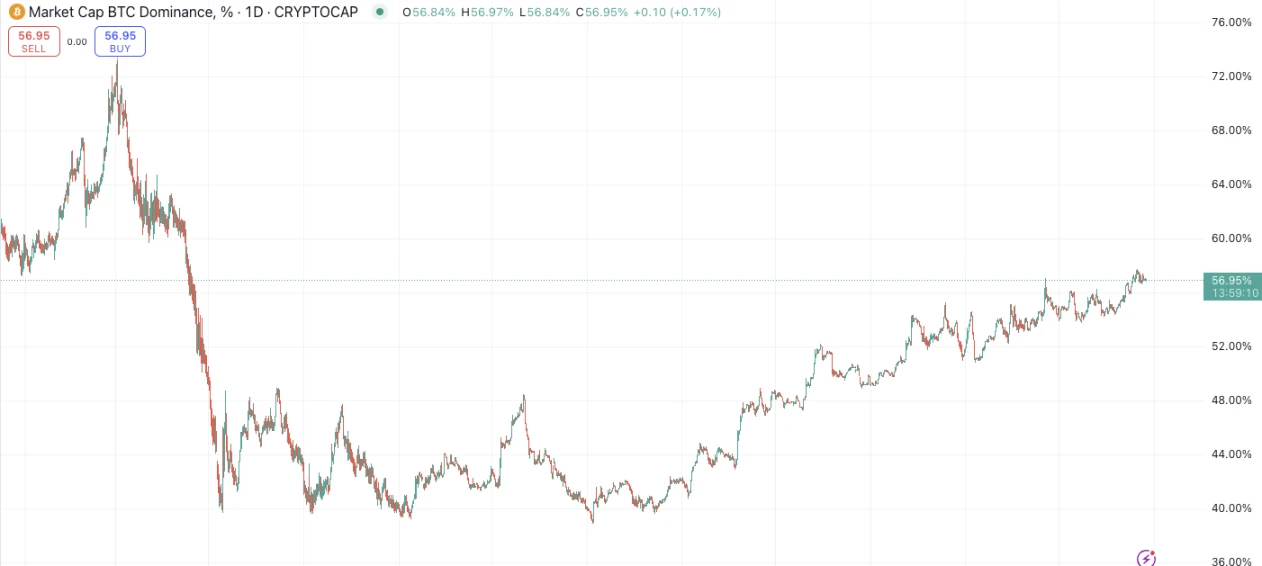
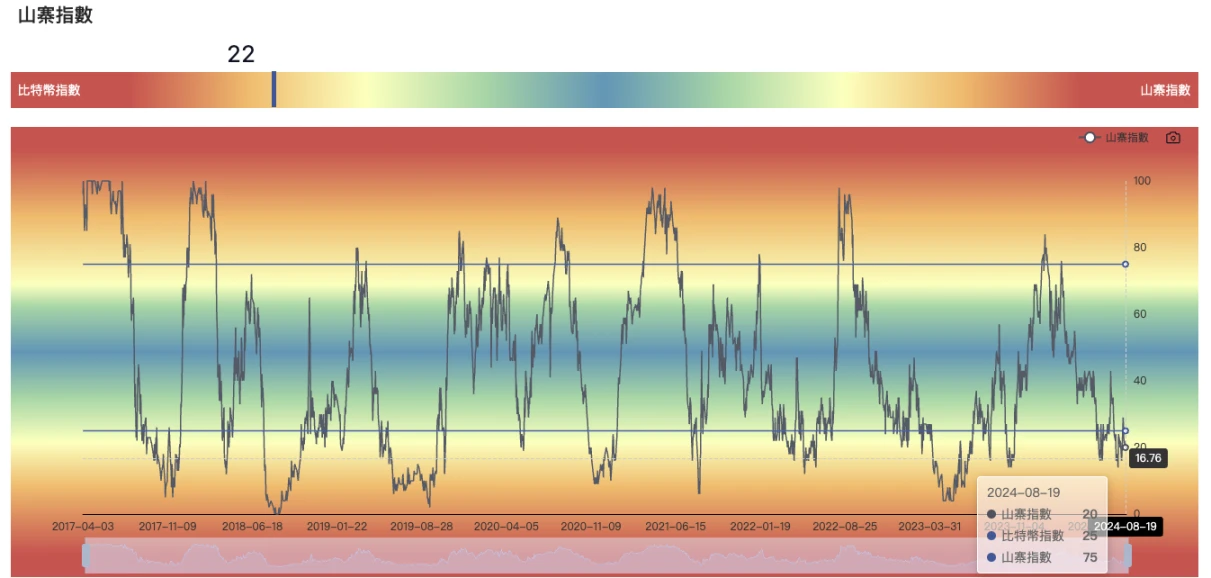
This round of BTC.D index is continuing to rise, and there is usually BTC liquidity overflow in the middle and late stages of each bull market. However, judging from BTC.D, there is currently no BTC capital inflow into Altcoins.

Altcoin may explode at:
4. Summary
Amid challenging and volatile market conditions, long-term Bitcoin holders remain steadfast, with evidence of increasing accumulation behavior. This cohort of investors holds a higher percentage of Bitcoin network wealth than at the peak of the previous cycle, demonstrating investor patience as they wait for prices to rise. Furthermore, despite the largest price contraction of the cycle, these investors have not panic-sold, highlighting the resilience of their overall conviction.
At the same time, the stablecoin supply chain is still sufficient. Although the inflow of external funds has slowed down, the current price is still higher than the average holding cost on the chain, and the holding structure is also very healthy. At this stage, BTCs liquidity has the momentum to overflow, and the Altcoin season has not yet arrived.
Overall, we remain positive and bullish on the market outlook.
This article is sourced from the internet: PSE Trading: Macro and data analysis reveals a positive outlook
Related: After TON landed on Binance, how to find potential projects in the TON ecosystem?
TON has finally landed on Binance. From now on, the TON ecosystem has the largest liquidity pool in the market as the value support of the ecosystem. However, if we look at the overall situation of the TON ecosystem, it is still an ecosystem that is hot outside but in its early stages. It is difficult to find potential project targets in such an ecosystem, and we cannot look for swords on the boats or follow the map. Abandoning the complicated way, if we follow the simplest selection logic of attention economy, in this article, we will try to find potential projects through the open league of the TON ecosystem, or use it to find the growth inertia of this early ecosystem. Basic Background of TON The TON ecosystem started…


