Task
Ranking
已登录
Bee登录
Twitter 授权
TG 授权
Discord 授权
去签到
下一页
关闭
获取登录状态
My XP
0
मूल लेखक: Digital Asset Research
Original translation: Peisen, BlockBeats
Editors note: Digital Asset Research shows the high probability of major events or news from August 6 to 12 through detailed data on time range, price range, and time angle. The article also compares the current market cycle with previous cycles, points out the time pattern of market trend changes, and provides sufficient evidence by combining monthly and weekly chart analysis.
This is something I have discussed publicly for some time, but today I wanted to reaffirm that the evidence shows that there may be a very significant trend and sentiment shift in BTC and the broader cryptocurrency market between August 6th and 12th.
I first mentioned this time period a few months ago in a video outlook, which you can find here.
Today Im going to show all the evidence that Ive built up step by step based on the time frame, the price range, and the time perspective. I think youre going to see a high probability of a major event or news happening within this time window.
We will start with the monthly chart and work our way down to the daily chart to show the convergence of multiple factors we are seeing.
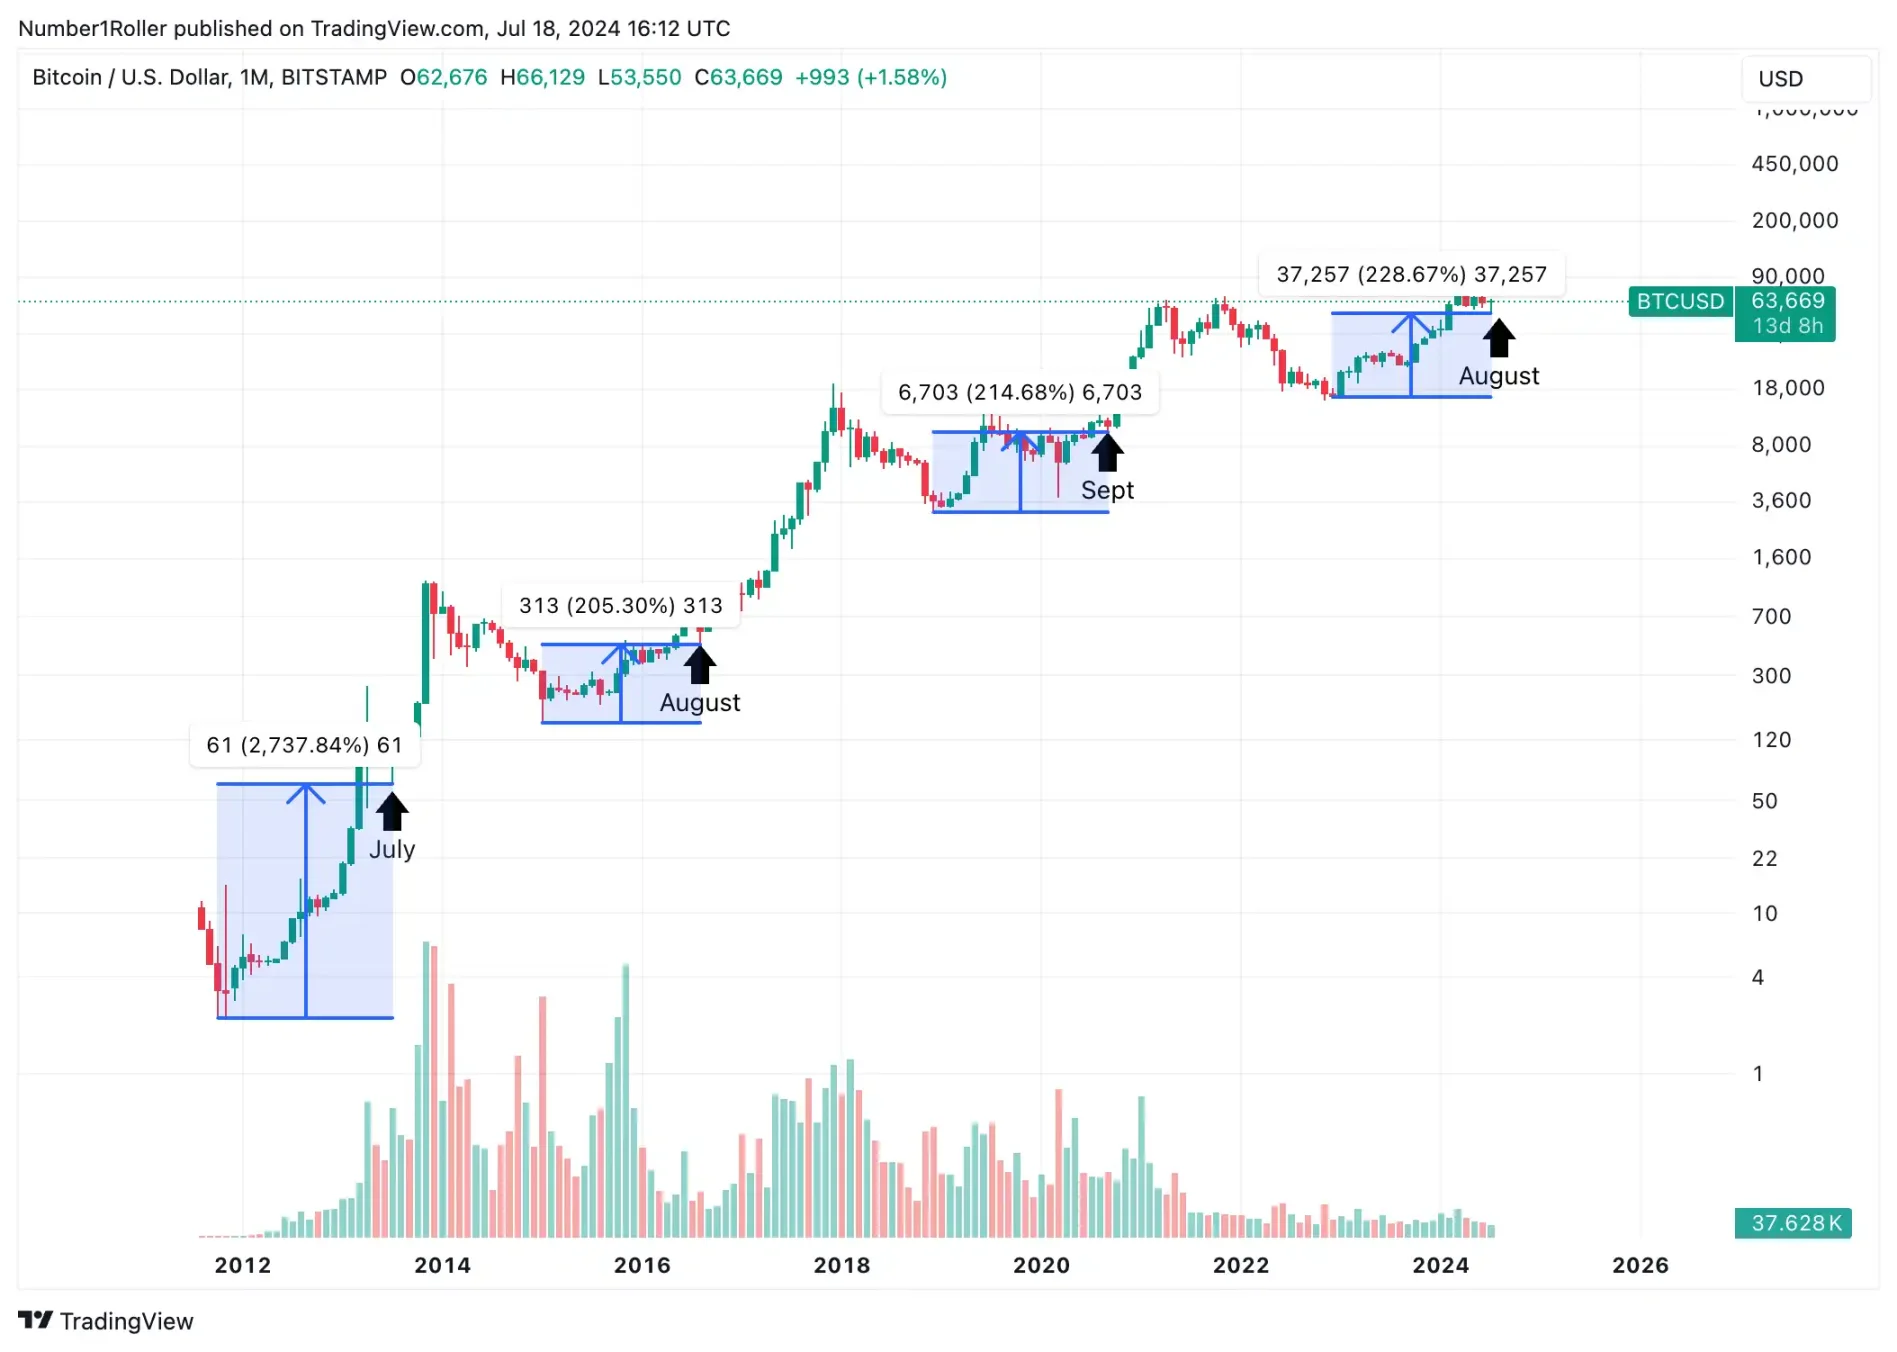
The monthly chart is what we focused on last week, but to further prove that we are in the same cycle, we have also added the months of the previous tops. As you can see, the previous two cycles are almost identical to the current cycle. 33 months from the major high and 20 months from the major low both put us in this time period from July to September, which was the last low before the big rise.

Now we know that time is on our side, but many believe this cycle is different because prices are reaching new all-time highs so quickly. But lets compare the current cycle to the previous ones on the monthly chart.
The evidence is pretty stunning. As you can see, with the exception of 2012, the previous two cycles saw prices rise just over 200% from the bear market low, right in the timeframe we are in now. You can see that this time is no different. In fact, time and price are exactly where they should be, neither overextended nor over-expected as some commentators have suggested.
Moving on to the weekly chart, there is more to discuss. First, we see that there is a major trend change every 30 weeks in this cycle. But what is interesting is that these 30 week cycles are right between a major low and a major high, occurring at the same time. I will explain why in the next few charts, but for now, the next 30 week cycle is right in the week of August 12th. These three 30 week cycles add up to a total of 90 weeks from the bear market low.

Furthermore, zooming in a little more on the weekly chart, I notice that from the 2017 high to the first significant high in 2021 is 174 weeks. August 12th will be 174 weeks from that significant high in April 2021, which is undoubtedly a significant high. Therefore, we are approaching the same time period between the two significant inflection points, the 2017 high and the April 2021 high.

Now, based on the evidence we have, this market is at a different stage, and it seems to me that the inflection point is more likely to come in the form of a major low than a major high. But as I have been saying, in these cycles, we tend to see a major high and low at the same time in this time window.
The chart below shows this particular period in each cycle, as well as what it was like last year at this time in this cycle. As you can see, there is almost always a sharp rise in August, followed by a rapid fall, which can be as much as 20-50%. Last year is different from the other three charts because it was only the second year of the cycle, but it shows the seasonality of this type of move happening in August.

It also shows that during this cycle, the market made significant highs and lows around the 30-week inflection point, with a relatively tight time window.
Now lets look at it from a time perspective. In simple terms, a time perspective is counting 30 calendar days from a significant high or low and looking for a trend change. You simply start at 30 and count 30, 60, 90, 120, 150, 180, etc. and look for a trend change at those time points. The closer the time points are, the more important that day or week is.
As the chart below shows, all of these time measurements fall within a time angle window. In this cycle, we have several major highs and lows that all point to the second week of August being a major convergence period.

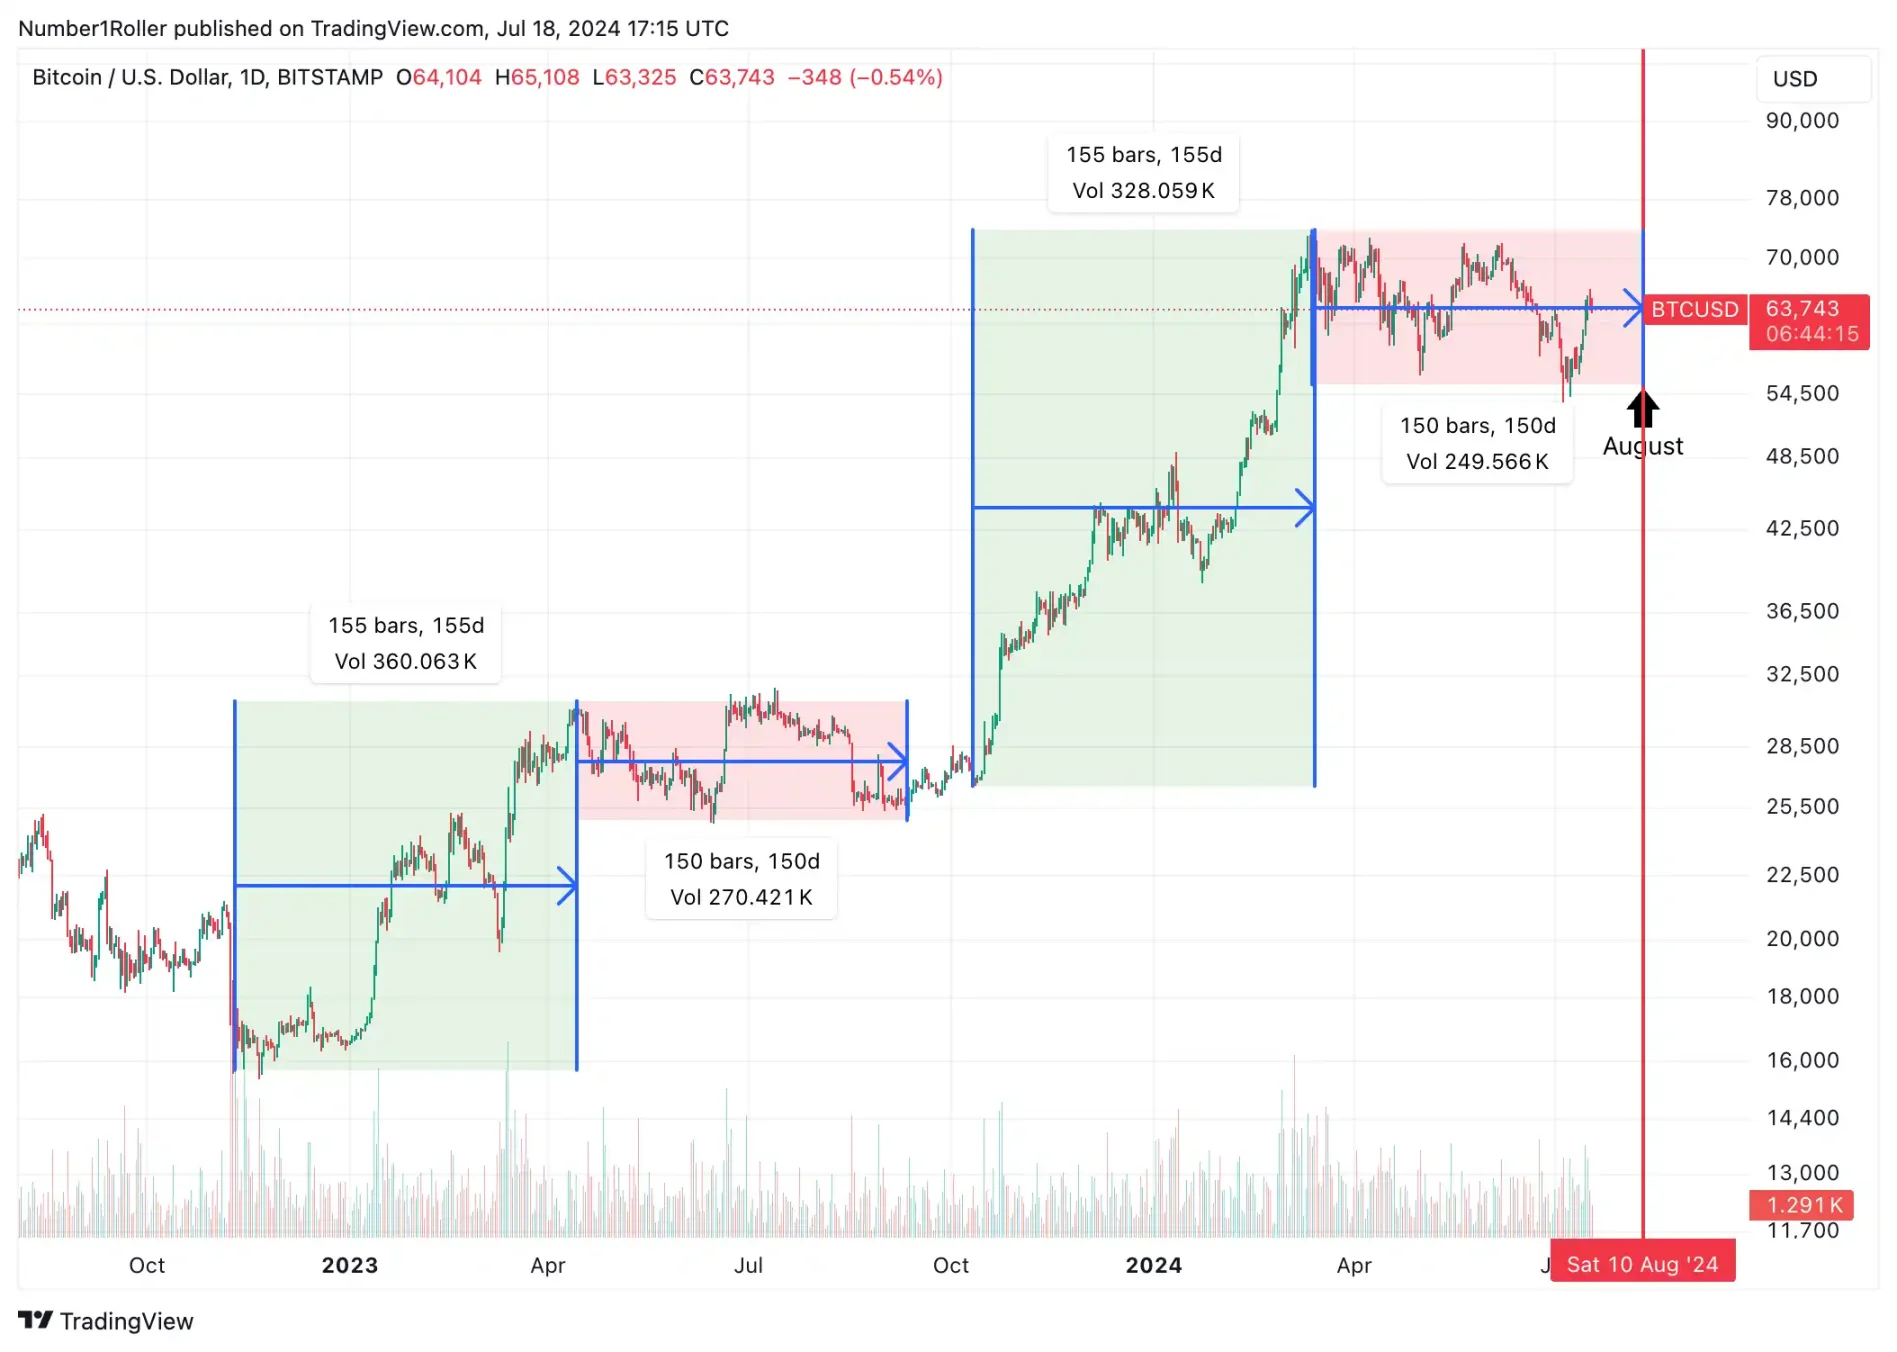
Finally, from a timeframe perspective, the market has been following a 150-day cycle pattern in this cycle: 155 days of ups and 150 days of sideways. It is important to note that the balance of market time should not be imbalanced. That is, the number of days the market is down should not be more than the number of days it is up. In a bull market, the market will usually be up for longer than it is down, as shown in the chart below. If the market is down for more days than the previous 150 days and a new low is made, this will not be a good sign.
Finally, taking into account the price range, time frame, time angle and seasonality, we are approaching a mid-August window that is likely to be a trigger point for BTC. If this is not enough evidence, note that the start date of the BTC chart is August 19th. I wont go into this too much, but birth dates are important and August is usually the month when major bull runs begin.
This is why I am being cautious here and waiting for this window to end before taking more aggressive action. Will we see the ETH ETF finally start trading followed by a rapid decline like the BTC ETF? Or will we see more political headlines causing uncertainty around the election? I鈥檓 not entirely sure what it will be, but this is definitely a period to watch and remain patient.
This article is sourced from the internet: Market trend interpretation: August may become a major turning point for the crypto market
Related: Three key words in the first half of 2024: GameFi, BTC second-layer network and DePin
In the first half of 2024, the cryptocurrency market showed a diversified development trend, among which Gamefi, Bitcoin Layer 2 network (Layer 2) and decentralized physical infrastructure (DePIN) performed particularly well. As the most mature sector, Gamefi is vulnerable to market fluctuations, but the continued prosperity of its ecosystem provides strong support for the application and implementation of cryptocurrencies in daily life. Although Bitcoin Layer 2 is a latecomer, it has a rapid development momentum. Layer 2 solutions represented by the Lightning Network have been continuously deepened and improved, significantly improving transaction efficiency and network throughput, and effectively solving the expansion problem of the Bitcoin mainnet. The DePIN sector shows a high degree of integration with the real world. By introducing the concept of decentralization into traditional physical infrastructure, DePIN…


