Ethereum (ETH) presently attempts to stay above the crucial technical and psychological support of $3,000.
This will more than likely be possible only when the ETH holders opt to pull away from selling and HODL, which happens to be the case.
Ethereum Investors Move to HODL
Ethereum’s price trading at $3,177 is hovering above the $3,000 support floor, with ETH holders now exhibiting more bullishness than before. Signs of this resilience are visible in the supply shift and behavior change.
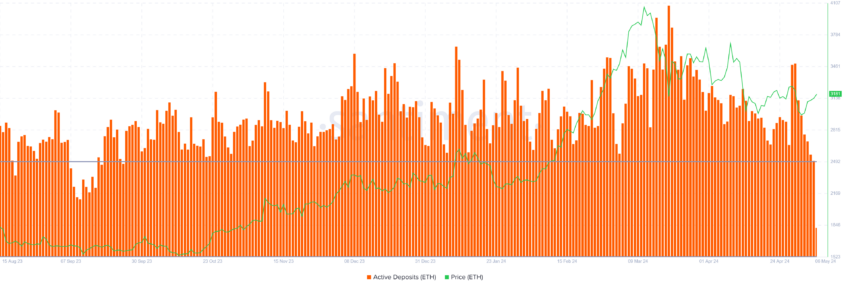
The deposits observed on-chain have noted a drawdown of 27% in the past week, which is a positive signal.
Active Deposits highlight the unique addresses that are moving their supply from their wallets to exchanges. This decline has brought potential selling down to an eight-month low, with the last such low instance noted in September 2023.

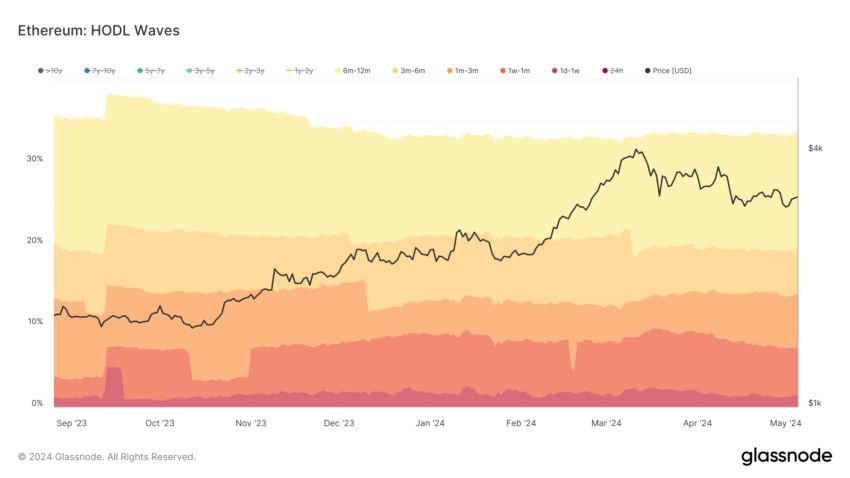
Furthermore, the HODLing of ETH has also grown, with the supply moving from short-term to mid-term holders. HODL waves show that wallets holding ETH for one month to a year have noted a 2.3% increase in their supply over the past month.
Moreover, addresses holding ETH for a period of one week to a month have witnessed outflows amounting to 2.2% of the circulating ETH supply. This is evidence that the ETH has moved from potential sellers to HODLers, who tend to avoid immediate dumping.
This decline in short-term holders’ dominance proves that investors’ conviction is noting a considerable increase.
Lire la suite : Ethereum ETF expliqué : qu'est-ce que c'est et comment ça marche

ETH Price Prediction: $3,000 Holds
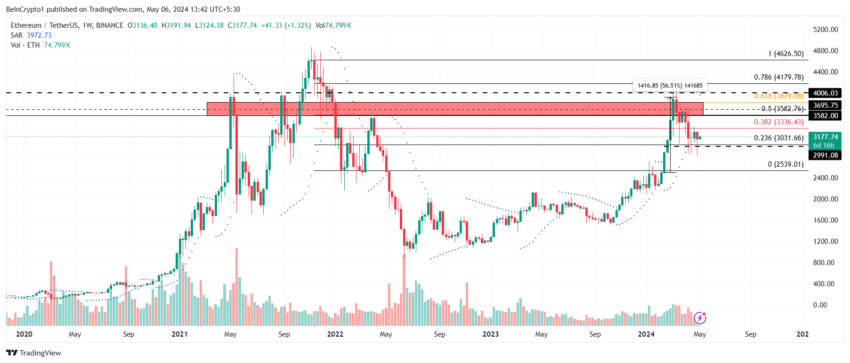
Ethereum’s price is hovering above the key support level of $3,000, coinciding with the 23.6% Fibonacci Retracement. The 23.6% Fib level is known to be the critical support level, and losing it diminishes the potential for recovery. Thus, keeping above $3,000 is crucial for ETH, and it is the probable outcome given the support of its investors.
If the bullishness sustains, Ethereum’s price could breach the 38.2% Fib level. Securing this support would enable ETH to attempt to breach the resistance block between $3,582 and $3,829.
Read More: Ethereum (ETH) Price Prediction 2024 / 2025 / 2030

However, if the support of $3,000 is lost, ETH will most likely witness a correction to 2,539. This decline would invalidate the bullish thesis and extend investors’ losses.


