Task
Ranking
已登录
Bee登录
Twitter 授权
TG 授权
Discord 授权
去签到
下一页
关闭
获取登录状态
My XP
0
Onyxcoin (XCN) was one of the best-performing altcoins in January, with its market cap soaring from $70 million on January 1 to $1 billion by January 26. However, it’s down 23% in the last 30 days.
The Relative Strength Index (RSI) has dropped to 42, and the Average Directional Index (ADX) indicates a fading downtrend, signaling a potential consolidation phase. If XCN loses its key support at $0.0145, it could drop as low as $0.0075, but a bullish reversal could see it testing resistances at $0.0229, $0.033, and even $0.040.
Onyxcoin’s RSI is currently at 42, down from 52.6 two days ago, after previously rising from 29.2.
The Relative Strength Index (RSI) is a momentum oscillator that measures the speed and change of price movements. It ranges from 0 to 100, with values above 70 indicating overbought conditions and potential for a price pullback, while values below 30 suggest oversold conditions and potential for a rebound.
An RSI between 30 and 70 typically indicates a neutral trend with no strong directional bias.
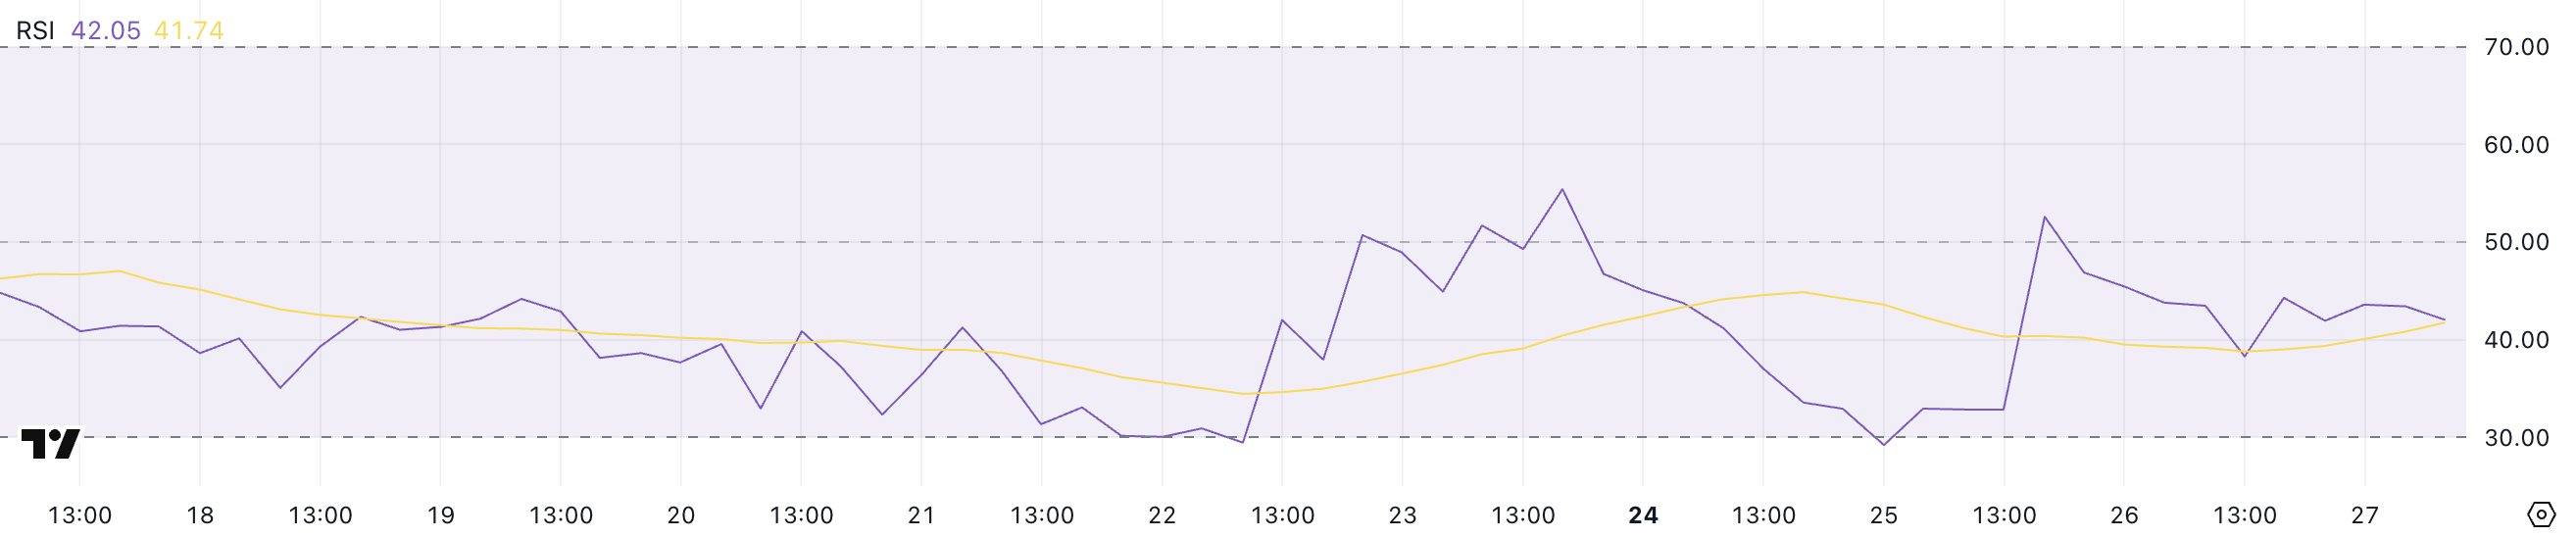
XCN’s RSI has struggled to break above 60 since January 30, indicating a lack of strong bullish momentum.
The recent drop from 52.6 to 42 suggests that buying pressure is weakening, potentially signaling further downside if the RSI continues to decline. This decrease reflects fading bullish sentiment, making the altcoin vulnerable to continued selling pressure.
If the RSI fails to recover above 50 soon, it could confirm a bearish trend, potentially leading to further price declines.
Onyxcoin’s ADX is currently at 15.6, down from 24.2 two days ago. The Average Directional Index (ADX) is a trend strength indicator that measures the intensity of a trend without indicating its direction.
It goes from 0 to 100, with values above 25 signaling a strong trend and values below 20 indicating a weak or non-trending market.
An ADX below 20 suggests that price movements are likely to be sideways or lack momentum.
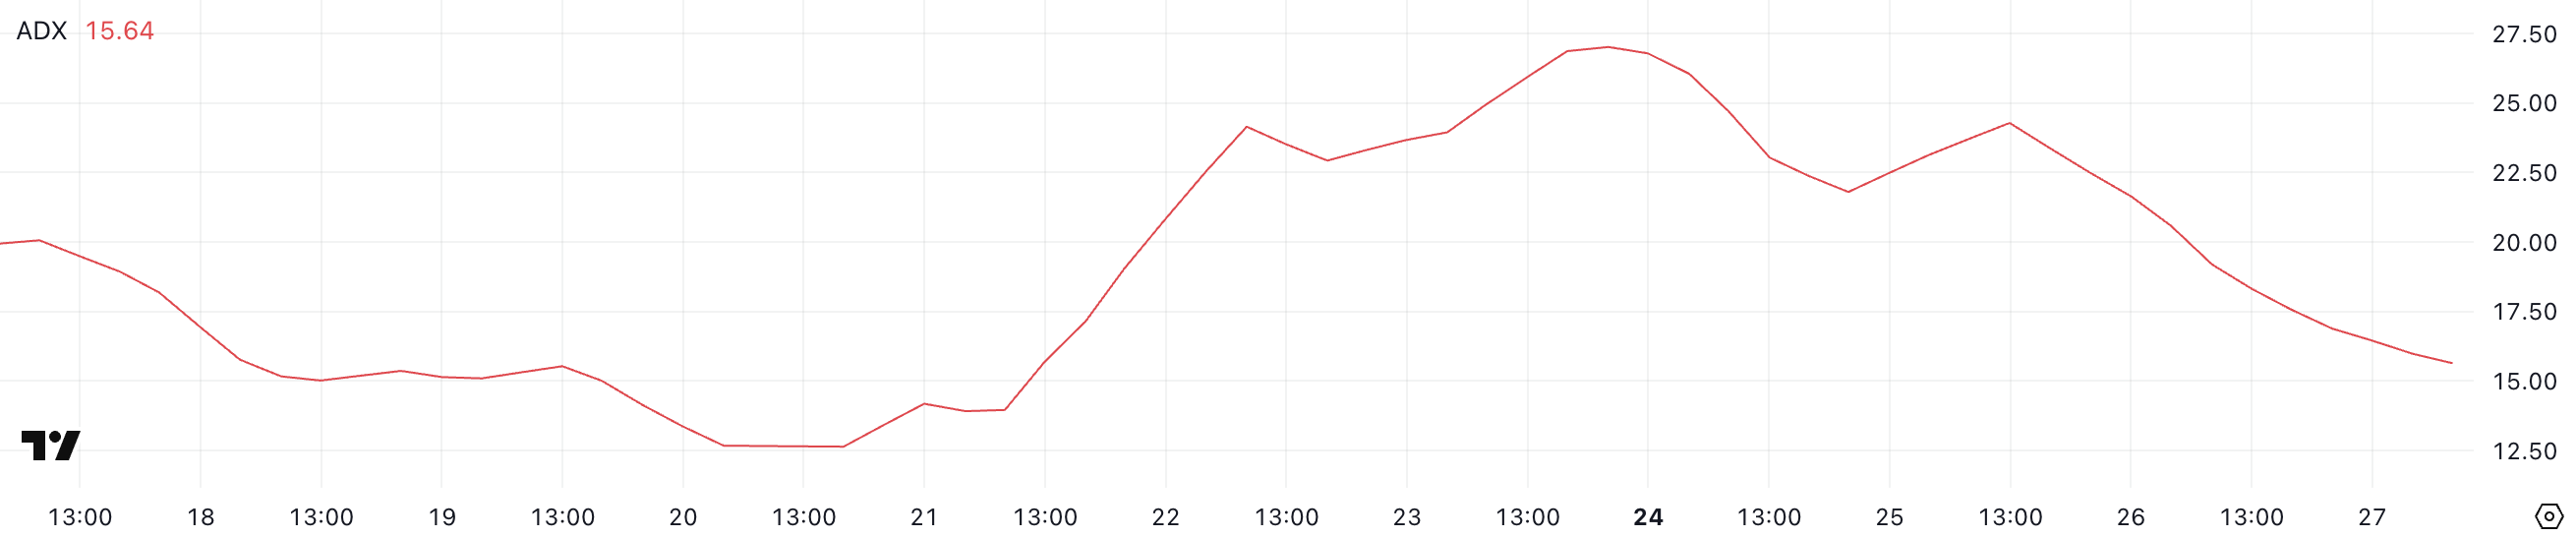
XCN’s ADX dropping to 15.6 suggests a weakening trend, indicating that the current downtrend is losing momentum.
In a downtrend, a declining ADX reflects reduced selling pressure and market indecision, increasing the likelihood of price consolidation or sideways movement.
However, without a rise in ADX or a directional shift, XCN is unlikely to see a significant price reversal soon. If the ADX remains below 20, the price could continue to drift without a clear direction.
The combination of a fading downtrend and a dropping RSI suggests that the altcoin could be entering a consolidation phase.
Currently, it has a close support of around $0.0145, which, if tested and lost, could lead to a decline toward $0.0075.

On the other hand, if an uptrend emerges, XCN could rise to test the $0.0229 resistance level. If this is broken, and Onyxcoin recovers the positive momentum seen in previous months, it could continue to rally, testing $0.033 or even $0.040.
This would represent a potential 154% upside from current levels. However, for this bullish scenario to play out, XCN would need to regain strong buying momentum and maintain it through key resistance zones.
Cet article provient d'Internet : Onyxcoin (XCN) Drops 50% in February After its Parabolic Rally: What’s Next?
1. Bitcoin market and mining data From February 10 to February 16, 2025, the price trend of Bitcoin is as follows: From February 10 to February 16, Bitcoin showed an overall volatile trend, with multiple highs and lows. The opening price on February 10 was $96,469, and it dropped to $94,896 during the session before rebounding to a high of $98,077. The upward trend continued on February 11, rising to a high of $98,442 before quickly falling back and dropping to $94,940 in the morning of the 12th, and the market entered an adjustment period. On February 12, the price fluctuated between $94,730 and $96,400, and fell to an intraday low of $94,737 in the evening. After opening on February 13, it quickly rose to $98,062, and then fell back…