Who is actually making money in the infrastructure sector with overcapacity?
Infrastructure seems to be an eternal topic in Crypto.
Although Infra is not as direct to users as DeFi and other applications, it always gets the support of top institutions behind the scenes. From Crypto Native to Old Money, starting a business with infrastructure as a support seems to have become a stable business. The track is stable, the model is worthy of reference, and you can collect rent without losing money. Believers in technology and resource tycoons do not seem to want to get involved in high-risk Mass Adoption. More and more high FDV projects are emerging like factory copy and paste.
In the end, the speculators dream of a hundred times return and the valuation bubble of the project were ruthlessly punctured by the market. VC coins became a rat crossing the street that everyone wanted to beat overnight. The endless infrastructure brought the ultimate question to the industry: Do we really need so much infrastructure? With this question, this article selects mainstream projects in the field of Crypto infrastructure as representatives to analyze their operating conditions, giving readers a perspective to judge whether the current market infrastructure should be cleared.
BlockBeats Note: There is no clear regulation in the Crypto market, so unlike traditional listed companies, project owners are not obliged to fully disclose their specific performance. Among them, the sources of income for project owners include wallet transfers, off-chain income, and token sales. Therefore, this article will use the publicly disclosed on-chain data that can be collected as the main reference and evaluation basis.
Oracle
Oracles can not only be used in Crypto to provide quotes for various dapps and fill the information gap between on-chain and off-chain, but also serve traditional financial products such as bonds and credit default swaps. At the same time, in Crypto where regulatory compliance has not yet been fully followed up, we cannot obtain complete revenue information after third-party audits through existing channels, and can only obtain data through public channels on the chain for analysis.
In the oracle track, TVS (Total Value Secured) is usually used as a key measurement indicator. According to DefiLlama data, Chanlink still maintains its kingly style, with a market share of 44% in the total TVS, which is monopolistic. The TVS market share of the other top 5 protocols is WINKlink (15%), Chronicle (13.59%), Pyth (8.95%), and Swithboard (3.88%). However, WNLink and Chronicle are mainly used in the TRON ecosystem and MakerDAO respectively, and both rely on their own big trees for shade and do not have widespread market applications. Therefore, Chainlink and Pyth were selected as analysis objects in the oracle field.
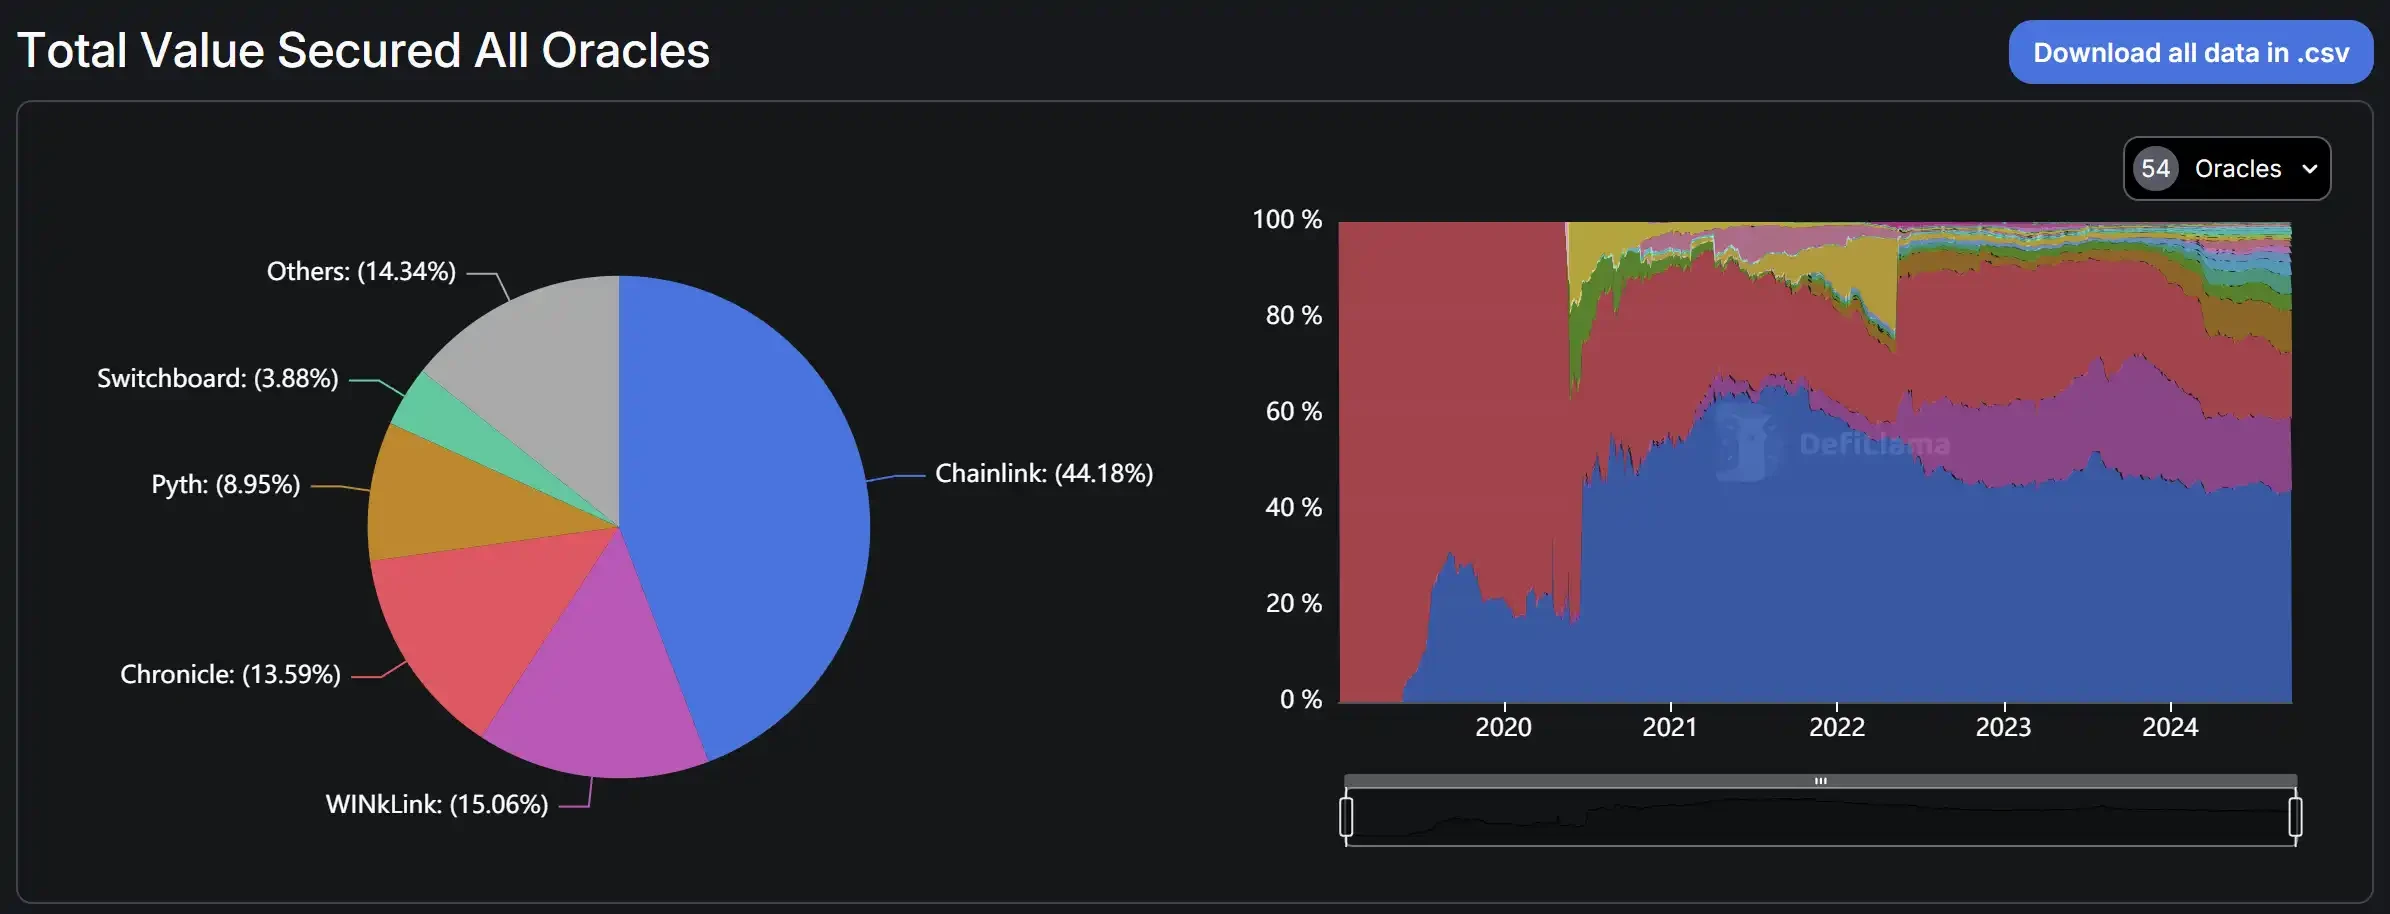
TVS ratio of oracle, data source: DefiLlama
Chainlink
As an old oracle project, Chainlinks main businesses include data feeds, CCIP, VRF, contract automation (keepers), etc. Its market share has remained at this level since it broke through 40% in 2020, and it has maintained an absolute monopoly in the market. Its business not only covers on-chain, but also includes cooperation with off-chain entities, such as SWIFT, Google Cloud, etc. The market application scope and scale of Chainlink are temporarily unmatched by other oracle protocols or even other infrastructure projects. In terms of specific business share, AAVE V3 accounts for 51% of Chainlink TVS, the largest share and a total TVL of 11.4 billion. The bottom four are Spark, Venus Core Pool, Compound V3 and Eigenpie.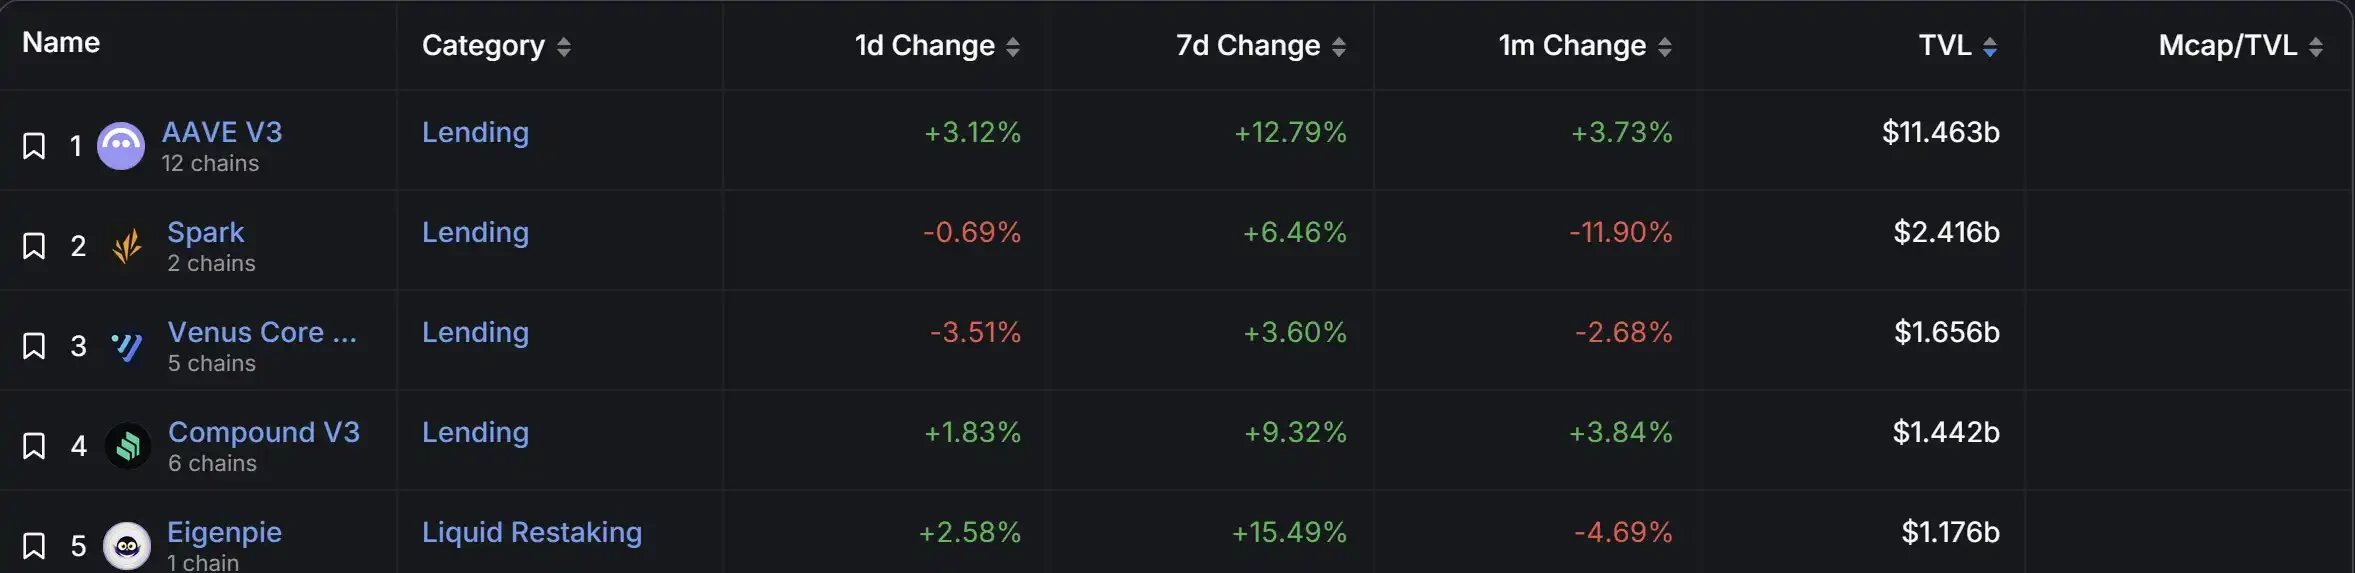
Chainlink TVL distribution, data source: DefiLlama
According to Dune data, Chainlinks monthly revenue has remained at around $4 million since entering the bear market cycle in September 2022. In this cycle, Chainlinks overall on-chain revenue has not returned to the level of the 2021 bull market, barely reaching $4.7 million at the peak of the mini-bull market in March this year.
It is worth noting that AAVE, as Chainlinks largest revenue contributor, has repeatedly set new highs in protocol fee revenue this year, and its overall performance is close to the level of the previous bull market. At the same time, since the end of 2023, AAVEs daily active users have continued to grow, and it is not affected even when the market cools down. However, Chainlinks revenue has not been significantly improved as a result.
In terms of revenue share, Ethereum dominated the last cycle, contributing more than 60% of revenue. Since the rise of various L2s, the phenomenon of Ethereum being too big to fail in Chainlink has been alleviated, and its share has gradually declined. The share of emerging L2s represented by Optimism and Arbtrium has increased significantly. On the one hand, Chainlinks revenue sources are more dispersed and diversified, but on the other hand, it also reflects the fragmentation of ecological liquidity brought about by L2.

Chainlink鈥檚 revenue sources and proportions, data source: Dune
CCIP, Chainlinks flagship product for entering the cross-chain track, was officially released in July 23. Chainlink supports almost all mainstream public chains and protocols on the market, and has first-hand data information. CCIPs business integration can be said to be timely, local and human.
According to Dune data, CCIP uses Cross-chain fees as its main source of business income, and is mainly contributed by mainstream L2s such as Arbitrum, Base, and Optimism. Cross-chain income depends largely on the markets prosperity and is sensitive to market reactions. In March of this year, its cross-chain income peaked at about $258,000 under the favorable catalysis of the approval of BTC ETF. After the on-chain market cooled, Q2 revenue decreased by 30%, and reached an extreme freezing point in the Q3 market. Revenue fell again by 70% and finally remained at $25,000 per month.

Cross-chain fees and sources, data source: Dune
In terms of token performance, its native token $LINK did not have any value capture function before the update, and with the continuous release of node rewards, the prglace of $LINK will only continue to be diluted at the micro level. Since the release of Jeton Economics 2.0 in 2022, the practicality of its tokens has changed, mainly reflected in the staking function of $LINK. In Staking 1.0, only the community and node operators are allowed to stake tokens. After the release of version 2.0, not only the scale of staking has been expanded, but also the staking threshold has been lowered and the unstaking mechanism has been opened. At present, the circulation of $LINK is about 60%. Although it has not been fully unlocked, the token price of $LINK has performed well in this bull market thanks to its staking mechanism.
Python
As a rising star, Pyth Network adopts a pull price feed service that is different from traditional oracles, improving the previous push-type service to on-demand access. DeFi protocols can enjoy Pyths price feed service by developing corresponding contracts, saving more time and développement costs to polish their own products. With its simple service model and the support of the Solana ecosystem, Pyth has become Solanas largest oracle protocol.
According to DefiLlama data, Pyths business is concentrated in Kamino Lend, with a TVL of US$1.32 billion, accounting for about 30% of the total TVS. At the same time, Pyths total TVS is increasing over time. This years total TVS is more than doubled from the high point in 2022, and its development scale is still expanding.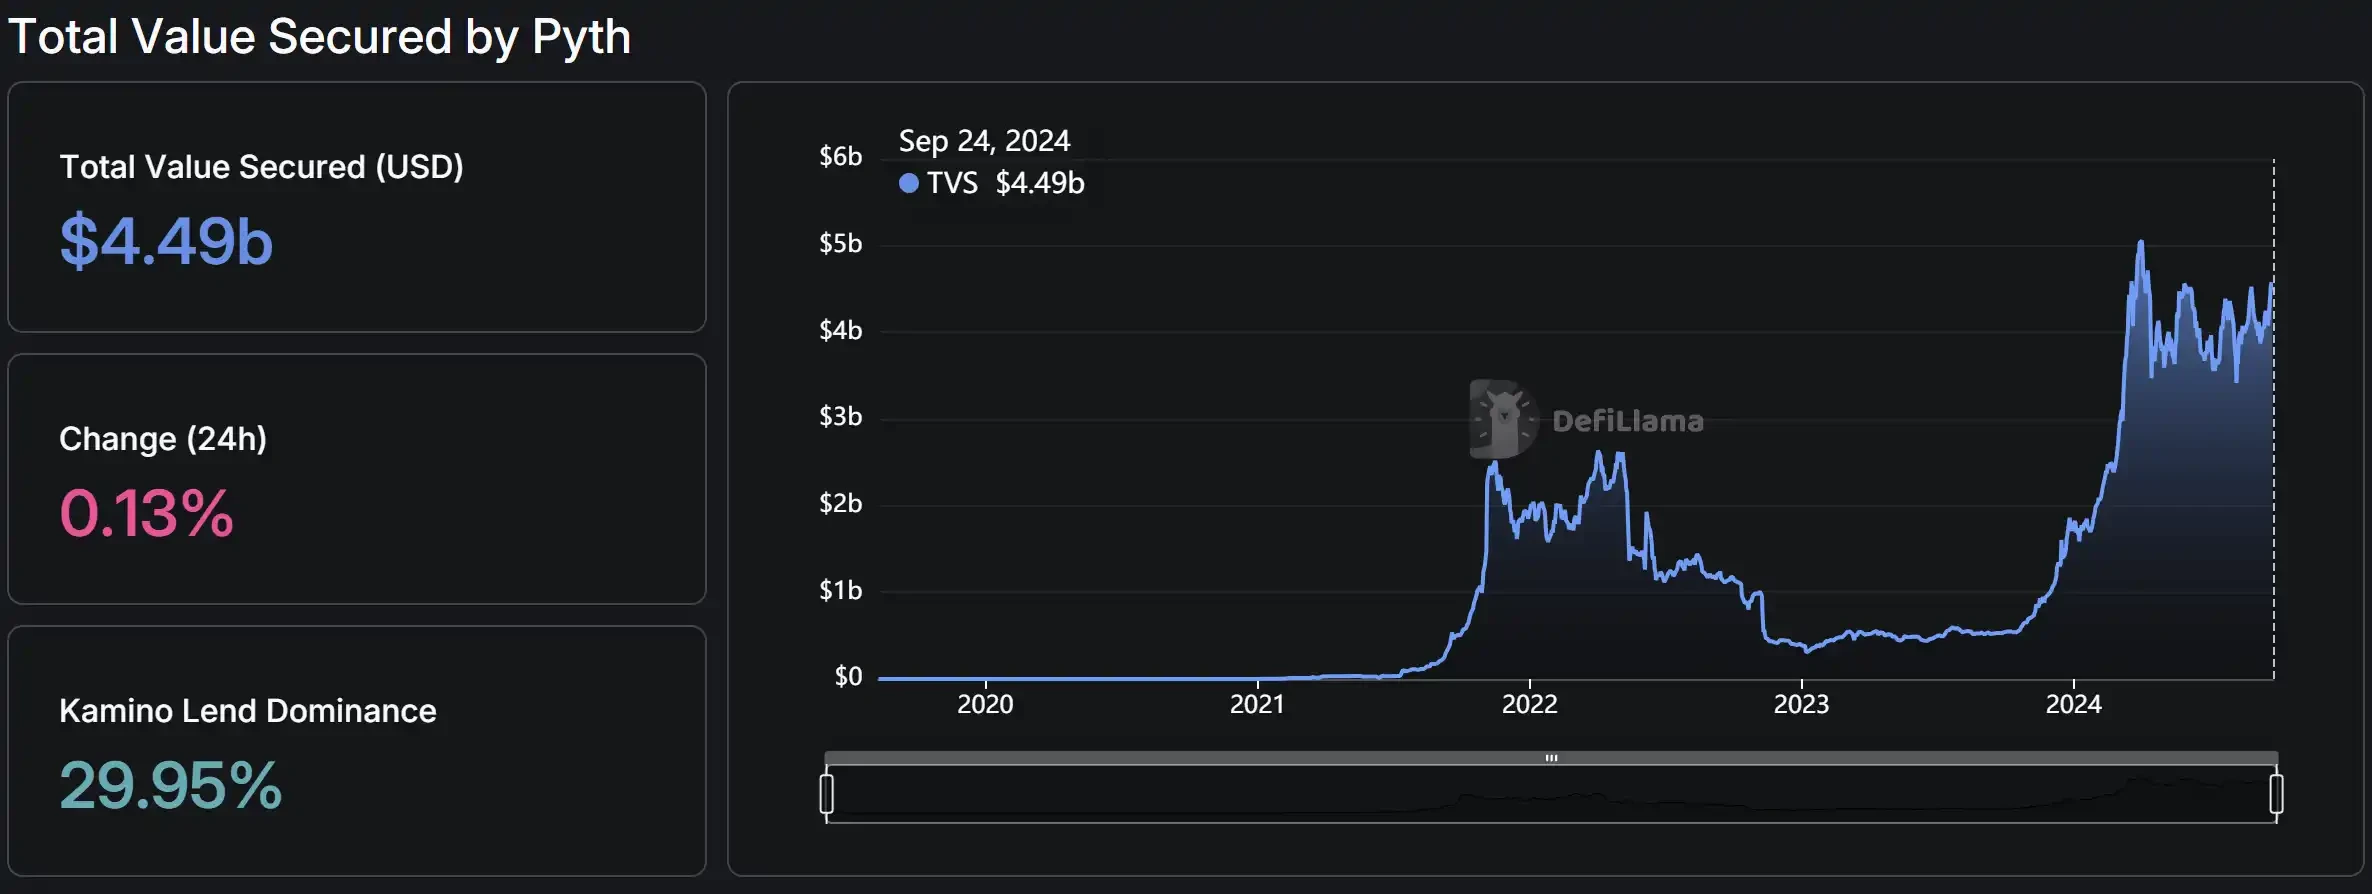
Pyth TVL (TVS) growth, data source: DefiLlama

Pyth TVL (TVS) distribution, data source: DefiLlama
There is no public information on the market to query Pyths income and expenses, so we use the operating data to see the leopard in the tube to infer whether Pyth is in good overall condition. Compared with the leader Chainlink, the dark horse Pyth has an absolute advantage in the business scale of Price Feeds on Solana. In terms of weeks, the number of Chainlinks price feed transactions on Solana is far less than that of Pyth, with an average weekly transaction volume of less than 1 million. Pyth basically maintains above 1 million transactions, accounting for 85% of Solanas total price feed transaction volume. Solana, as Pyths happy home, is also justified as its rear base. Considering the business scale of the EVM chain, Pyth is in a period of steady growth. After the average weekly transaction number it handles exceeds 100K, it gradually stabilizes and is mainly based on public chains such as Arbitrum, Fantom, and Optimism.

Left: Number of Solana transactions processed by Pyth (compared with Chainlink); Right: Number of transactions processed by the Pyth EVM chain and their sources, data source: Dune
However, Pyth still has a long way to go in expanding the market of the EVM chain. According to Dune data, Chainlink still has an absolute monopoly on a weekly basis, accounting for about 92.7% of the EVMs market share. Although Pyth is developing rapidly, the number of transactions processed by its EVM chain is only a fraction of Chainlink.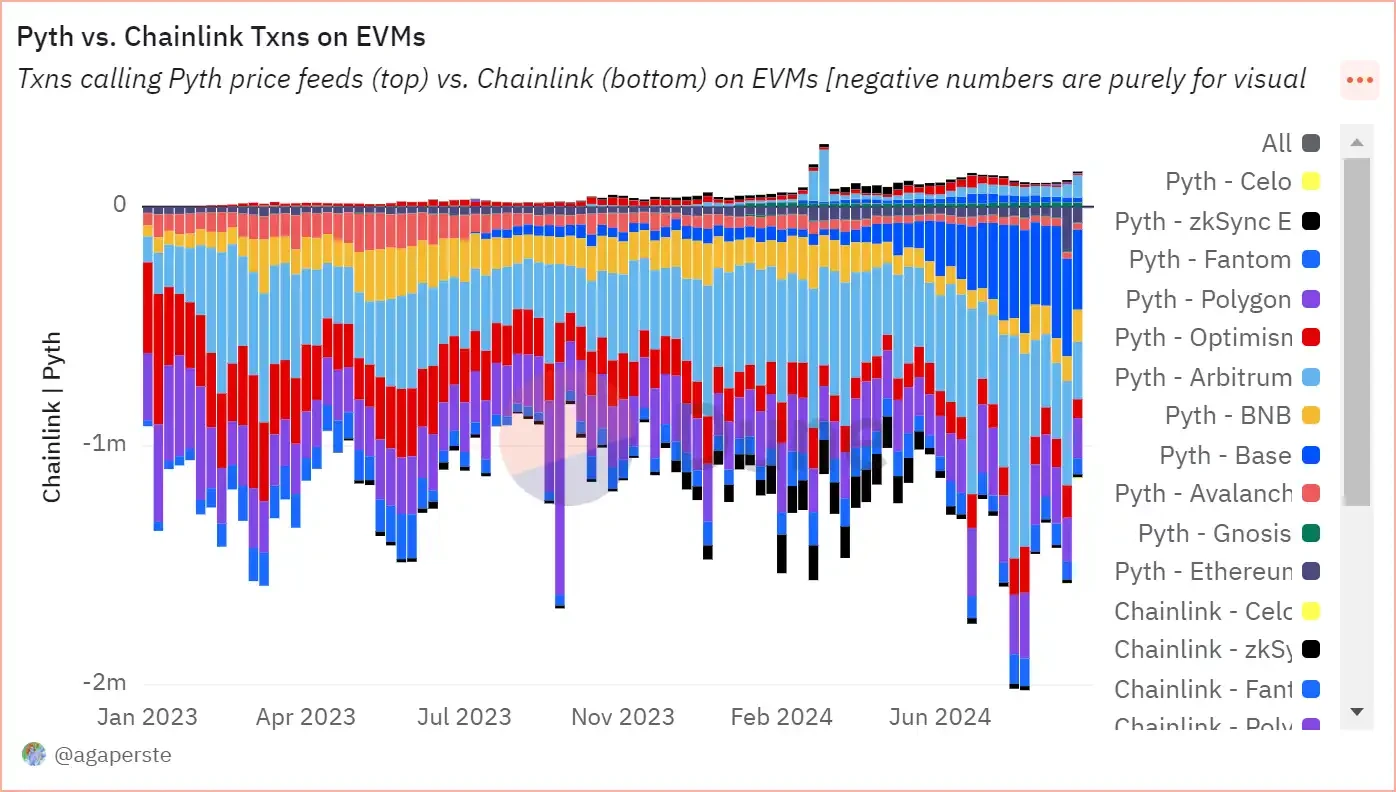
Comparison of the number of transactions processed by Pyth and Chainlink EVM chains, data source: Dune
It is worth noting that according to Dune鈥檚 data, for the entire Crypto market, the largest number of transactions processed by Chainlink comes from Solana, and the number of transactions from EVM accounts for about half of Solana.

Chainlink processed weekly transactions (Solana VS EVM), data source: Dune
As the oracle market gradually becomes a red ocean market in Crypto, Pyth needs to solve the WHY YOU problem for users, both from the cost side and from the ecological side, in order to grab more EVM share.
From the perspective of token investment, the value capture of $PYTH is similar to that of $LINK, and community voting and governance can be carried out through staking. In addition to the staking function, users cannot share the dividends of Pyth development. At the same time, the total number of $PYTH is 10 billion, and the current circulation is only 36%. After the large-scale unlocking in May and the cold market, the price of $PYTH has been hit hard. It has fallen all the way from the highest level of 1.2 to the recent level of 0.3.
Although Pyths fundamentals are gaining momentum, investors in its tokens need to understand whether these businesses are related to the tokens they hold.
Cross-chain interoperability
Since Crypto has formed a multi-chain structure with Ethereum dominating the market and other public chains standing out, cross-chain has made up for the liquidity dispersion problem caused by the fragmentation of public chains and has become an indispensable part of crypto infrastructure.
In the field of cross-chain interoperability, we selected the three cross-chain protocols Wormhole, Layerzero and Axeler, as well as the cross-chain applications Across and Stargate. This article only analyzes and compares the profitability of cross-chain infrastructure from a financial and operational perspective. However, for cross-chain users, there are tens of millions of public chains, and safety comes first, and the security of user assets should always be the top priority in project evaluation.
Trou de ver
Wormhole is a cross-chain communication protocol developed by Solana and Certus.One and launched on September 22, 2021. It was initially used to realize cross-chain token assets between Ethereum and Solana. As of now, Wormhole can support asset transfer functions on multiple chains including BSC, Avalanche, Terra, Base, etc. Wormhole, as the one with the highest market value among the three major chains, has a slightly different fee structure. According to official disclosures, for Wormhole Gateway, the GAS of the source chain is currently the only cost, and users only need to pay GAS.
According to Dune data, the vast majority of cross-chain transactions so far still come from Ethereum to Solana, accounting for around 50%, followed by Bsc, accounting for about 15%. Unlike the market entry point of other cross-chain protocols, Wormhole cross-chains L2 share accounts for a relatively small proportion.
Wormhole cross-chain sources and transaction counts (from Ethereum to other chains), data source: Dune
Due to the design of the protocol fee mechanism, we cannot obtain intuitive revenue data. Therefore, we measure Wormholes operating conditions from the perspective of user activity and transaction volume. Wormhole performed well in Q1 this year, with the highest daily transaction volume approaching 50,000. The increase in transaction volume in January was mainly due to the active on-chain transactions caused by the wealth-making effect of Solanas MEME Coin, and cross-chain transactions to Solana accounted for half of the total volume, which eventually led to a surge in transaction volume in January. However, as the Solana MEME narrative gradually weakened, Wormholes transaction volume also declined visibly. For most of this year, it remained stable at around 3,000 to 5,000.
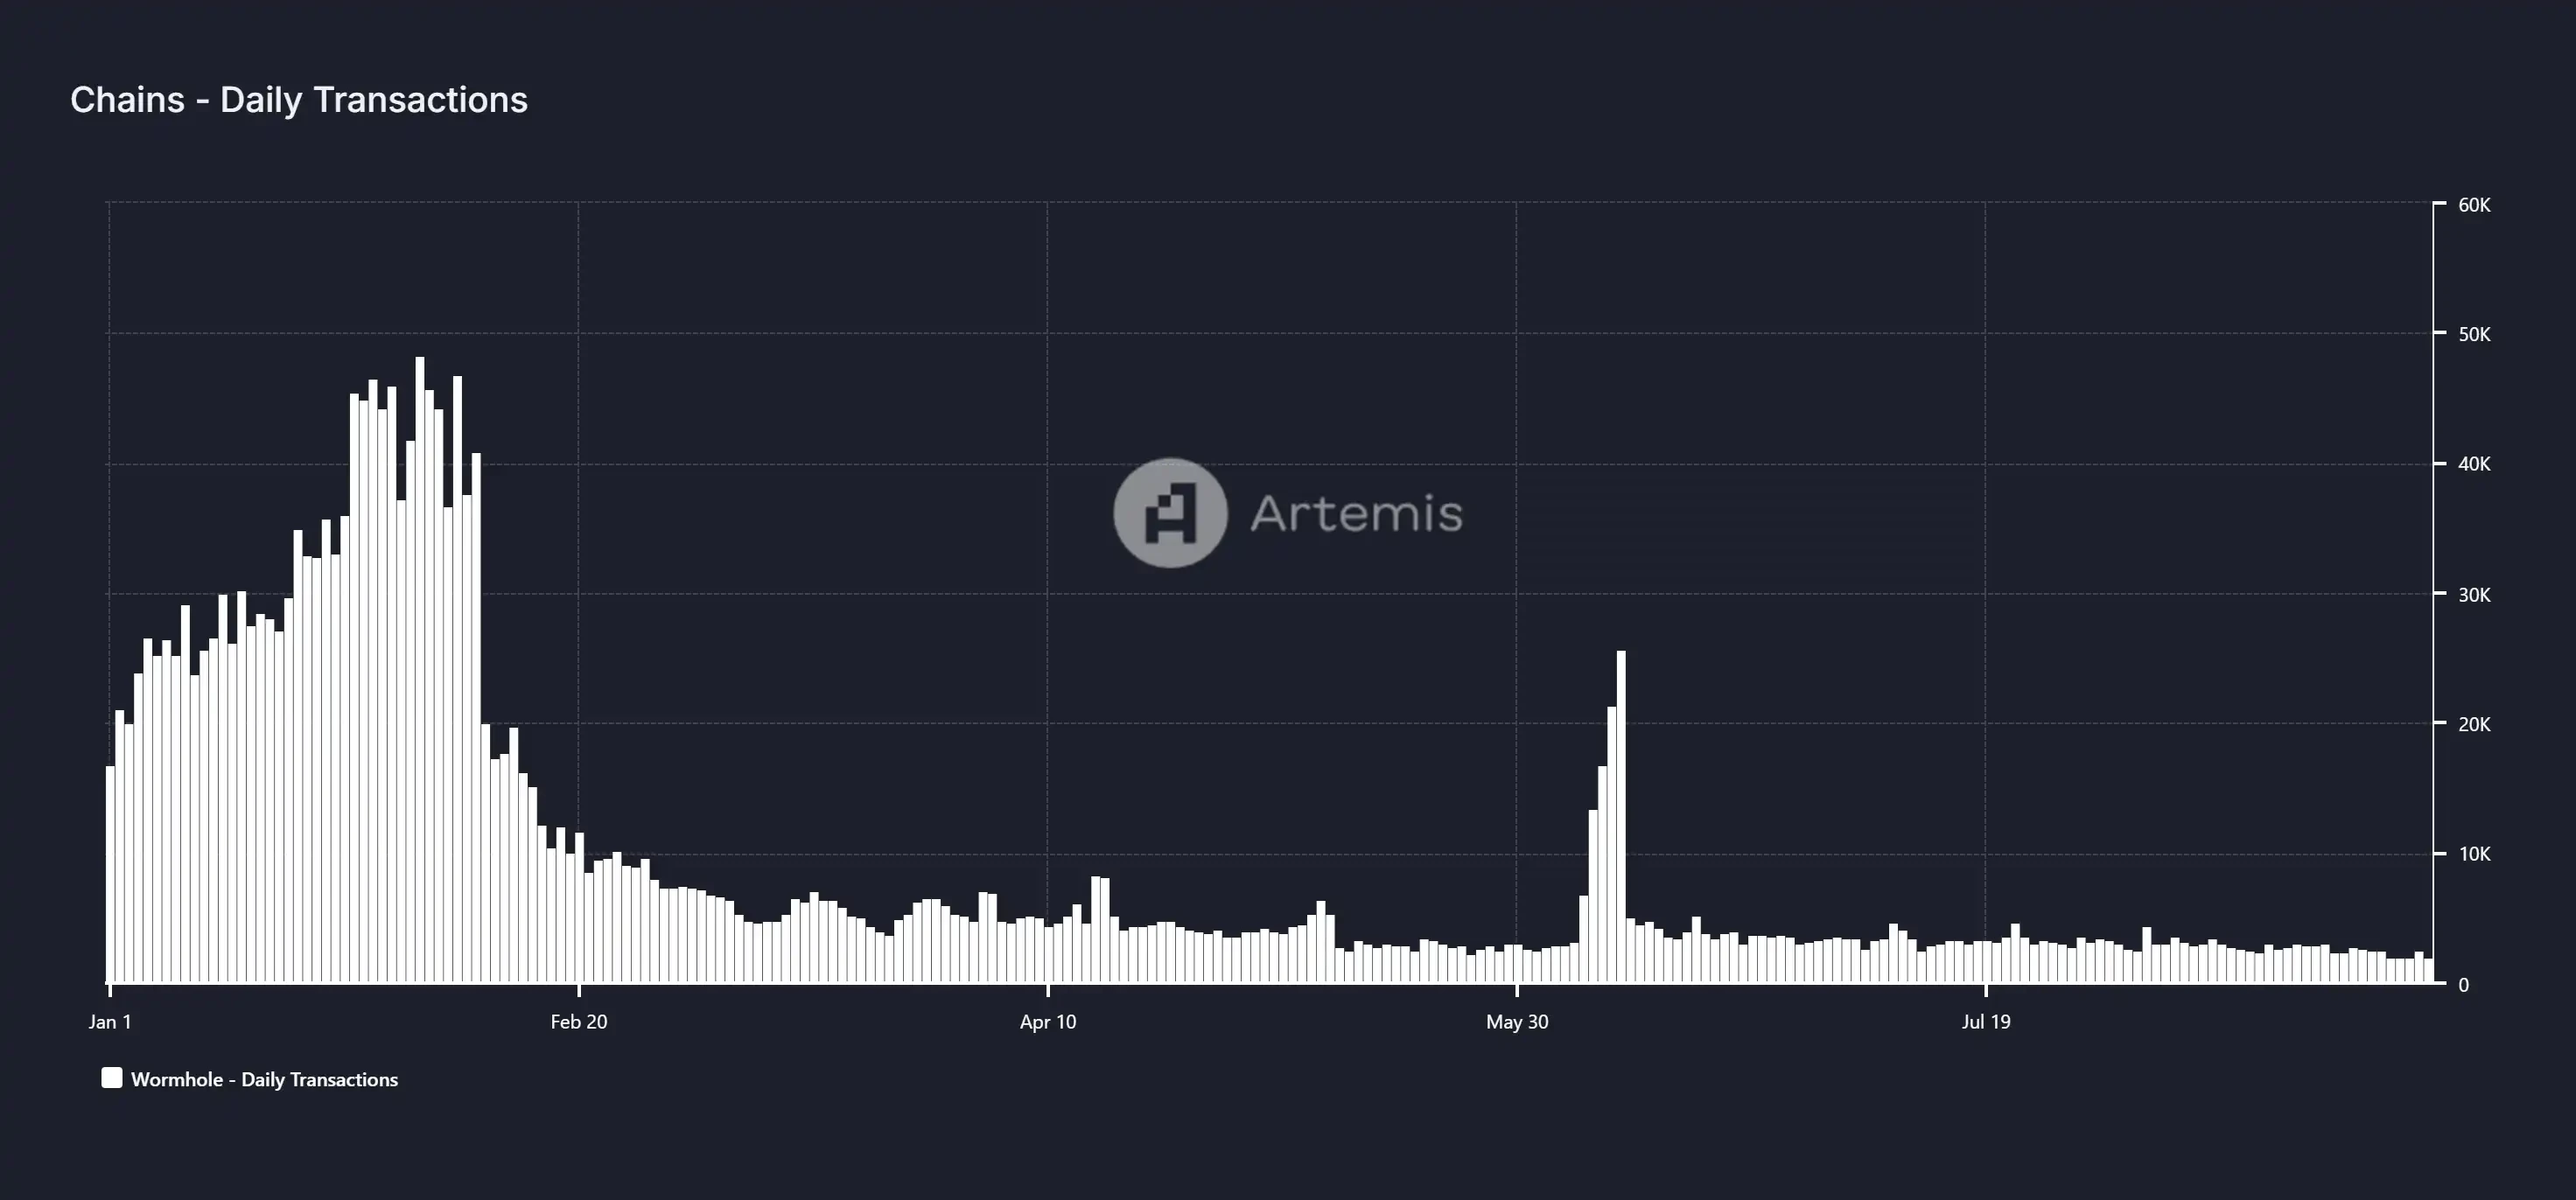
Wormhole daily cross-chain transaction volume, data source: Artemis
For token investors, Wormholes native token $W has limited value capture capabilities. The main function of $W is to conduct on-chain governance after staking. Unlike other cross-chain protocols, Wormhole uses the POA consensus mechanism, where validators are composed of 19 trustworthy large institutional validators and do not need to stake tokens when verifying inter-chain messages. This not only reduces the application scenarios of the token $W, but also the POA mechanism lacks sufficient economic incentives for validators, significantly reducing the cost of committing evil.
CoucheZéro
As the underlying protocol for full-chain communication, LayerZeros current main application scenario is the transfer of token assets, as well as operational use cases such as NFT and cross-chain governance. LayerZeros revenue mainly comes from cross-chain information fees: when a user transfers their token assets from the source chain to the target chain, the LayerZero protocol will charge fees from the source chain in the form of currency. In the most recent quarter (2024 Q3), LayerZeros main sources of income were Arbitrum, BNB Chain and Ethereum. At the same time, in Q2 of this year, due to the reduction of GAS, the proportion of cross-chain transactions of Arbitrum and Optimism networks increased significantly. As the leading protocol in the cross-chain track, its integrated dapps also successfully broke through the 50,000 mark this year.

Left: LayerZero鈥檚 revenue source ratio; Right: LayerZero鈥檚 cumulative number of integrated applications, data source: Dune, LayerZero official website
According to Dune data, LayerZeros revenue in the three quarters of 2024 was: $37.6879 million, $12.8626 million, and $972,700 (as of August 31). It can be clearly seen that LayerZeros protocol revenue began to decline sharply after entering Q2 and has never recovered. On the one hand, because LayerZero officially issued tokens in June and took anti-witch measures before that, a lot of data whitewashing was cleaned up; on the other hand, the overall market environment was bearish in May, and the sharp decline of major public chain tokens made its revenue worse.

LayerZero monthly revenue and share, data source: Dune
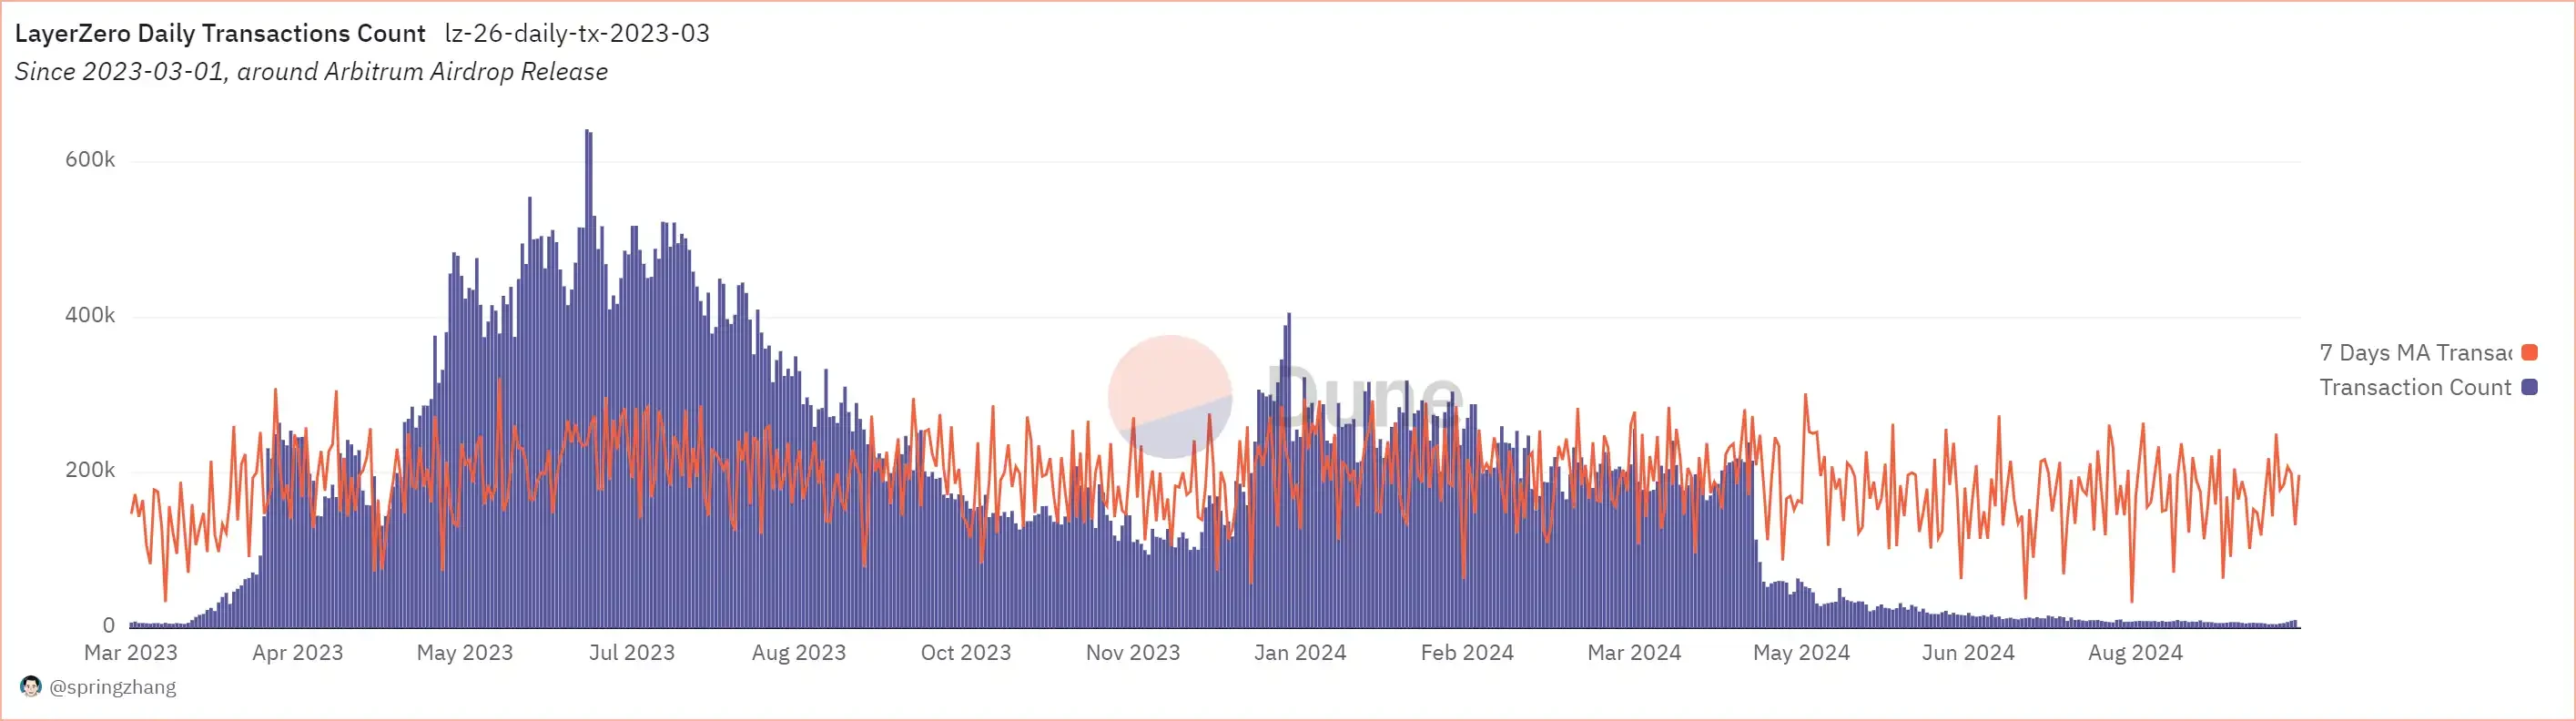
LayerZero daily transaction statistics, data source: Dune
The overall operation of LayerZero is closely related to the activity of the on-chain market. When the on-chain market is bullish, Layerzeros operating data also takes off. After May of this year, the market went bearish, and its revenue was close to cut, slightly higher than the level of the previous bear market. This is not only due to the market environment, but also the significant reduction in GAS fees brought about by the Cancun upgrade is also an important factor in the decline of Layerzeros revenue by an order of magnitude.
LayerZeros native token is $ZRO, which had a market value of $1 billion when it was first launched in June this year, but has now been halved to $433 million. $ZRO is Layerzeros governance token and can be consumed during cross-chain messaging. In terms of fundamentals, Layerzeros P/F ratio is still overvalued because the decline in market value is smaller than the decline in revenue.
Axelar
Axelars business model still uses the traditional rent collection method. Transactions and smart contract executions on the Axelar network will incur corresponding fees, which are paid in AXL tokens and bring direct income to the network. Users who conduct cross-chain transactions will pay GAS to the Axelar network, which will then be redistributed to the stakers by the Axelar network. Axelars main expenditure is the $AXL token rewards paid to validators. At the same time, Axelar is also developing AVM with the intention of opening up smart contract development at the cross-chain level. According to official data, the most important cross-chain transactions currently come from BNB Chain and Sei. The transaction volume between the two is US$3.4 billion, accounting for about 40% of the total transaction volume.

Axelar official statistics cross-chain transaction distribution chart, source: Axelar official website
From Q1 2024 to Q3 2024, Axelars various indicators denominated in US dollars are not optimistic, whether in terms of transaction volume or cross-chain fees, with a sharp drop of more than 50% year-on-year, showing an accelerating downward trend. From the perspective of price-to-earnings ratio, Axelars P/F ratio in the third quarter did not decrease but increased. The main reason is that its market value has declined by about 30%, which is less than the halving of cross-chain fee revenue, so the P/F ratio is generally inflated.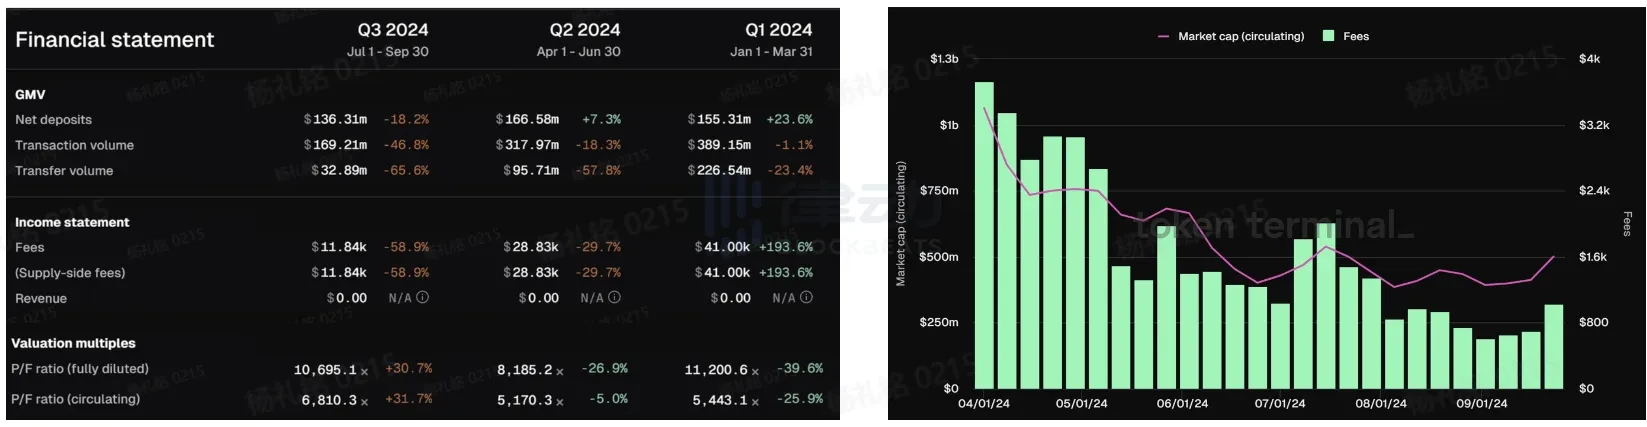
Left: Changes in Axelar鈥檚 quarterly financial indicators; Right: Comparison of Axler鈥檚 circulating market value and transaction fees, data source: Tokenterminal
In terms of user data, Axelars daily active users formed a double peak in mid-January and mid-July this year, with the highest daily active users reaching 4.5K. But after mid-July, it gradually fell back to around 1.5K. Compared with 2023, Axelars users have remained active overall this year. It is worth noting that the proportion of GMP (General Messaging) in the Axlear network has continued to increase, and has almost completely replaced simple asset cross-chain, accounting for 98% of the total active users.
Axelar monthly activity data, data source: Axelar official website
Axelar has currently connected to 66 chains including Ethereum, BNB Chain, Arbitrum, Fantom and other mainstream public chains. As the number of connected networks increases, the threshold for validators will also increase, and the corresponding token rewards will also rise. Initially, such a plan would lead to an increase in the inflation rate of $AXL. After the official realized the problem, it replaced it with a GAS burning mechanism. The change in the overall token inflation mechanism is beneficial to the $AXL token investors, and its annual inflation of 11.5% can be offset by 10% through GAS burning.
Across
Across is a cross-chain protocol supported by UMA, which relies on UMAs optimistic oracle mechanism to achieve cross-chain between L2 and L1. Currently supported chains include mainstream L2 public chains such as Arbitrum, Optimim, Base, Linea, and Blast.
In terms of cross-chain technical design principles, Across introduced the relayer ReLayer, which locks the token assets of the source chain and releases the corresponding tokens in the target chain. After the relay execution is completed, the optimistic oracle will perform subsequent data verification to ensure asset security and reward the relayer. The Relayer in the Across network relies on the liquidity of the corresponding tokens provided by the LP on the target chain when bridging. If the liquidity is exhausted, the cross-chain cost of the user will surge.
Therefore, the good operation of Across is inseparable from the participation of the left and right hands Relayer and LP. The two bear various risks contained in any bridge event on Across, and users pay fees to them when using cross-chain services. On the one hand, the operating model of the liquidity pool is essentially similar to AAVE or Compound, and its pricing scheme also refers to the pricing design of AAVE and adopts the interest rate pricing model: the interest rate R is calculated through the model, and the LP fee is calculated based on a one-week trading cycle. On the other hand, the relayer will advance GAS when crossing the chain, and will receive fee compensation after the transaction is successfully verified. Therefore, when evaluating whether Across is operating well, transaction volume and transaction fees will be fairer evaluation criteria.
According to DeFiLlama data, Acrosss transaction volume in the past month was $637.94m, ranking sixth among cross-chain applications. As of September 11, Acrosss cumulative users have exceeded 2 million, and the number of monthly active users has stabilized at around 200,000.
Cross-chain application ranking (sorted by transaction volume), data source: DefiLlama
At the same time, according to data provided by Dune, the cross-chain transaction fees caused by Across in Q2 this year are already comparable to the daily transaction fees at the end of the last bull market, reaching the level of $60,000 per day. Although Across is not as well-known as other cross-chain applications, it still has a certain degree of competitiveness in the market.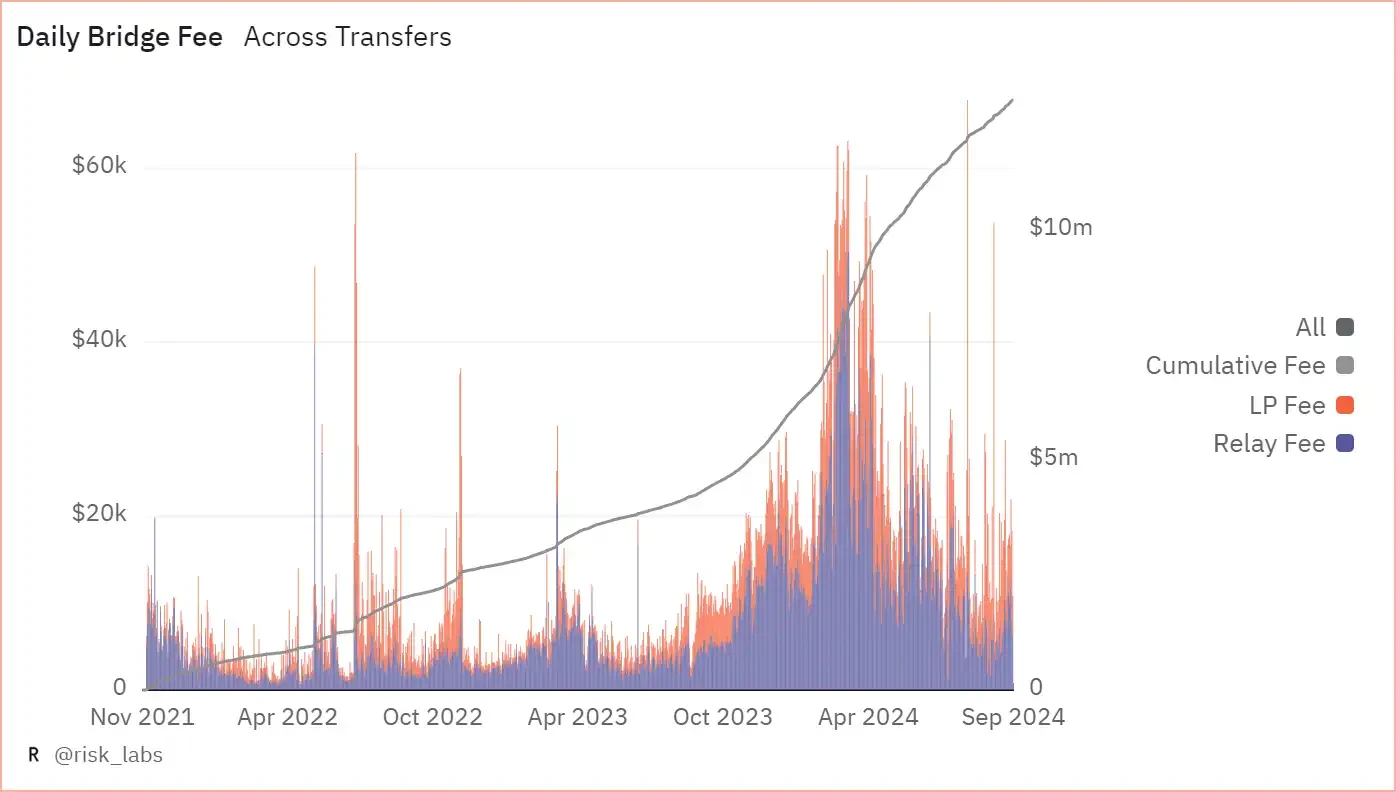
Across daily cross-chain transaction fees and composition, data source: Dune
In terms of cross-chain transaction volume, Acrosss cross-chain volume reached a high level of $2.4 billion in Q1 at the beginning of the year. Then the MEME craze in Q2 maintained the cross-chain transaction volume above $2.5 billion. However, contrary to this, although the on-chain transfers increased, the handling fees did not increase to the level they should be. Instead, it reached a peak in Q1 this year, then fell 33% in Q2, and halved 66% in Q3. The reason for the decline in Q2 was that the Cancun upgrade caused a lot of L2s cross-chain GAS. Q3 was due to the decline in transaction volume due to the sluggish market.
Across changes in various financial indicators, data source: TokenTerminal
From the perspective of token investment, Acrosss native token $ACX has weak value capture capabilities. $ACX can be used to manage DAO funding decisions and as a lock-up reward for LPs. Across has proposed an LP lock-up reward plan, where the longer the lock-up time, the more multiplier rewards and $ACX token incentives you will receive. Since the Snapshot proposal was passed in September 2023, Across has increased the APY % of the liquidity pool by 50% and reduced the original 3x multiplier to 2x.
Obviously, for the Across project itself, there is no direct correlation between its profitability and the price and market value of the token. Although the transaction fees of the Across network have been cut in half and cut in half again, the market value of its token $ACX remains stable, maintaining at around $120 million. Therefore, the decrease in transaction fees has led to an increase in the P/F ratio, and the overall project is overvalued. However, for investors, the overall high P/F ratio does not seem to have a direct impact on the investment decision of $ACX.
Across transaction fees and market capitalization comparison chart, data source: Tokenterminal
Porte des étoiles
Stargate is a composable liquidity transmission protocol officially launched by LayerZero and developed based on LayerZero technology. Stargate is positioned to become a cross-chain application for the entire DeFi chain. It currently covers more than 10 public chains including Abriturm, Scroll, Base, Linea, etc. According to DeFiLlama data, its scale in the past month is second only to Arbitrum Bridge, reaching $1 billion, ranking second.

Data source: DefiLlama
In addition to cross-chain interaction, Stargate also has businesses such as building liquidity pools and staking mining. The Pool model is similar to Across. When building a full-chain cross-chain, the target chain of the Stargate cross-chain needs LP to provide corresponding liquidity. Investors can provide liquidity as LPs and obtain corresponding returns. On the other hand, users can stake LP tokens to obtain $STG token rewards.
Stargates revenue channel mainly comes from the fees charged for token transfers. For non-$STG token transfers, a fee of 0.06% will be charged for each transaction. LP and veSTG holders will each receive a 0.01% fee allocation.
However, Stargates transaction fees have been declining since the beginning of the year. The highest reached $3.34 million, and it has dropped to $196K in Q3. But compared with Across, Stargates business flow is still huge, and the transaction volume remained between $3 billion and $5 billion in the first two quarters, but it fell sharply in Q3, only $226.82M.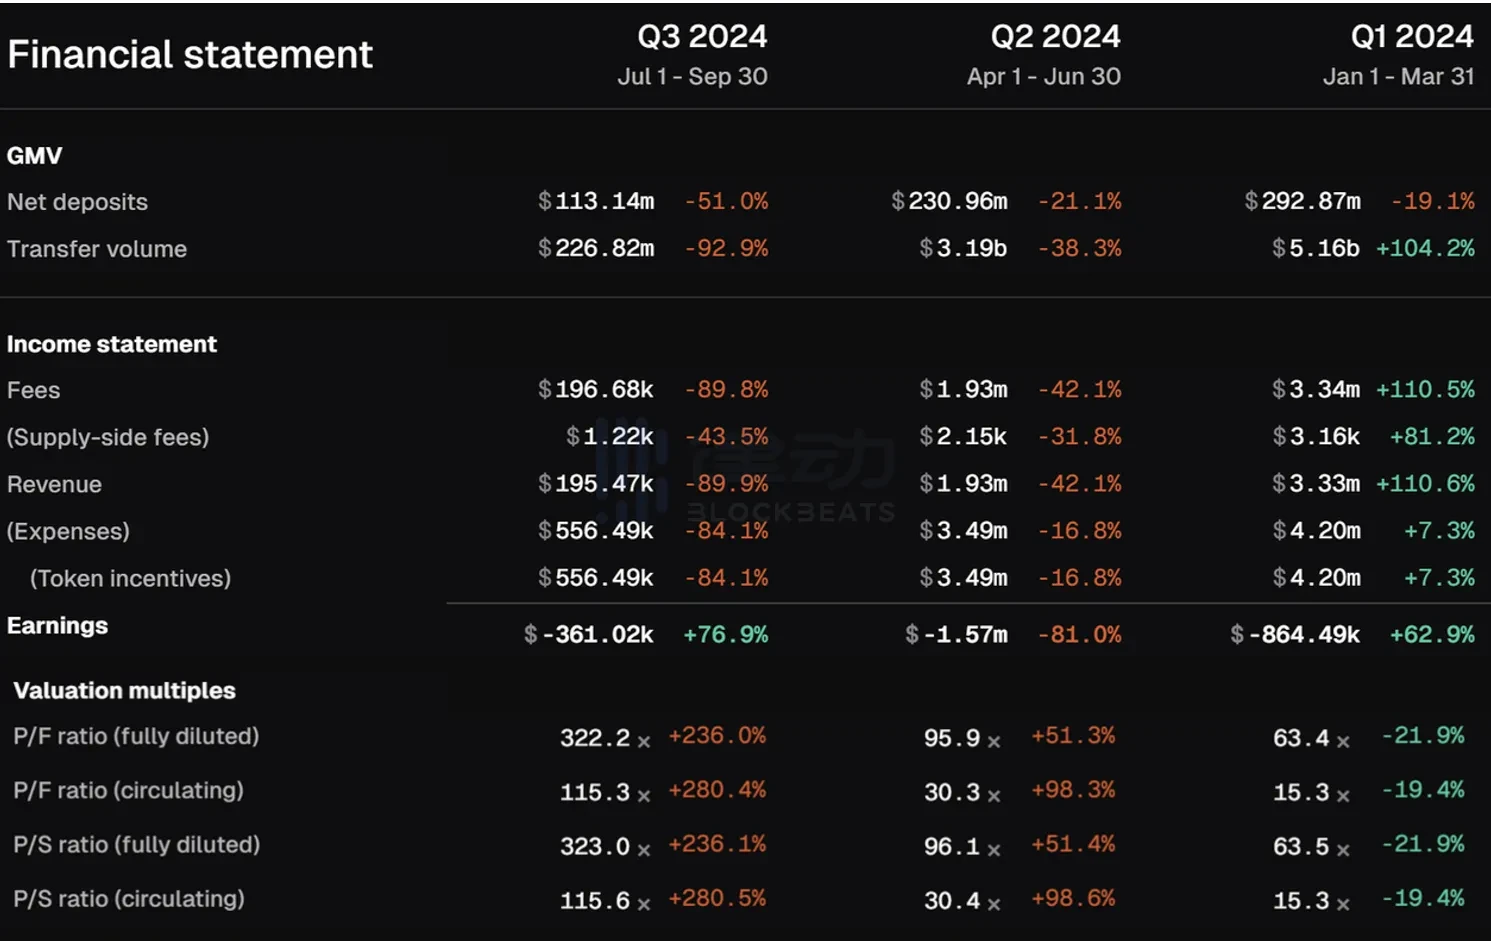
Changes in Stargate鈥檚 financial indicators, data source: Tokenterminal
The protocol fees collected by Stargate began to plummet after May this year, and the total fee income in Q3 this year evaporated by 90% compared with Q2. However, the circulating market value of $STG did not decrease with the reduction of total fees, and remained at around 120 million. As a result, the P/F ratio surged in Q3. From this perspective, the price of $STG is seriously overvalued.

Comparison of Stargate transaction fees and circulating market value, data source: Tokenterminal
Compared with $ACX, Stargates native token $STG adopts the ve model design in token economics, which has stronger value capture capabilities. Token holders obtain veSTG by staking $STG, vote on Stargates fee standards, liquidity pool adjustments and other matters, and participate in community governance. At the same time, as the time of staking STG tokens increases, users can obtain additional veSTG rewards to increase their weight in community governance, and the positive flywheel can be accelerated. On the other hand, users can provide $STG to the platform to increase liquidity, or they can obtain $STG rewards through mining. Overall, the market value of $STG is relatively stable.
stockage
If Web3 can achieve true Massive Adpotion in the near future, decentralized data storage is crucial and will become an indispensable part. Although the overall data storage scale of Web3 is negligible compared to traditional Web2 storage, this also means that future Web3 storage projects have a higher ceiling and a huge stock market. In the field of storage infrastructure, we selected two major projects, Filecoin and Arweave, for comparative analysis.
Filecoin
Filecoin adopts a pay-per-use model, rather than Arweaves one-time transaction. Filecoin storage providers (i.e. miners) mine $FIL by providing storage services to Filoin users or promising storage capacity on the network. To encourage long-term network coordination, 25% of the block rewards received by miners can be used immediately, while 75% will be unlocked linearly within 180 days. Secondly, if users need to use storage services, they need to pay a certain $FIL fee. Similarly, when they need to retrieve and retrieve later, users also need to pay a certain fee.
In general, Filcoins operating income is mainly composed of user interaction GAS and fines imposed on miners, while the $FIL token reward to miners is the main expenditure under its business model. At the same time, Filecoin is actively transforming to on-chain computing and has developed FVM to facilitate developers to develop applications on Filecoin to complete ecological construction.
According to data from Messari, the number of Filecoin users with storage scale greater than 1,000 TiBs is increasing. These users are usually enterprise-level users with large data storage capacity and good stickiness.
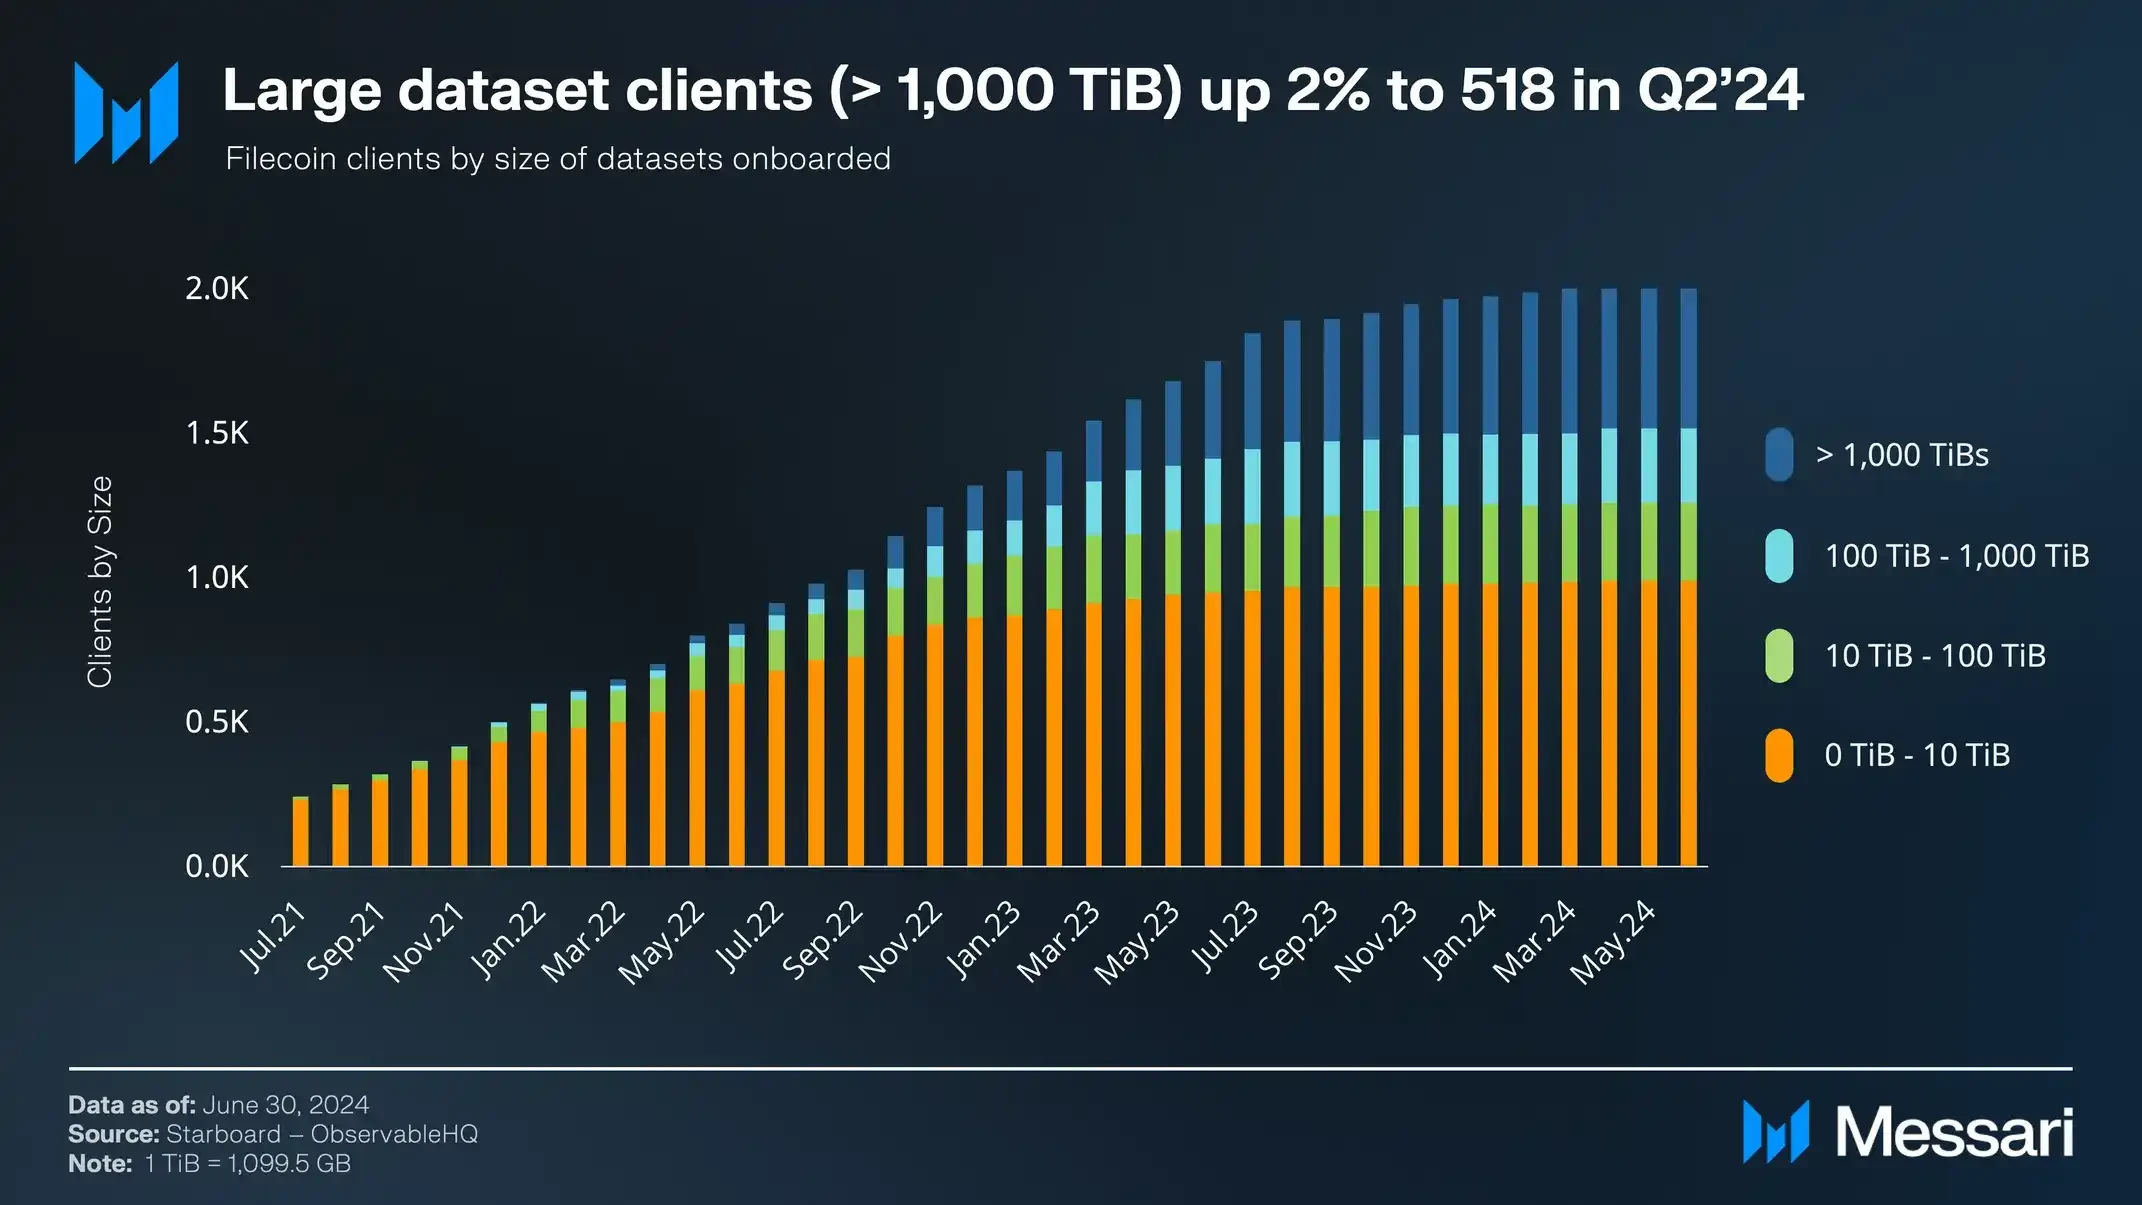
Filecoin storage users with more than 1,000 TiBs, data source: Messari
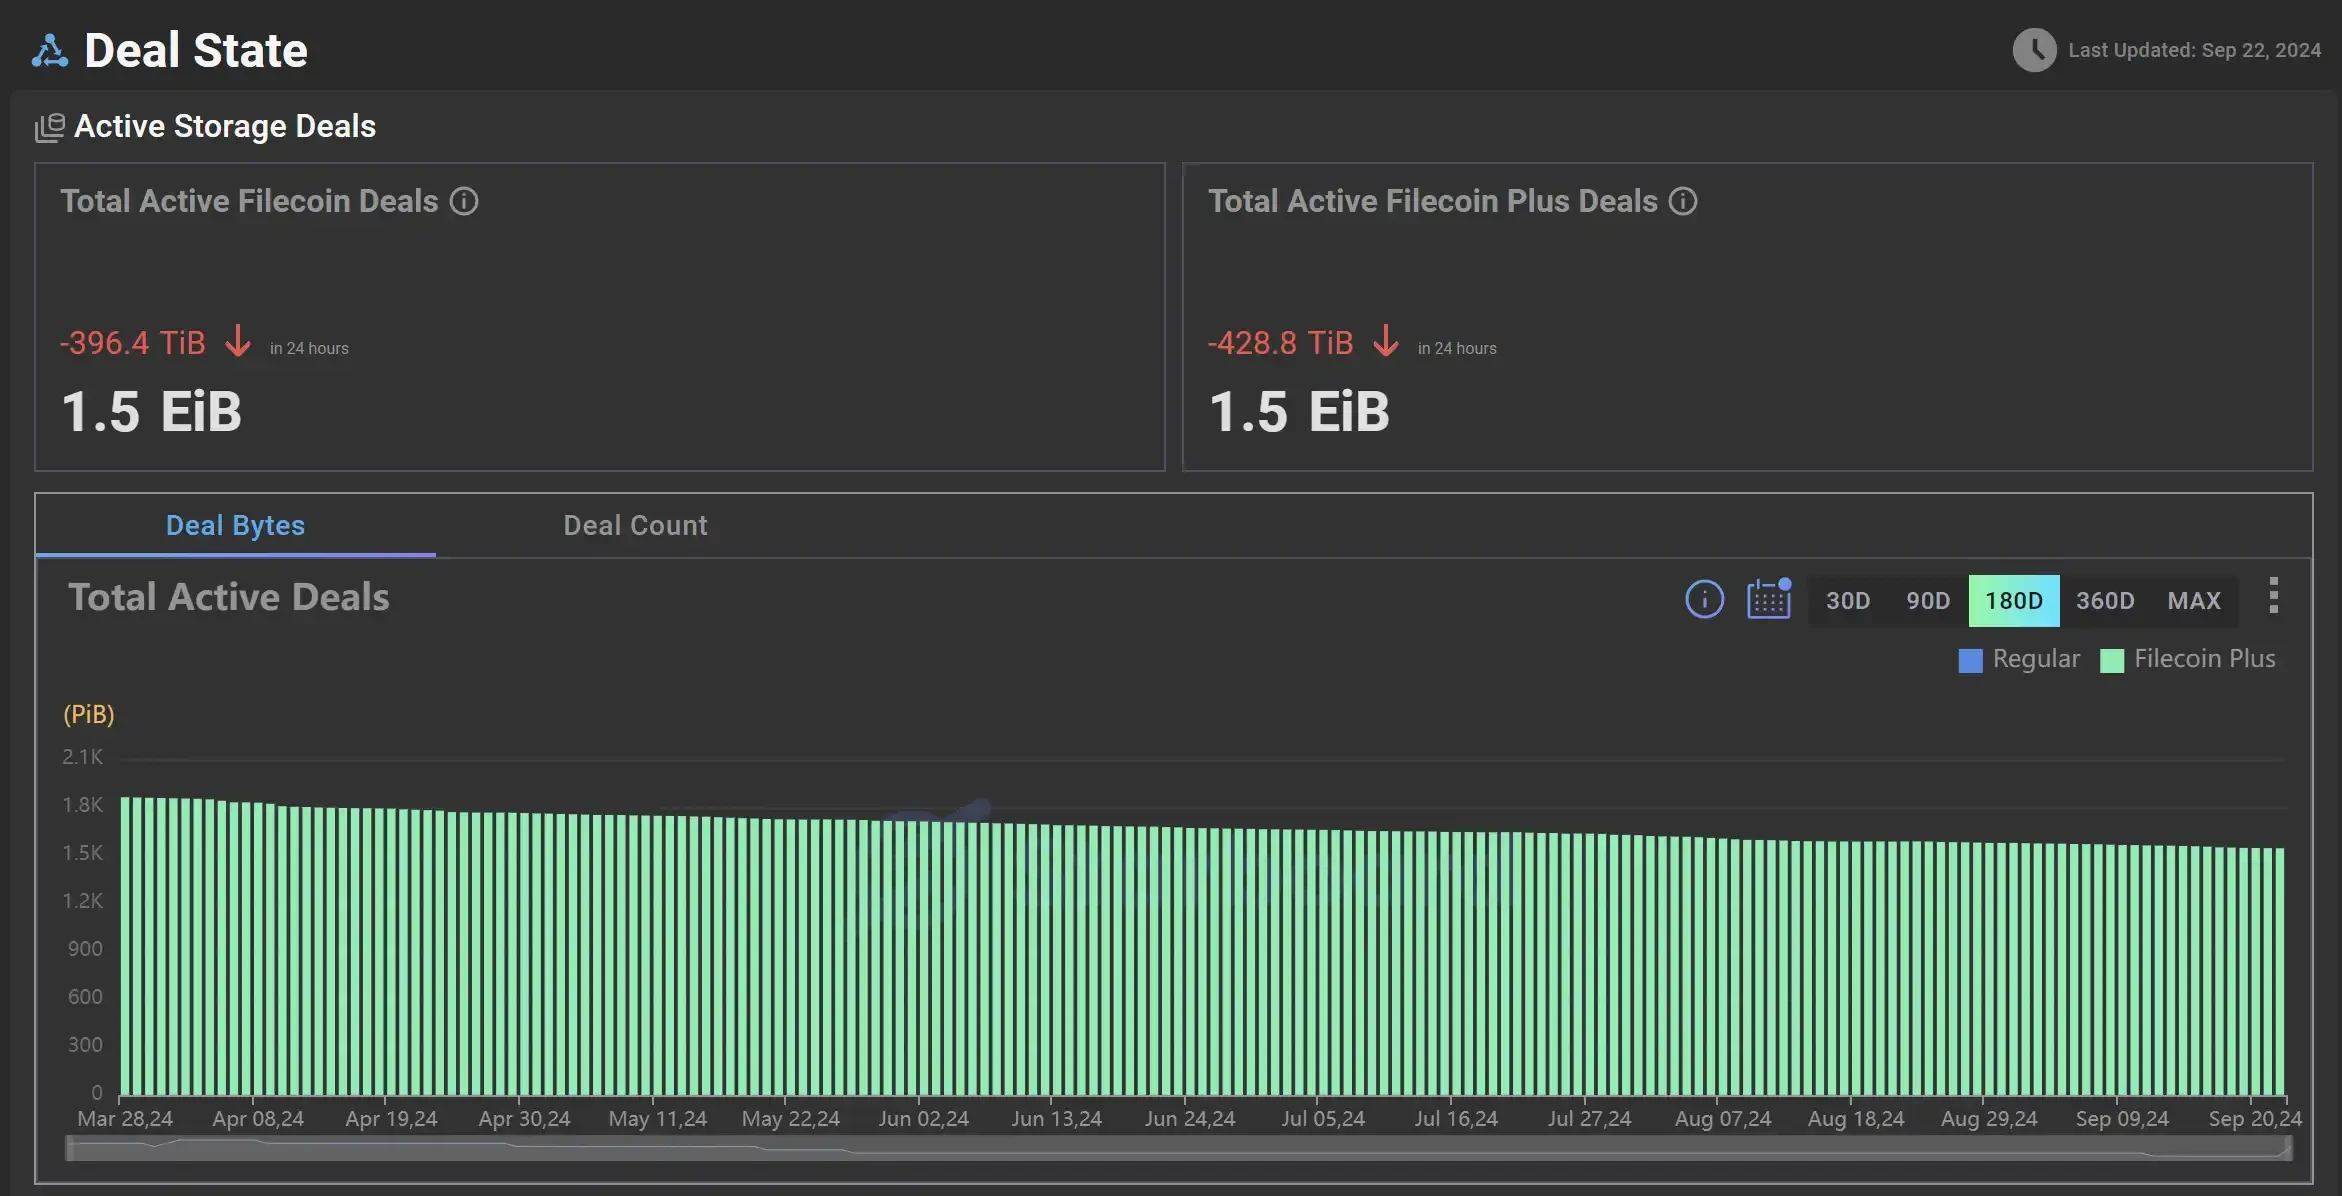
According to TokenTerminal data, Filecoins fee income has continued to increase from the beginning of the year to the end of June, with an increase of up to 151%, but the overall fee has dropped sharply since entering Q3. From the expenditure side, Token incentive, as a block reward, has begun to decline rapidly since the end of Q1. This situation is not only due to the spiral design of Filecoins token economics, but the main reason behind it is the increasing loss of miners. According to Filscan data, since the end of 23, the decline of Filecoins active storage providers has been difficult to conceal. From a traditional valuation perspective, the reduction in fees has led to an inflated P/F Ratio in Q3.

Changes in Filecoin鈥檚 financial indicators, data source: Tokenterminal

Statistics of active storage providers, data source: Filecoin official website
In terms of token value capture, its token $FIL is not only used as GAS in the Filecoin network, but can also be used as a token incentive for miners to provide storage services. When providing storage services, miners need to pledge $FIL tokens to ensure the security and service quality of the network. The overall token economics design of Filecoin presents a spiraling pattern.
The price of Filecoin in the last bull market was very exaggerated. At its peak, the price of $FIL reached 200 US dollars per coin, and its FDV reached an exaggerated 380 billion. The reason for the price surge is that the unlocking amount of $FIL is small. On the other hand, since the miner reward is based on the $FIL coin, when the coin price rises, it will attract miners to enter the market, and miners will buy more $FIL for staking. Thanks to the design of token economics, the price of $FIL finally soared.
However, after the Bitcoin ETF ushered in a bull market this year, the price of $FIL did not experience a surge like the previous bull market. As of the time of writing this article, the price of $FIL has only increased by 4.6% in the past year. In contrast, the price of Arweaves native token $AR has increased by as much as 313% in one year. 
Data source: CoinGecko
On the one hand, the market environment is not as expected; on the other hand, unlike $AR which is close to full circulation, $FIL has a circulation of about 30%, and there are still a large number of unlocked tokens, which puts a certain amount of selling pressure on the overall token price. Investors need to carefully consider between investment projects and project tokens.
Arweave
Arweave is different from Filecoin mentioned above. Its selling point is to achieve decentralized permanent storage of user data on the chain. The Arweave protocol is built on the HTTP protocol. Users can access Arweave through Web2 browsers such as Google Chrome and allow individuals with idle hard disk space to store data in exchange for AR tokens.
Arweave adopts a one-time fee business model, where users only need to pay the corresponding fee based on the storage capacity of the data to achieve permanent storage. Part of the one-time fee paid by the user is used for the initial storage cost, and the other part goes into the donation Arweave fund for future storage costs.
Although Arweaves user upload data is on par with the previous bull market, or even slightly surpasses it, reaching a maximum of 8.79 T/month, it is still lower than expected when compared with Filecoins user upload data. According to Starboard data, Filecoins daily upload volume has reached 1.5 E (where 1 EiB = 1024 TiB), and the storage scale of Arweave is an order of magnitude different from that of Filecoin.
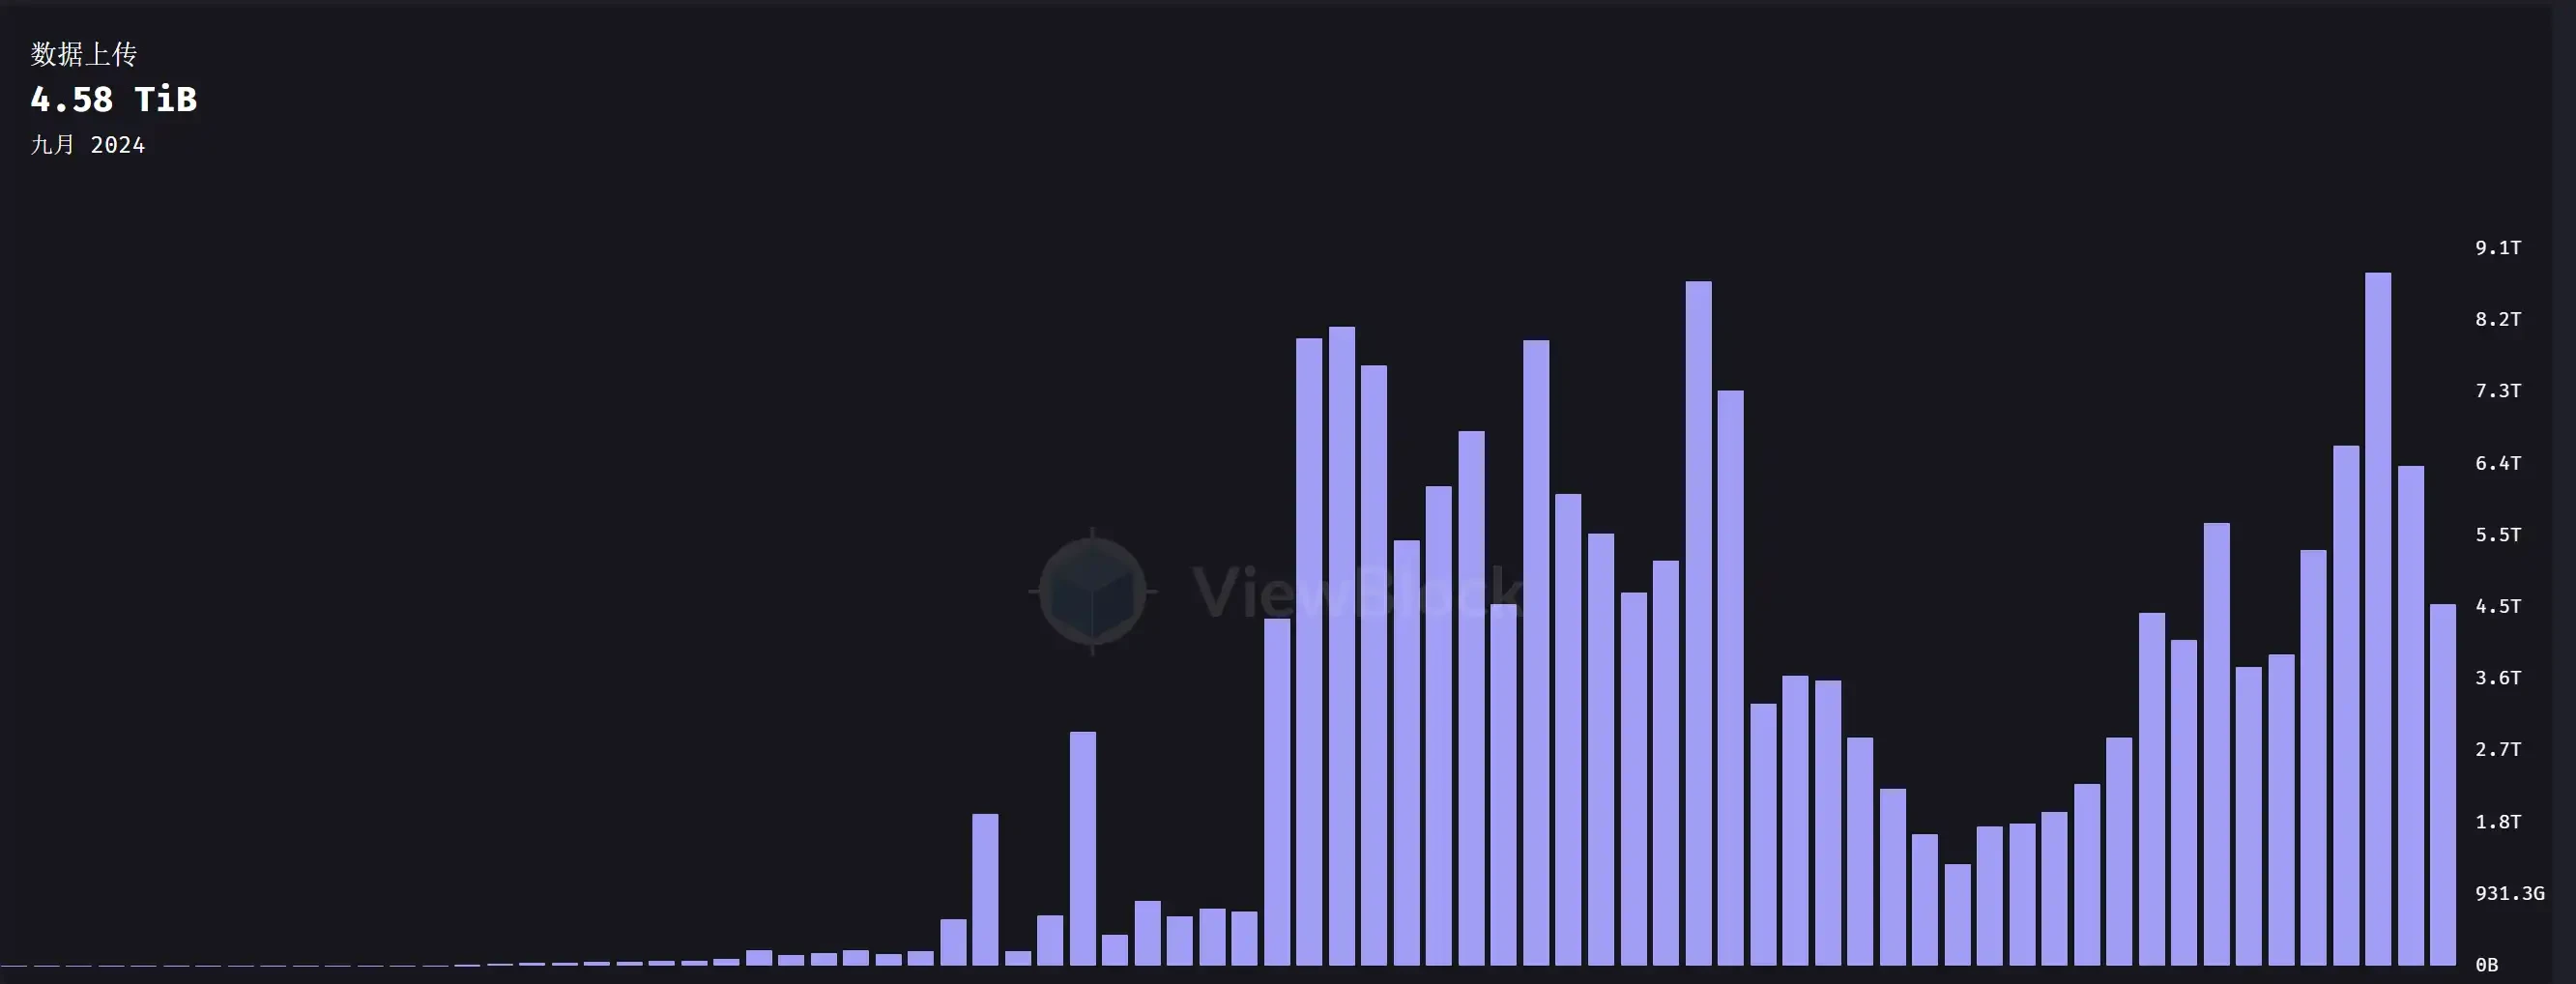
Arweave daily upload data volume, data source: ViewBlock
Filecoin daily upload data volume, data source: Starboard
According to the monthly estimate, taking Arweaves average storage of 4 TB as an example, according to the calculation results of the ar-fee website, it costs about $70,000 to store 4 TB of data. According to Coingecko data, the data storage fee for Filecoin to store 4 TB is $0.76 per month. With the same cost of $70,000, Filecoin can be used for storage for 7,675 years. 7,675 years is obviously not worth mentioning compared to permanent storage, but for a entreprise or individual, it is almost equivalent to eternity.
Arweave storage fee calculation, data source: https://ar-fees.arweave.dev/
When we re-examine Arweaves pay once, store forever business model, such a narrative is not a sexy story from a fundamental logic perspective. First of all, the essence of Arweave is similar to a time capsule, and its positioning is aimed at small and beautiful projects. It is not attractive to large enterprises, because the data that large enterprises need to store is usually private information, not public information; on the other hand, from a cost perspective, a lot of enterprise data does not need to spend such expensive storage fees for permanent storage, and it is more cost-effective to adopt Filecoins storage solution. So fundamentally, it is difficult for Arweave to attract large customers, which is why its data upload scale remains at 4 T.
Although Arweave has a limited audience and a relatively low product ceiling compared to Filecoin, from a micro-data perspective, Arweaves transaction fees are only slightly lower than the previous bull market if priced in currency. The transaction fee in September 2021 was 4468 $AR, worth about $223,400 (50*$4468); the transaction fee in August 2024 was 6685 $AR, worth about $167,125 (25*$6685).
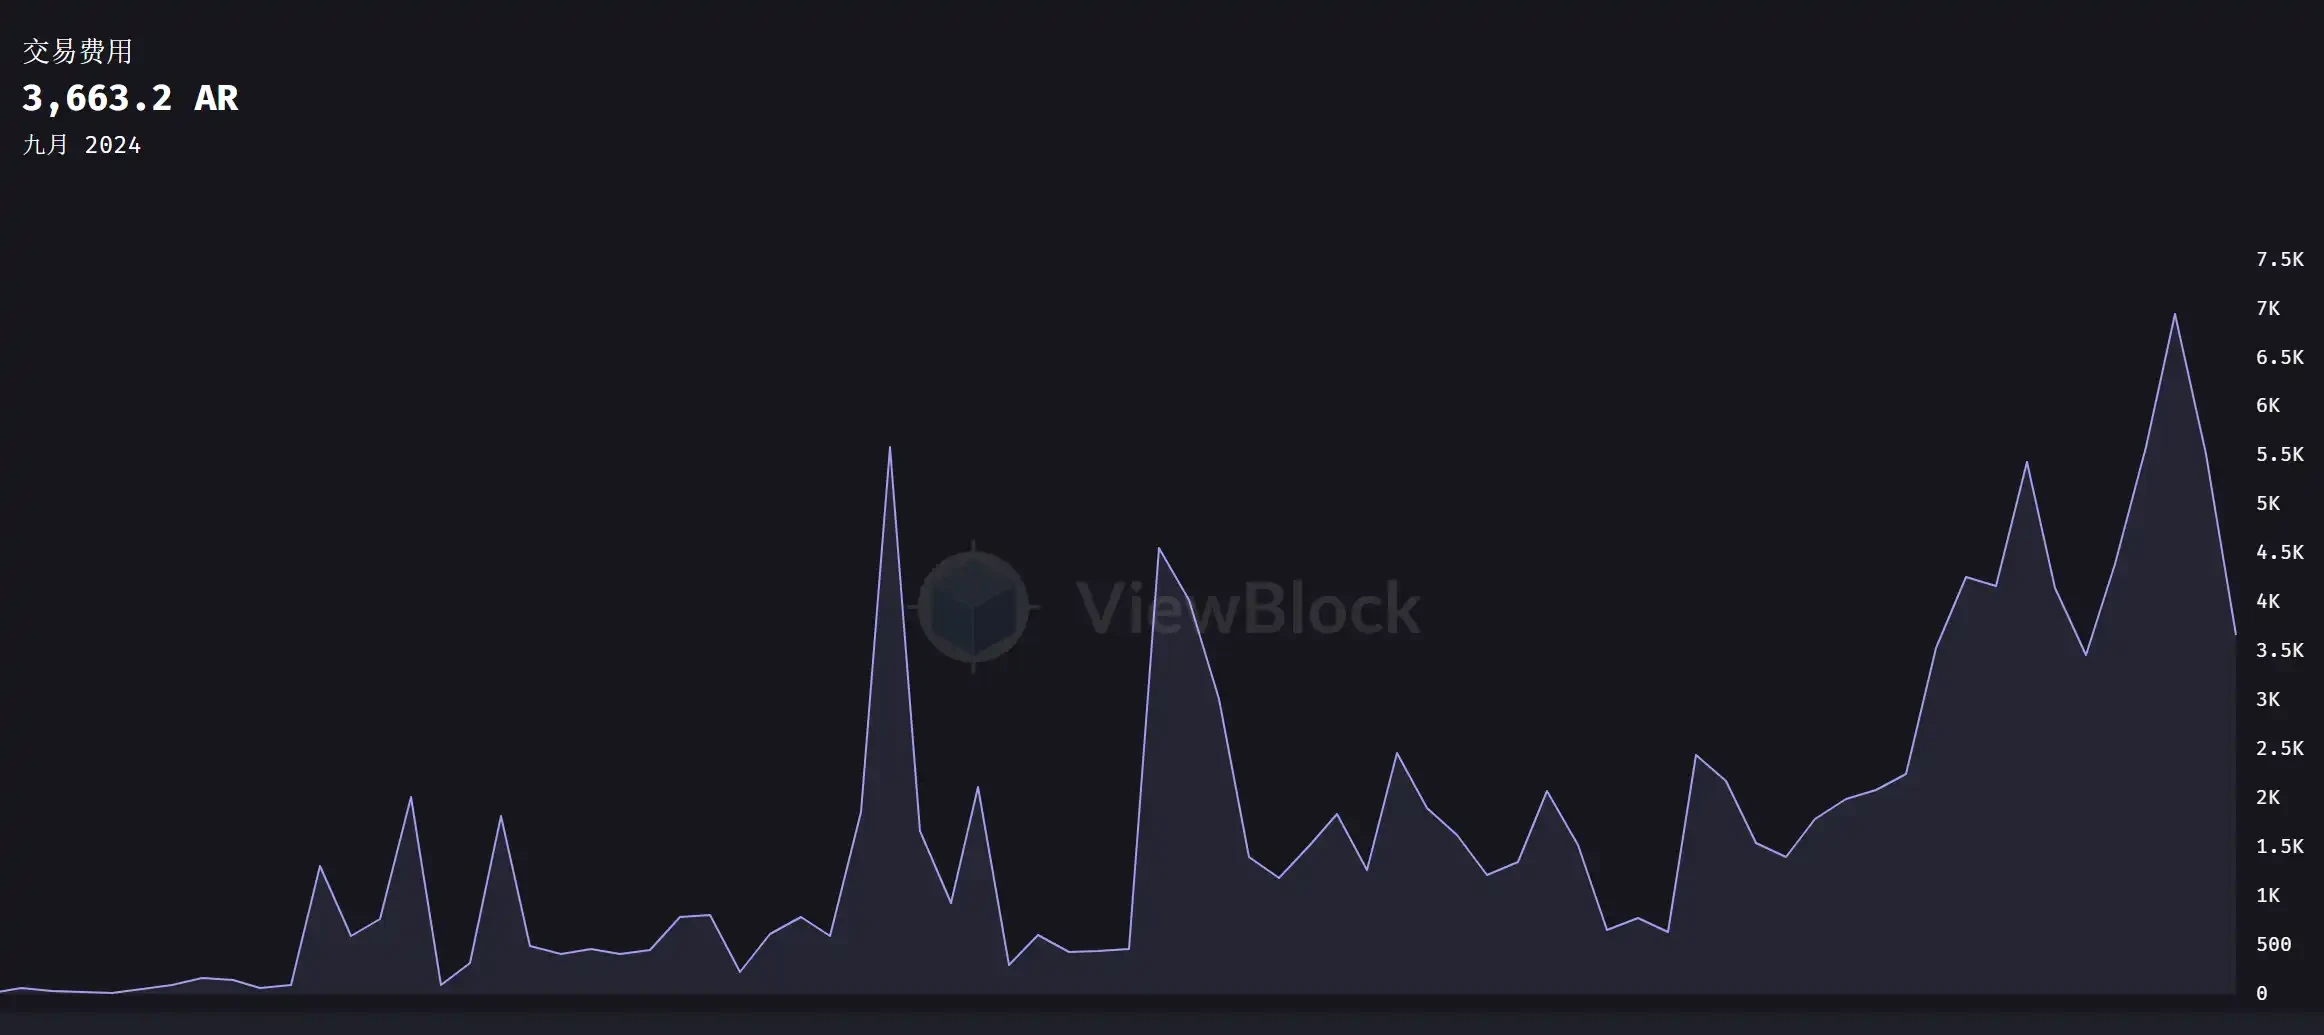
Arweave coin-based transaction fees, data source: ViewBlock
For investors of $AR tokens, $AR assumes the basic payment function of currency. Arweaves native token is $AR. On the one hand, $AR can be used as a means of payment to pay for data storage fees. When users store data on the Arweave network, they need to use AR tokens to pay a one-time storage fee. These fees ensure the permanent storage of data. On the other hand, miners receive AR tokens as rewards by storing and verifying data. For the token price performance, please refer to the previous analysis.
DA Data Availability
The large public chains we are familiar with usually adopt an integrated, monolithic design, with a single blockchain processing all transactions. However, whether it is social division of labor or Crypto, the development of refined division of labor seems to be inevitable. Since the development of modularization, data availability (DA) has become an indispensable component of Ethereum Lego blocks. Among them, Celestia, EigenDA and Avail are more representative. Due to the limited data of EigenDA and Avail, we selected Celestia for analysis.
Célestia
Celestias native token is $TIA. Celestia can support developers in developing new public chains and use $TIA to pay for GAS. Users can also stake $TIA to get rewards. Due to the popularity of $TIA airdrops, the benefit effect was obvious at the beginning of its launch, with a maximum of $20/TIA. After the market cooled down, the price of $TIA gradually returned to normal levels.
Celestias user profile is mainly concentrated in Rollup. L2s on the market use Ethereum for data availability and transaction settlement, which will result in high costs, while the use of Celestia will cause a qualitative change in costs. Taking Arbitrum and Optimism as examples, if Celestia is chosen instead of Ethereum, then every 100 million transactions will incur DA costs of $32,598 and $15,333 respectively, reducing the total cost by 89% and 92% respectively. 
Arbitrum and Optimism compare the cost savings of using Celestia鈥檚 DA on Ethereum. Data source: hashedem.substack.com
Modular projects like Celestia have brought great convenience to L2. The fundamental data shows that Celestias market share is gradually rising. According to Blockworks data, it has reached 44% of the market share. Although Celestias security cannot be compared with Ethereum, the market needs low DA costs more than security. The low-price strategy has effectively helped Celestia expand its market scale.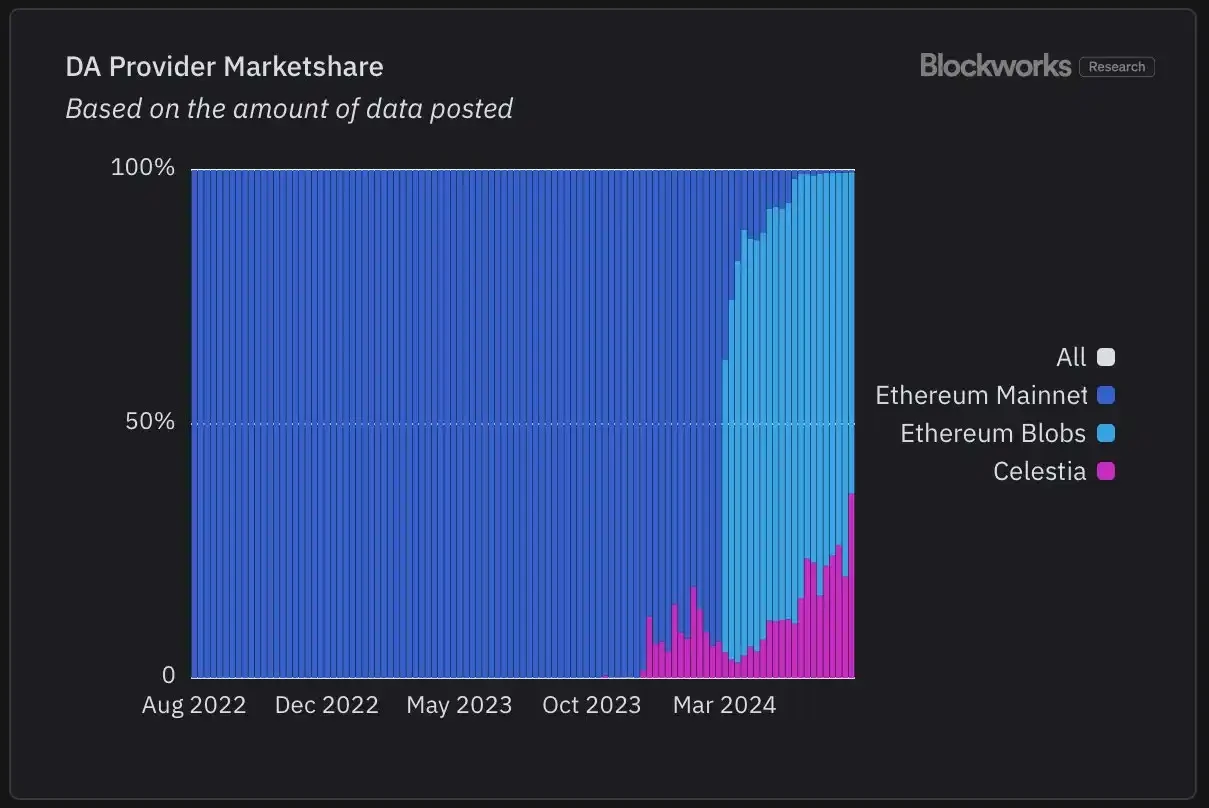
DA market share (according to Data post statistics), data source: Blockworks
As can be seen from the figure below, after adopting Celestia, the average cost of each project can be reduced to about 80%-90% of the original cost.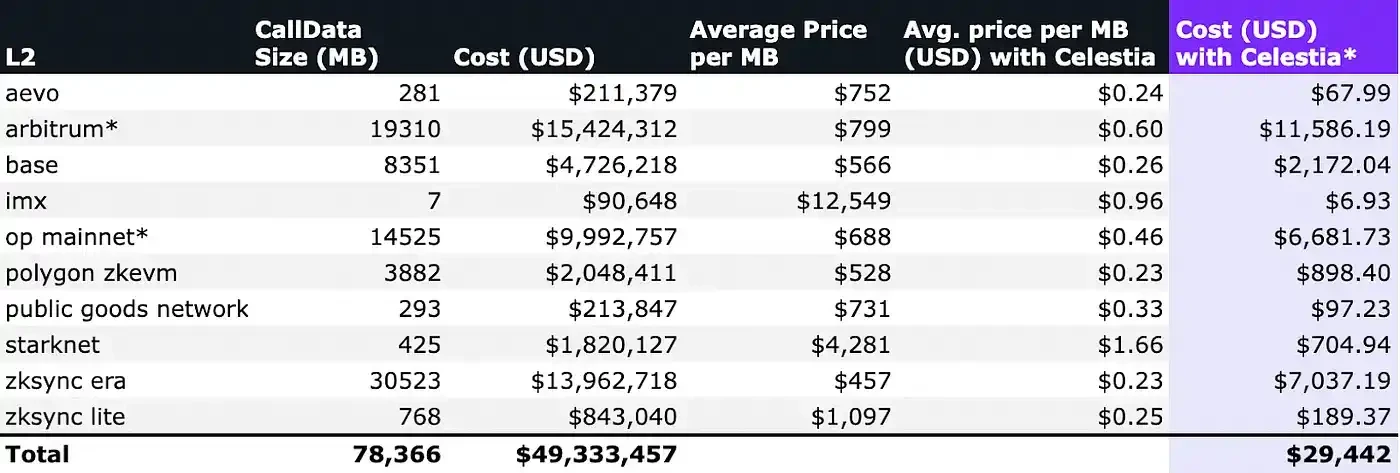
Cost savings of using Celestia in various projects, data source: numia.data
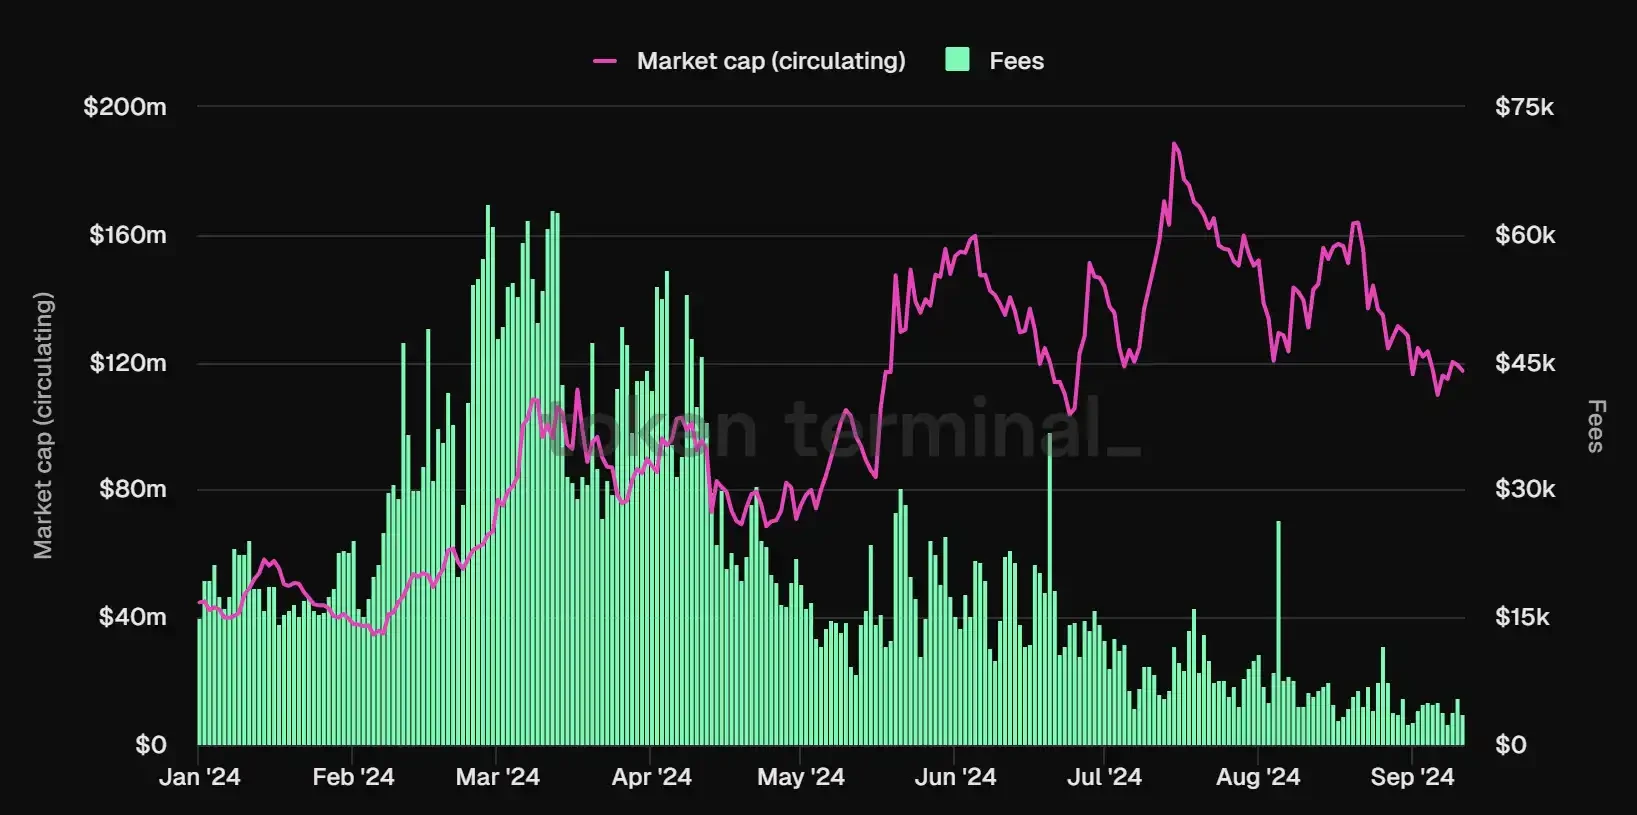
Since Celestia can provide DA services at such a low price, is Celestia still making money?
According to Aremis data, Celestias average daily uploaded data is about 3.5 K/MiB, and the data upload fee denominated in USD has decreased from $0.5/MIB in June and July to $0.3/MIB in August and September, plus the gas required for consumption. Therefore, Celestias potential annual revenue is actually lower, at about a million dollars.
Although Celestia is still profitable in terms of data, it is far from its valuation. According to Coingecko data, its FDV is 6.4 billion. Perhaps you don鈥檛 have an intuitive feeling about the FDV of 6.4 billion. Let鈥檚 compare it with Chainlink at the beginning of the article. Its market value is currently about 7 billion and its FDV is about 12 billion. For Celestia鈥檚 million-level revenue, it is obvious that the valuation of half of Chainlink is mixed with a lot of water. The actual commercial landing
The model and operations are not sufficient to support its inflated market value.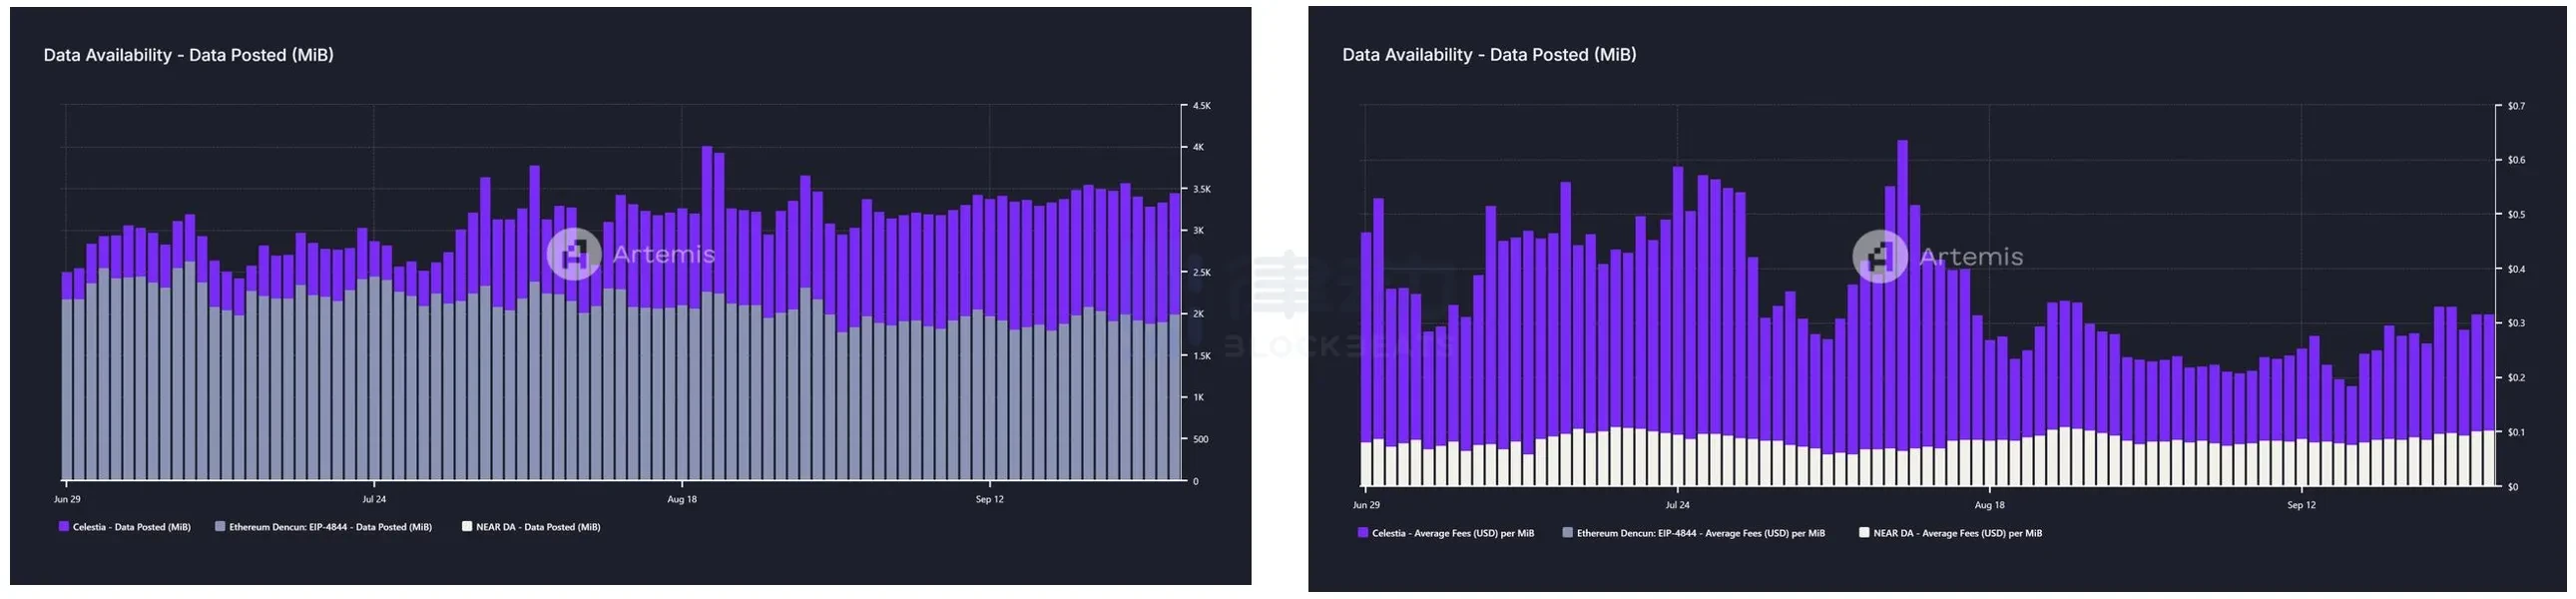
Left: Celestia/Ethereum Data Post; Right: Celestia/Ethereum average fee per MiB, data source: Artemis
On the other hand, only 26% of $TIA has been unlocked so far, and a large amount worth $1 billion will be unlocked on October 30. At the same time, TIA has no maximum supply limit. And it is worth noting that Celestia Foundation announced on September 24 that it had completed a $100 million financing led by Bain Capital Crypto, Syncracy Capital, 1kx and other institutions. The official announcement of the completion of the $100 million financing before the unlocking is intriguing.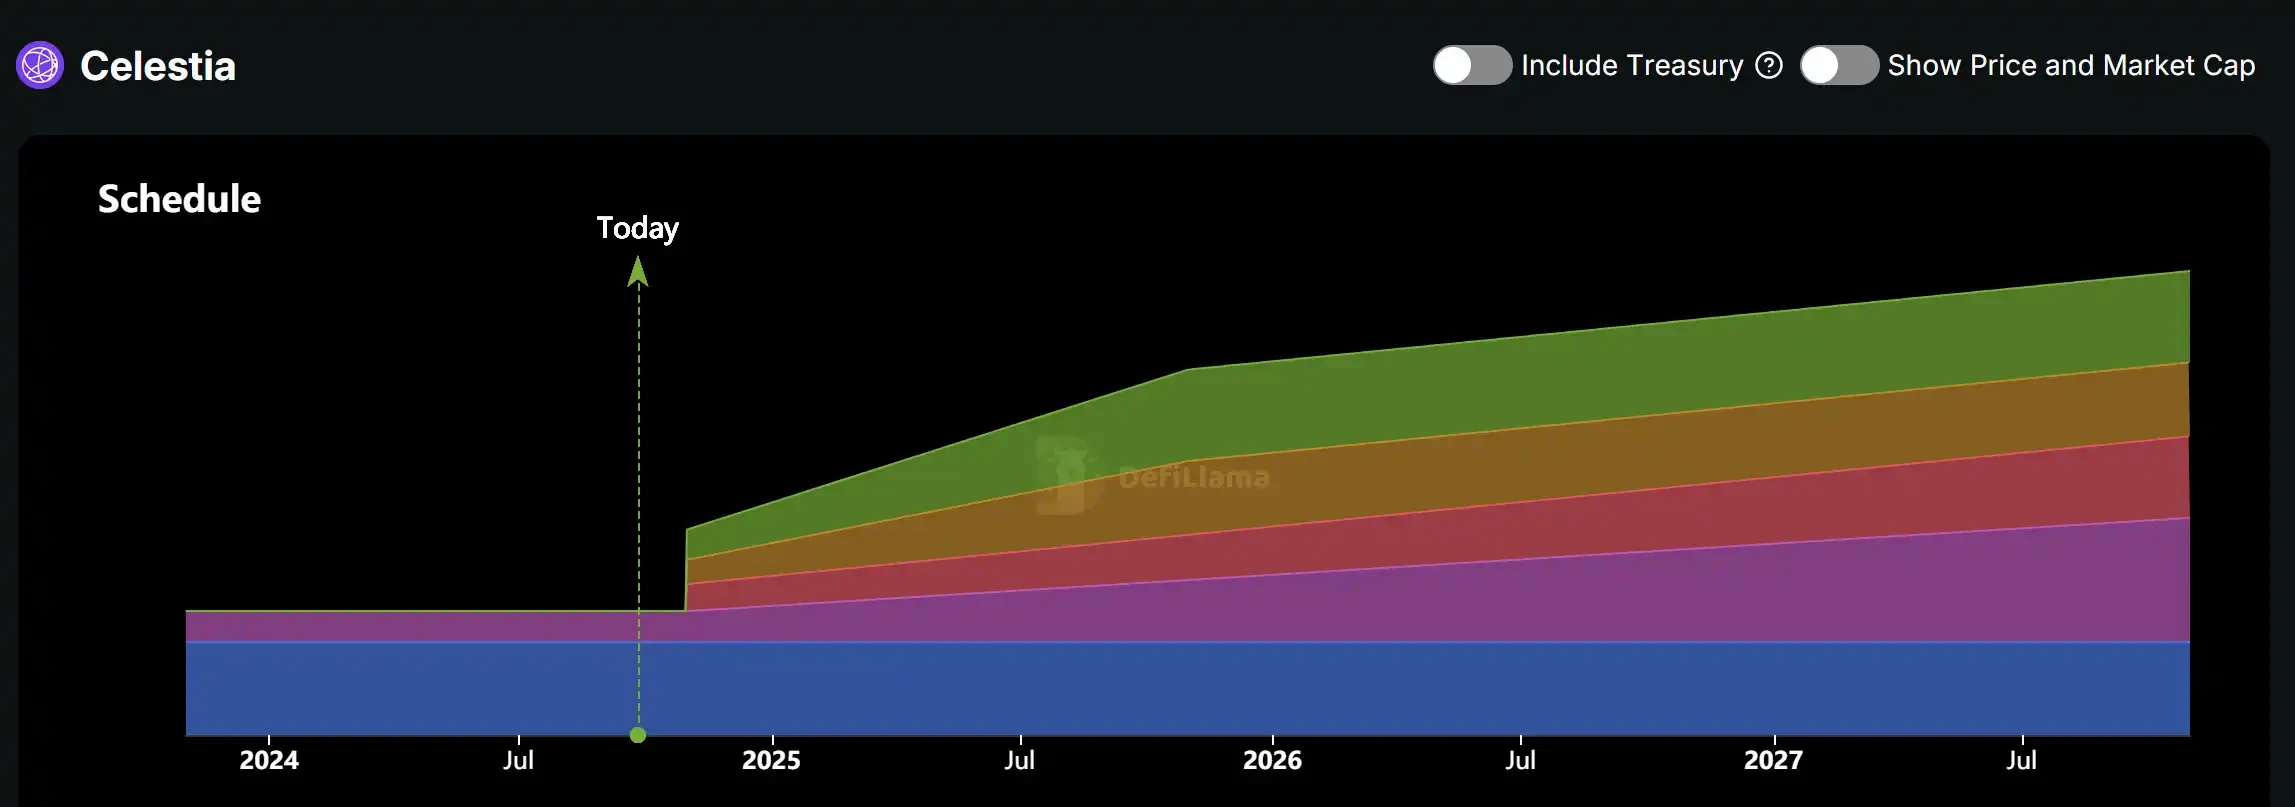
Token $TIA unlocking status, data source: DeFiLlama
For the DA track, although its main customers are various Roll-ups, the current mainstream L2 still uses the Ethereum mainnet as DA, and very few L2s choose Celestia. In addition to whether its own business model can be implemented, what determines the life and death of Celestia is the delicate relationship between Ethereum and various L2s. Choosing Celestia is tantamount to openly singing against Ethereum. In this cycle where people can only survive by banding together for warmth, the market economy does not seem to be that important.
L2s
As the main theme of this round of infrastructure construction, L2 has achieved lying down and making money compared to L1, which often burns money crazily. With the technical support of OP STACK, the development cost of L2 has been significantly reduced, and the one-click chain launch has been truly realized. Usually the cost of L2 is composed of sorters, DAs, development and other parts. After the Cancun upgrade, the GAS of L2 has generally decreased by 50%-90%. While the market enjoys the advantages of L2s low GAS, it has gradually discovered the shortcomings of L2. Do we really need so many L2s? With this question in mind, we divided them according to technical principles and market value, and selected Arbitrum, Optimism, Base of the OP series and Starknet and zkSync of the ZK series for analysis.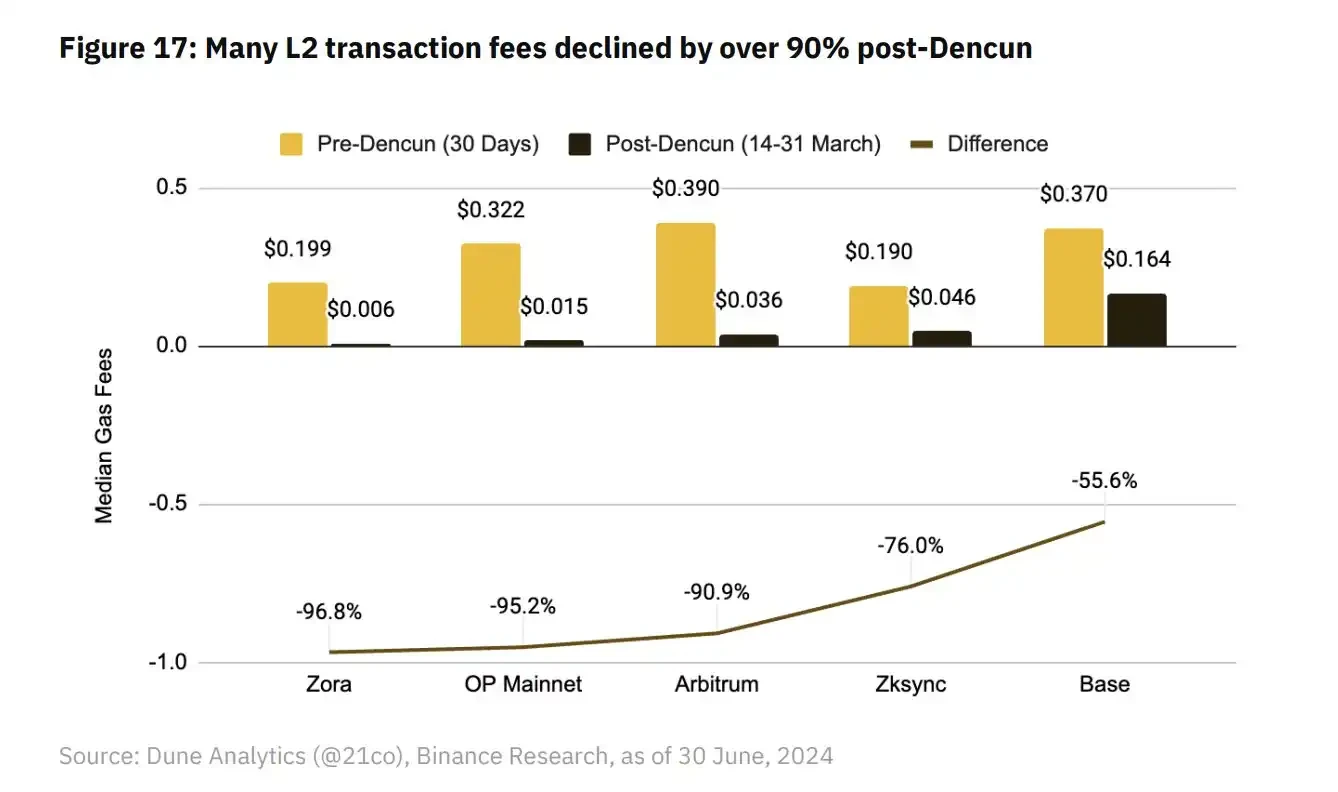
Comparison of transaction fees before and after the L2 Cancun upgrade, data source: hashedem.substack.com
Arbitrum
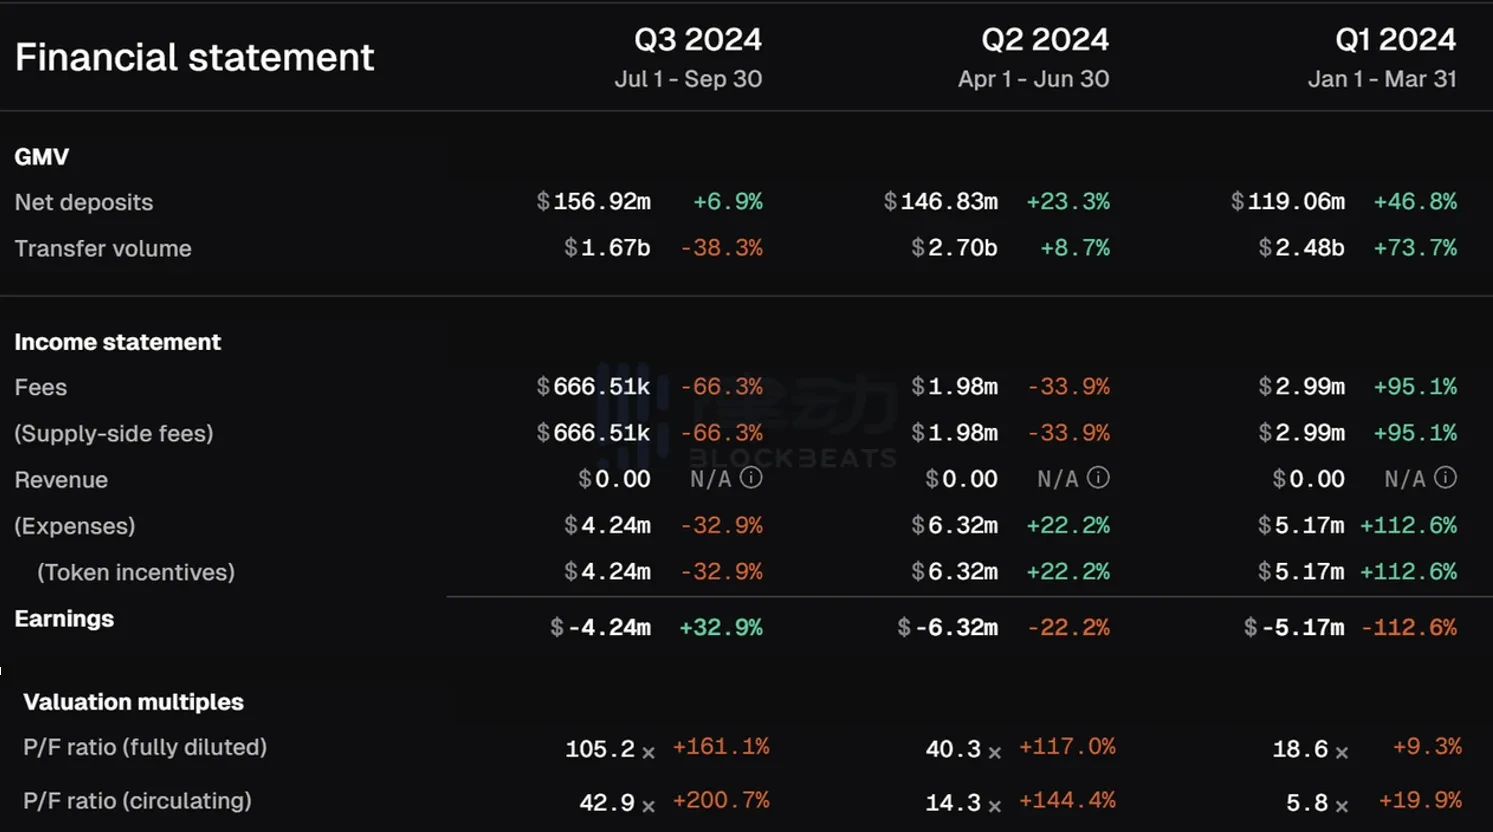
Specifically, Arbitrums revenue experienced a sharp drop after Q1. Compared with Q1s $27.38 million, its Q2s $7.37 million and Q3s $3.34 million figures are dismal, partly due to the sluggish market environment during Q2 and partly due to traffic competition from other L2s.
It is worth noting that due to the Cancun upgrade, Arbitrums costs were greatly reduced, so the net profit only fell by 7.3%. Compared with most other infrastructure projects that often saw a 70% profit drawdown, Arbitrums performance is far better than most of its peers.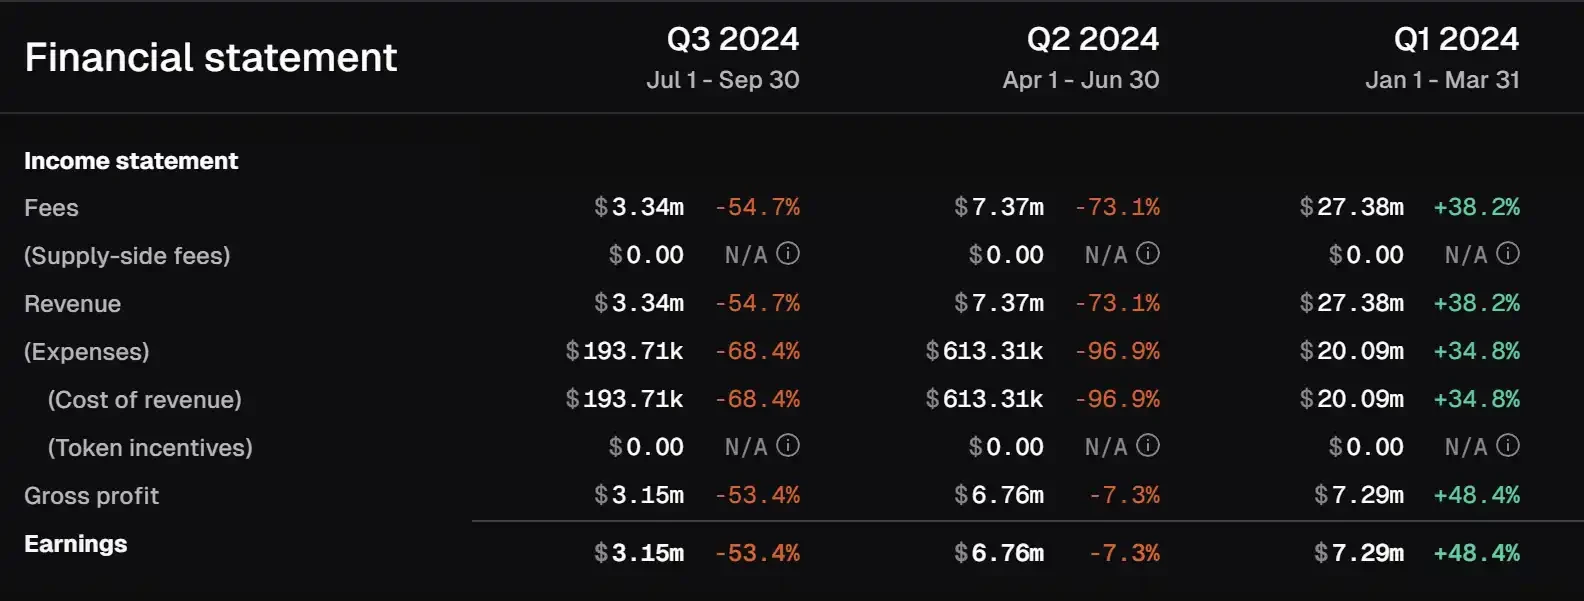
Arbitrum鈥檚 financial indicators change, data source: Tokenterminal
As mentioned above, the biggest expense of L2 is paying DA and settlement costs to L1. Taking Arbitrum as an example, the L1 cost of processing 100 million transactions reached $25,000 per month. Of course, it would be lower if Celestias service was used. If GAS covers these costs, then running L2 only needs to consider how to reduce the sequencer and initial development costs. When these costs are low enough, L2 is a rent collection business that makes money easily, and this is indeed the case.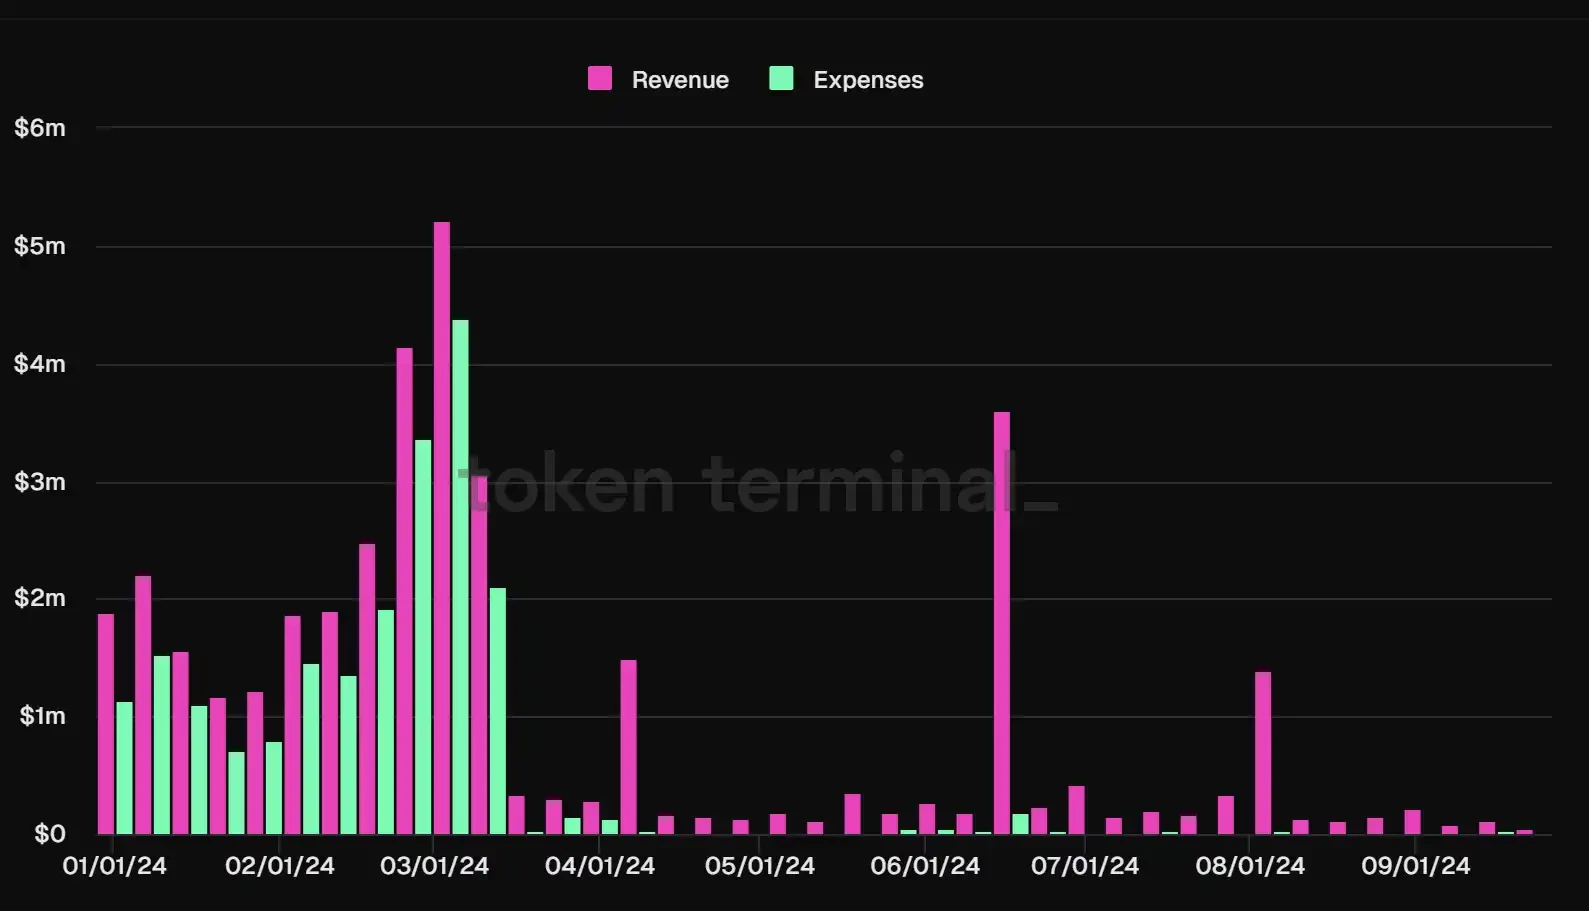
Arbitrum revenue and expense statistics, data source: Tokenterminal
The user bottleneck has always been a shackle that restricts its development. Arbitrums number of active users has been difficult to break through after reaching 10 million. Now, as the market cools, the number of monthly active users has also dropped to around 2.8 million. On the one hand, Arbitrum is likely to be overtaken by Base. On the other hand, Arbitrums ecosystem is not only difficult to attract incremental users, but also needs ecological innovation to activate existing users.
Arbitrum monthly active user data, data source: Tokenterminal
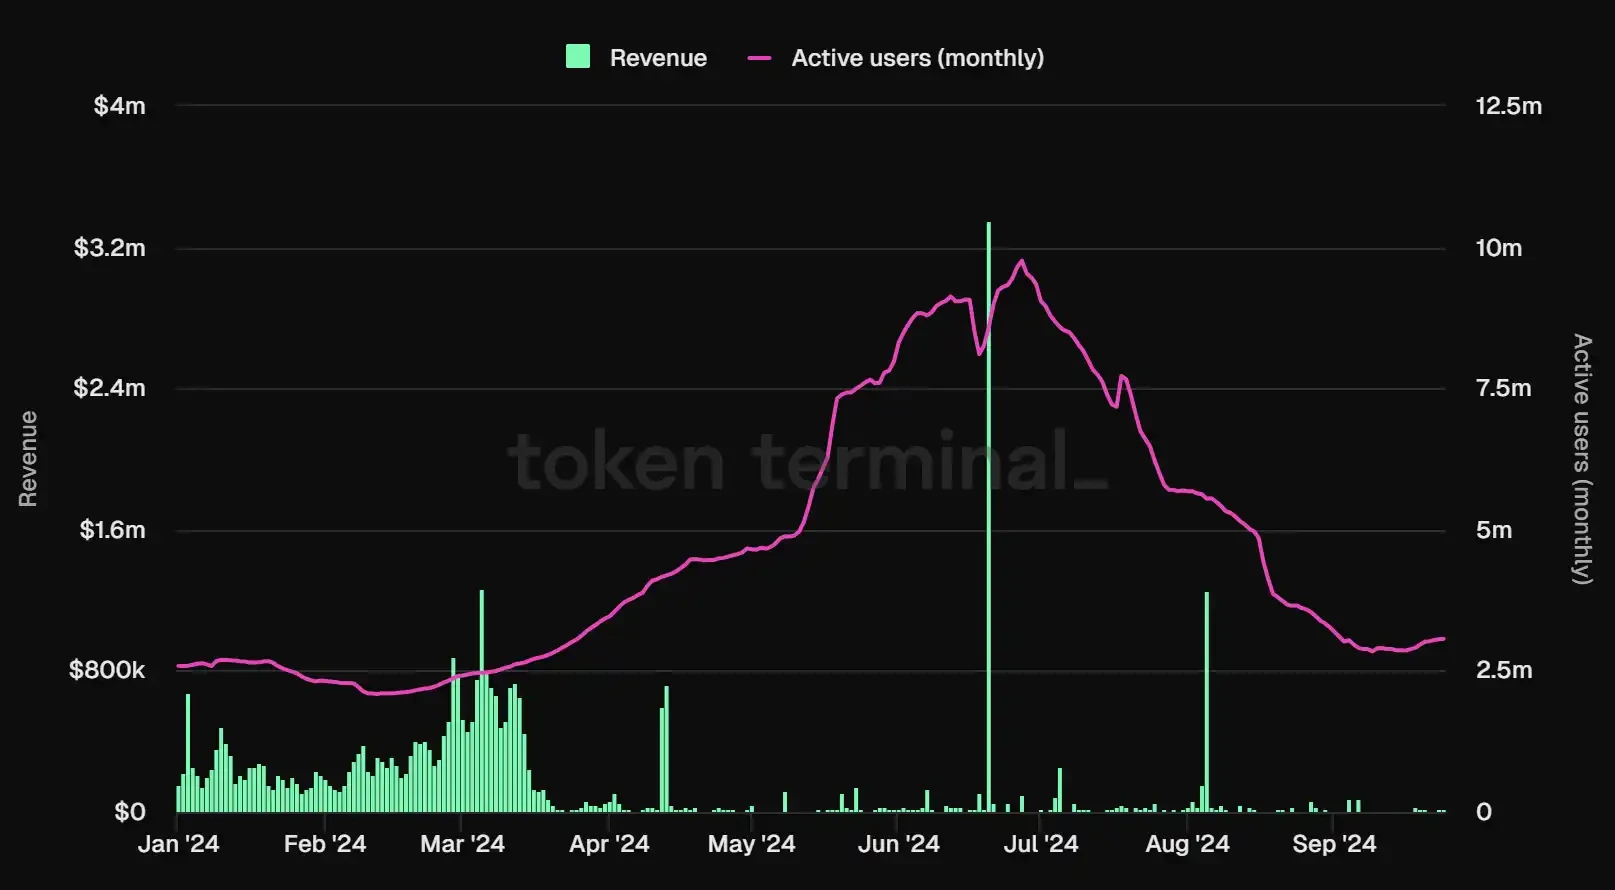
Optimism
OPs overall operating conditions are similar to most of them. Its revenue peaked at $18.83 million in Q1, and was halved in Q2 and Q3, falling to $8.95 million and $3.32 million respectively. Although from the perspective of political correctness, the Optimism project team has a close relationship with the Ethereum technical community and foundation, representing the successor of Ethereums will in L2, and is more orthodox than Arbitrums Ivy League circle. However, the correct answer given by the market is not Optimism: Arbitrum is on par with it, and Base, which will be introduced later, is better.
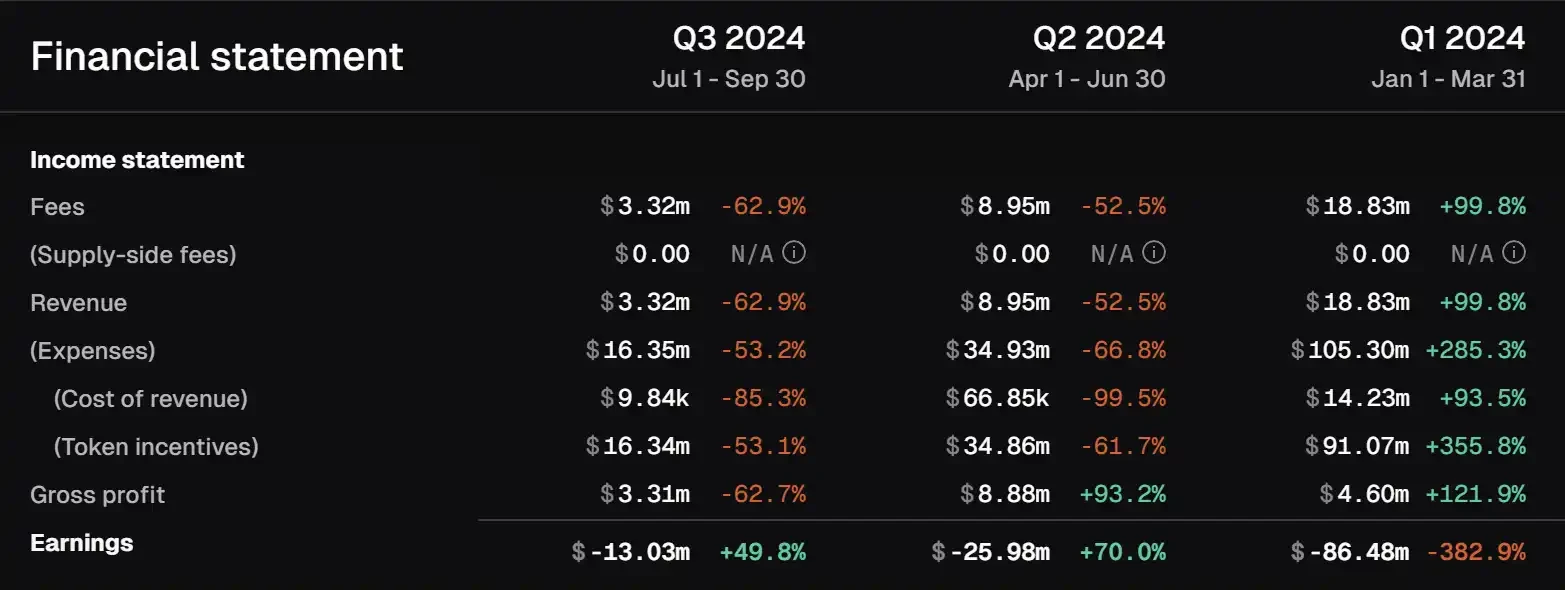
Changes in Optimism鈥檚 various financial indicators, data source: Tokenterminal
It is worth noting that Optimism and Arbitrum have different retained earnings. Although its on-chain net income is increasing, after considering the impact of token incentives, Optimism is unable to make ends meet. According to the U-standard pricing, in the first three quarters of this year, it needs to pay $91 million, $34 million and $16 million in token fees, which is far higher than its operating costs.
Optimism on-chain net income, data source: Dune
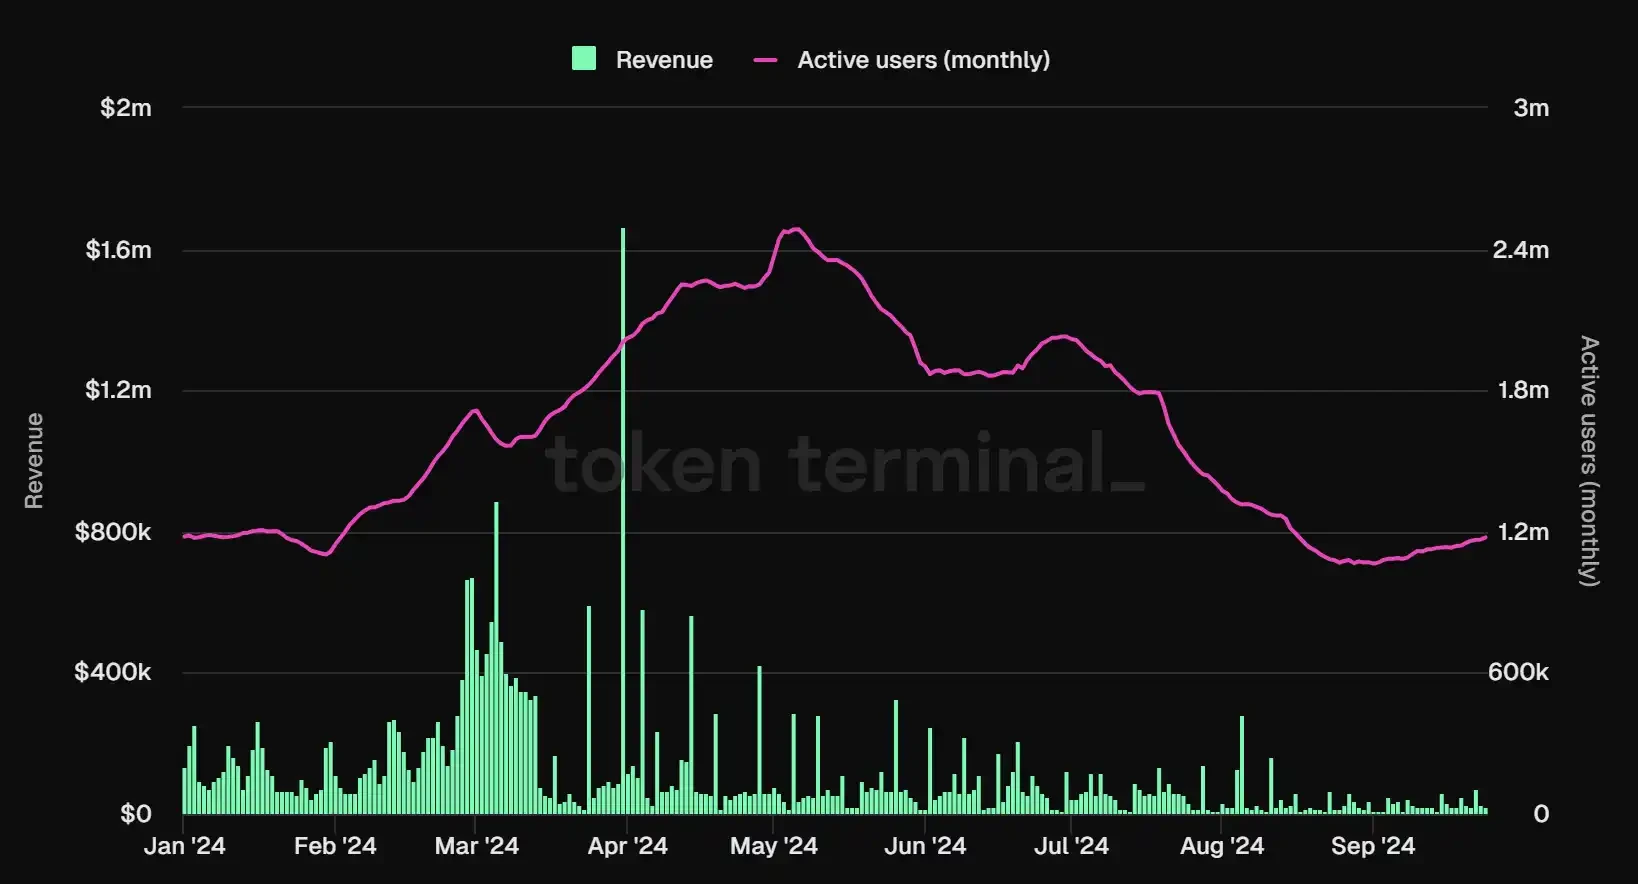
In terms of active user data, although the maximum number of active users of Optimism is only 1.6 million, which is not as good as the 10 million data of other OP series L2, its lower limit is very stable, and the stable decline is around 1.2 million. Compared with its fellow sufferers of the ZK series, the overall user data of the OP series is much better, not only the ceiling is higher, but also the lower limit can be dragged down.
Optimism monthly active user data, data source: Tokenterminal
For Optimism, the overall atmosphere and positioning of the team are more tech-oriented. The OP Stack developed by OP Labs has helped many L2s to launch chains with one click, and has also been further upgraded to OP Succinct and ZK Stack to grab traffic. As for whether the vision of SuperChain can be realized, the answer needs to be left to the team and the market.
Base
Backed by the exchange CoinBase, Base was born with a silver spoon in its mouth from the beginning, and its fundamentals are much healthier than other L2s. As a rising star, it has now become a top player on the L2 chess table. In Q1 of this year, Bases transaction fees soared 400% month-on-month. Prior to this, Base relied on MEME and social to rise to the sky. Due to its low transaction fees, Base followed Solanas old path and caused a MEME craze. BALD, BRETT, and DEGEN successively ignited BASEs MEME fever. Subsequently, BASE integrated social applications friend.tech and Farcaster, becoming a veritable Social-L2.
With this combination of measures, Base was able to catch up with Arbtrum and Optimism. Its Q1 revenue reached 27M, which was the same as Arbitrum. Despite a 70% drop in Q3 revenue, its net profit was still as high as 5.84 million US dollars.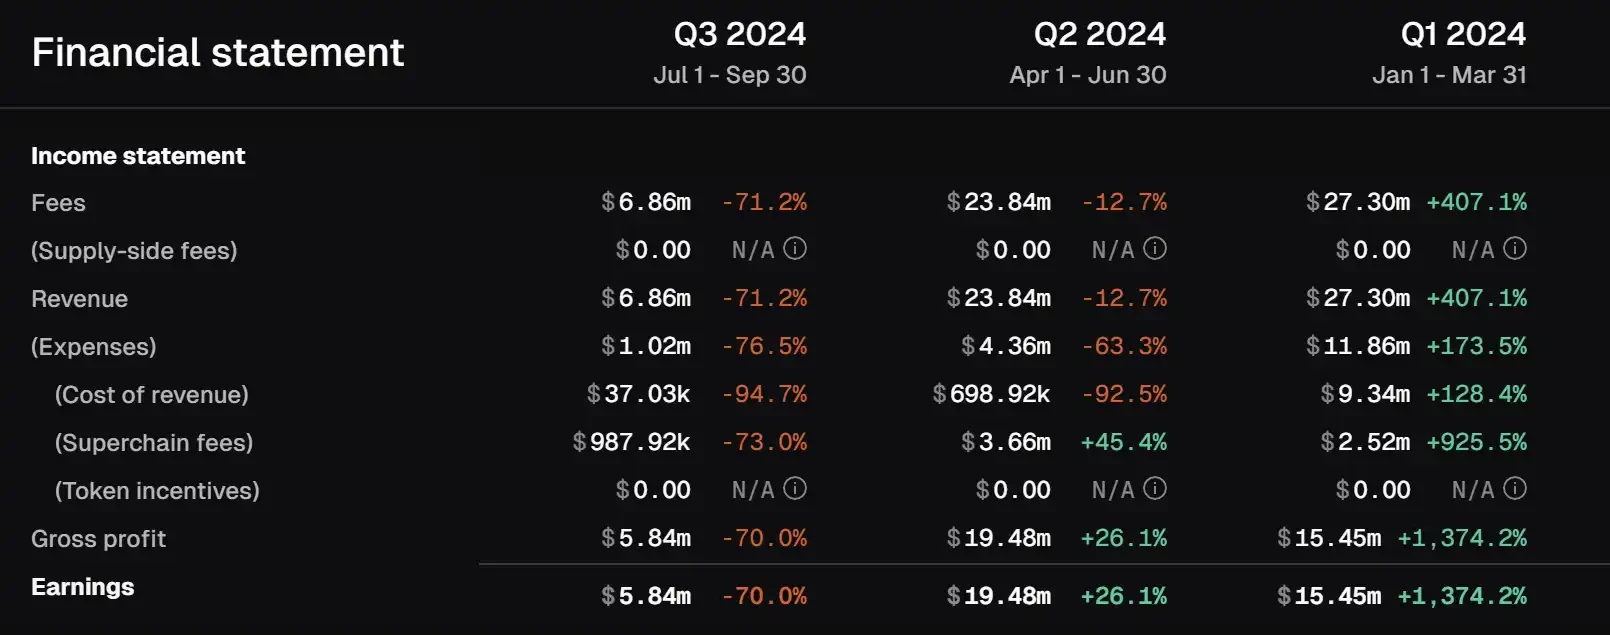
Base changes in various financial indicators, data source: Tokenterminal
From the perspective of TVL, the success of Base depends on two social fissions that are difficult to replicate. From the initial tepidity to the influx of a large number of new users and funds after the launch of Friend.tech, Base has been pushed out of the novice village, and its TVL has reached the level of 500 million. Subsequently, in March this year, the GAS of the Cancun upgrade was reduced, and Base launched the same MEME craze as Solana. On-chain users began to become active, and with the promotion of Social-Fi such as Farcaster, Bases TVL has reached the level of 1.5 billion. So far, Bases TVL is still steadily increasing.

Base TVL growth, data source: DeFiLlama
Unlike other L2s, user data is not a bottleneck restricting the development of Base. Base has been steadily improving in terms of user data. The number of monthly active users reached 20 million in September, surpassing other king L2s. Relying on CoinBases huge user traffic, active users, which are the most difficult to capture for other L2s, have become Bases unique moat.
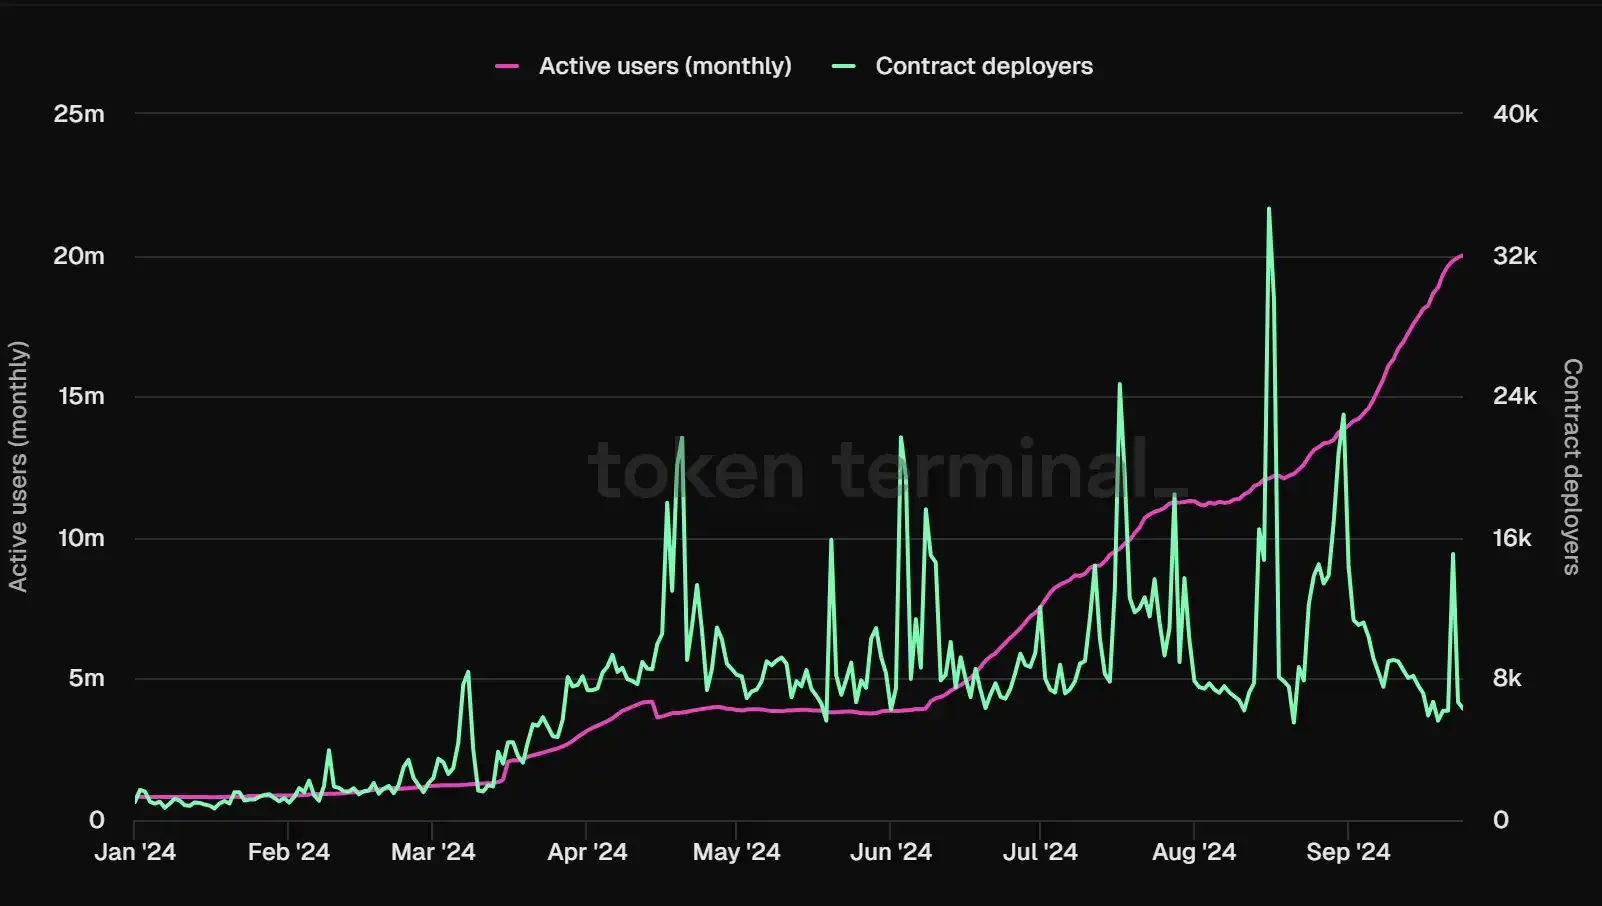
Base monthly active user data, data source: Tokenterminal
Similarly, Base is a sure win. In addition to the fact that the Base project team knows how to market and how to play, and maximizes traffic, Bases beautiful financial data is also due to the support of Coinbase. As the only sorter on Base, Coinbase has compressed the costs to the lowest level except for DA. Therefore, according to the data from TokenTerminal, except for a few points in time, Bases revenue far covers its costs most of the time.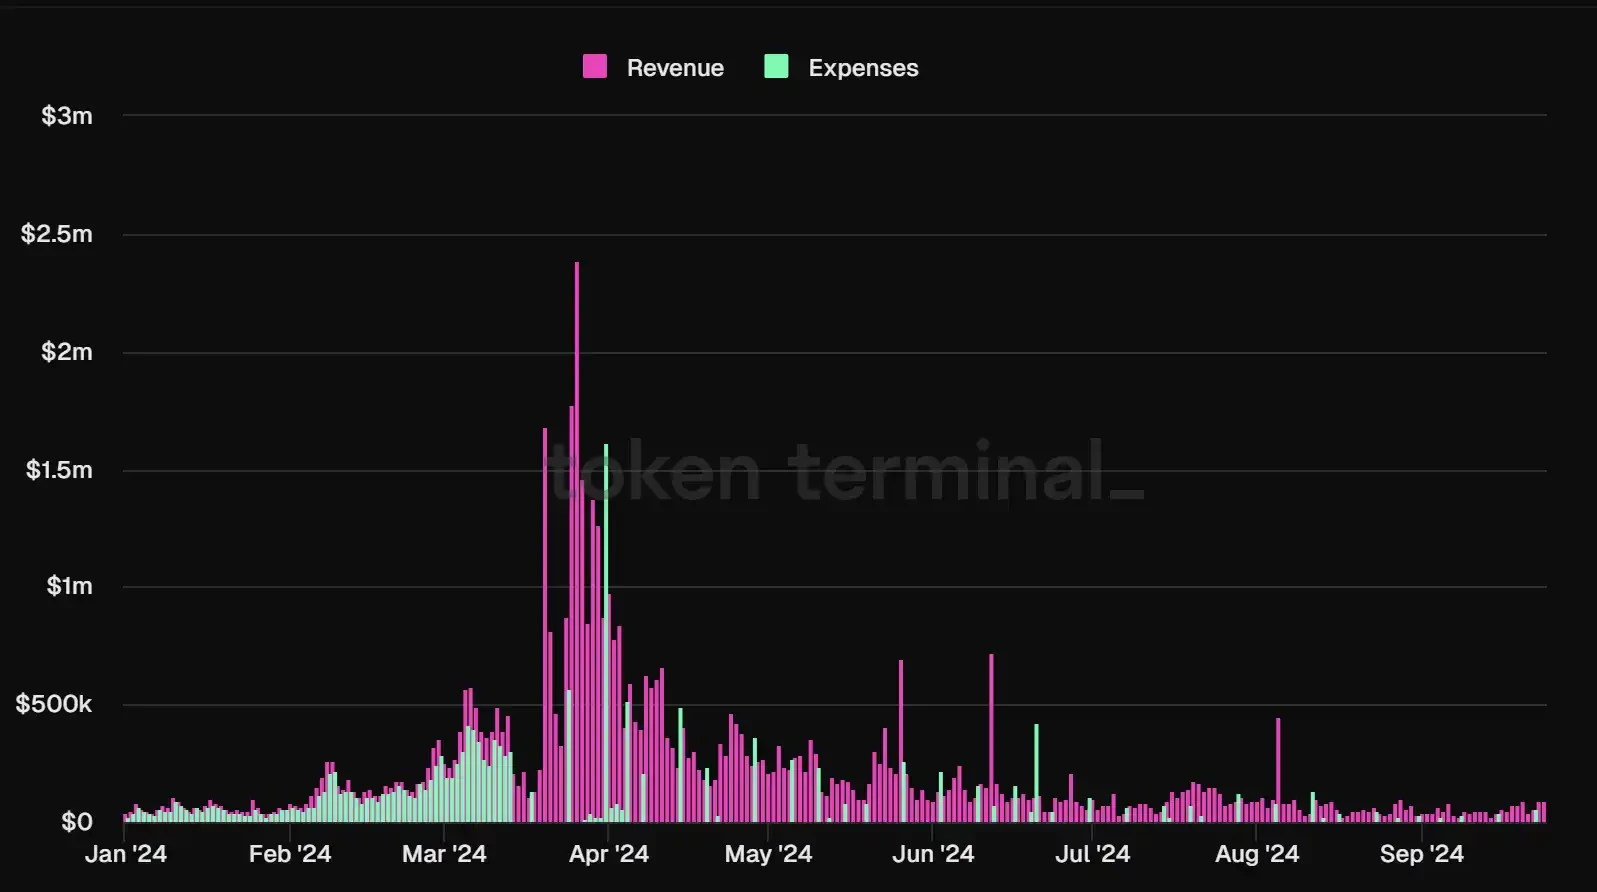
Base income and expenditure, data source: Tokenterminal
Starknet
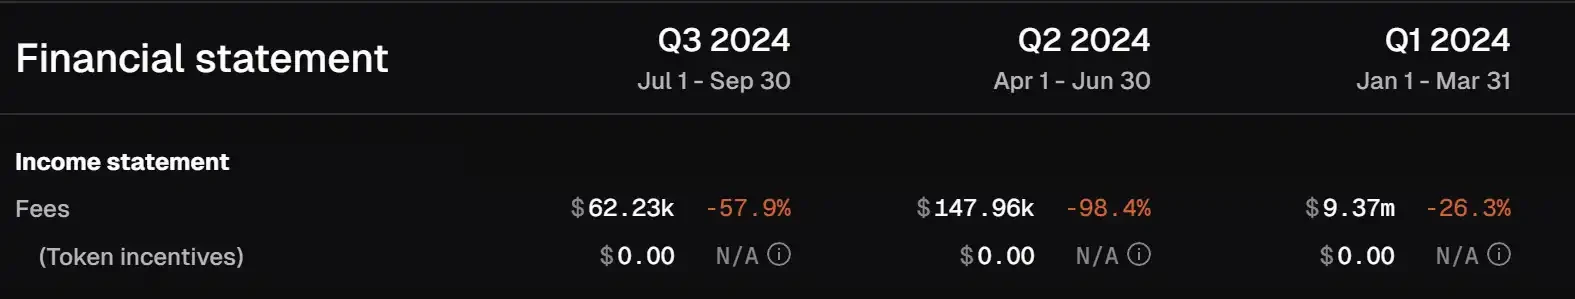
As the crown prince of ZK technology, Starknet has always been highly sought after, but its fundamentals have been disappointing. Since entering 2024, Starknets revenue has only fallen and not rebounded, just like its coin price. Among them, the decline in Q2 2024 was the most serious, with only $147,900 in transaction fees generated compared to $9.37 million in Q1.
In addition to the negative impact of the depressed market environment in Q2, EIP-4844 and the Cancun upgrade are another important factor. Although the Cancun upgrade brings extremely low DA costs to L2s using Blob, it also brings a drop in network transaction fees. Since the Cancun upgrade, Starknets on-chain transaction fees have been sluggish. From the figure below, it can be seen intuitively that Starknets revenue has been sluggish since Q1.
Starknet transaction fee quarterly changes, data source: Tokenterminal
From the users perspective, Starknet has gradually become a ghost town. In January 2024, Starknet broke through the bottleneck of 1.2 million monthly active users, and then reached a peak of 2.2 million. After that, active users began to leave in batches, and the user bubble was finally punctured. Today, the number of monthly active users is stable at around 130,000. Whether in the first or second level, Twitter or group chat, Starknets presence has gradually faded.
Starknet monthly active user data, data source: Tokenterminal
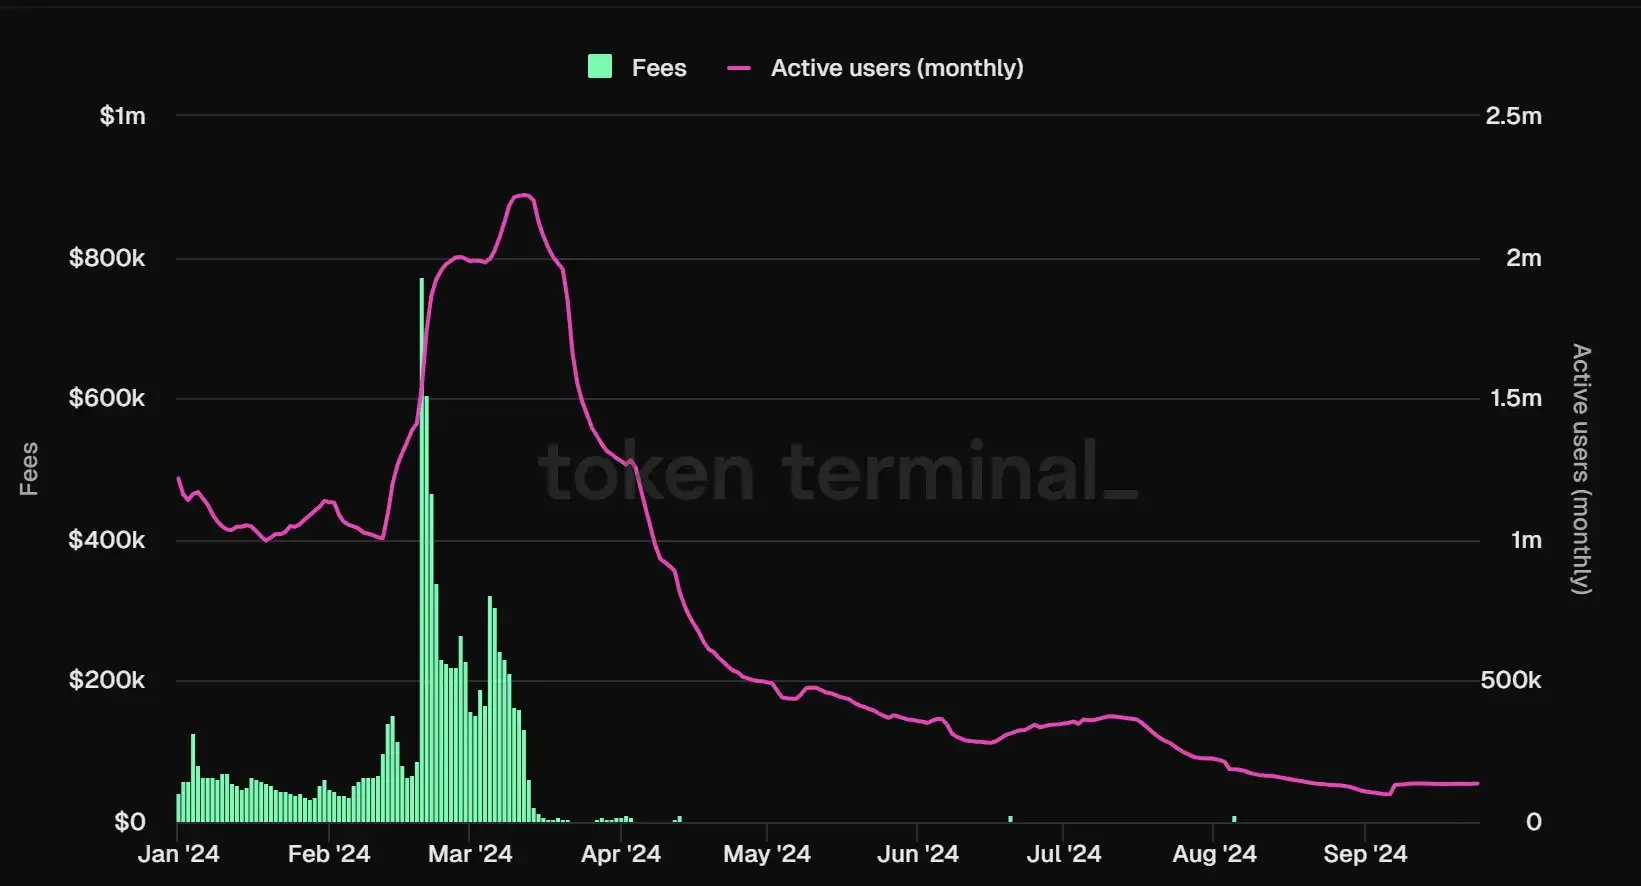
zkSync
zkSync, the last of the L2 Four, has attracted much attention from the market and public opinion from its debut to its listing on Binance. zkSync released a testnet in 2021, but development progress was slow, and the mainnet was not officially launched until 2023. Although zkSync has top capital platforms, its ecological construction is not as good as expected. There is no phenomenal dapp that can even attract public attention, which is quite loud thunder, little rain. Before the issuance of its native token $ZK on June 17 this year, the main flow of the market was also focused on how to brush data for zkSync to win airdrops.
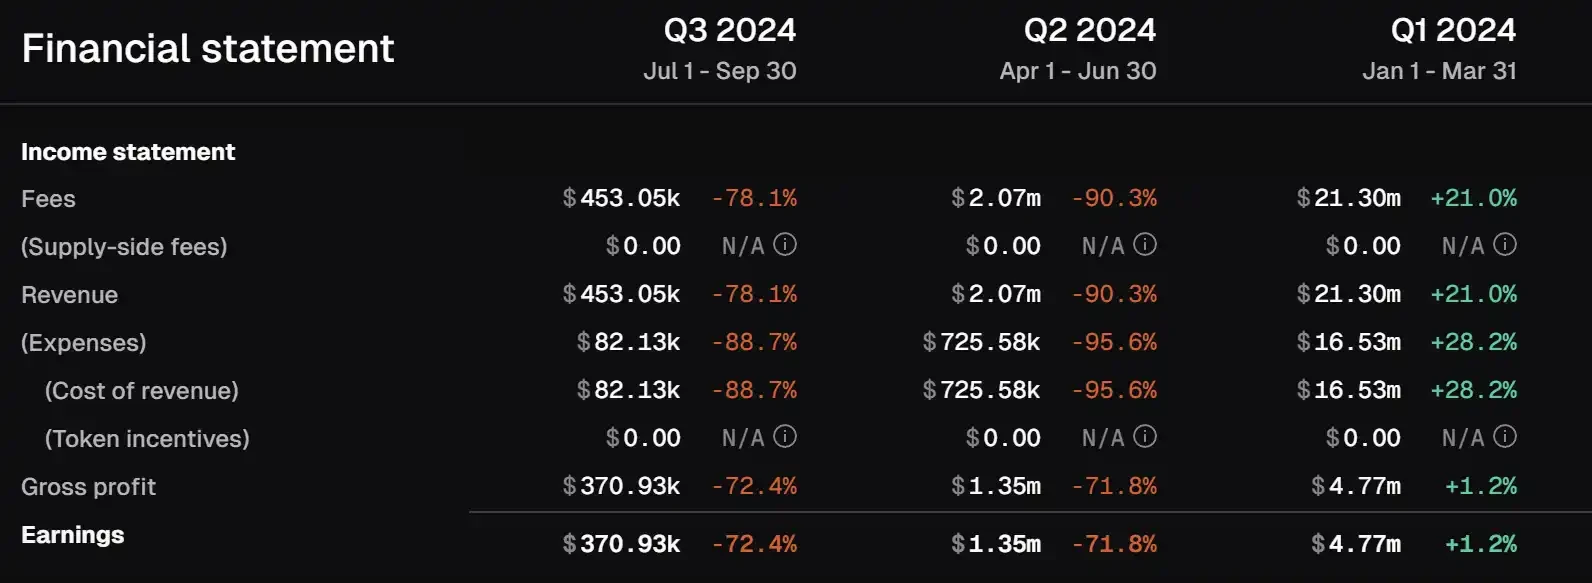
Changes in zkSync鈥檚 financial indicators, data source: Tokenterminal
Although zkSyncs revenue is as dismal as most L2s, it only means that zkSync is making less money, at least it is still at the level of profit withdrawal. According to Tokenterminal data, its overall revenue can still cover its expenses. However, its net profit is at a lower level than other L2s, falling from $4.7 million in Q1 to $370,000 now.
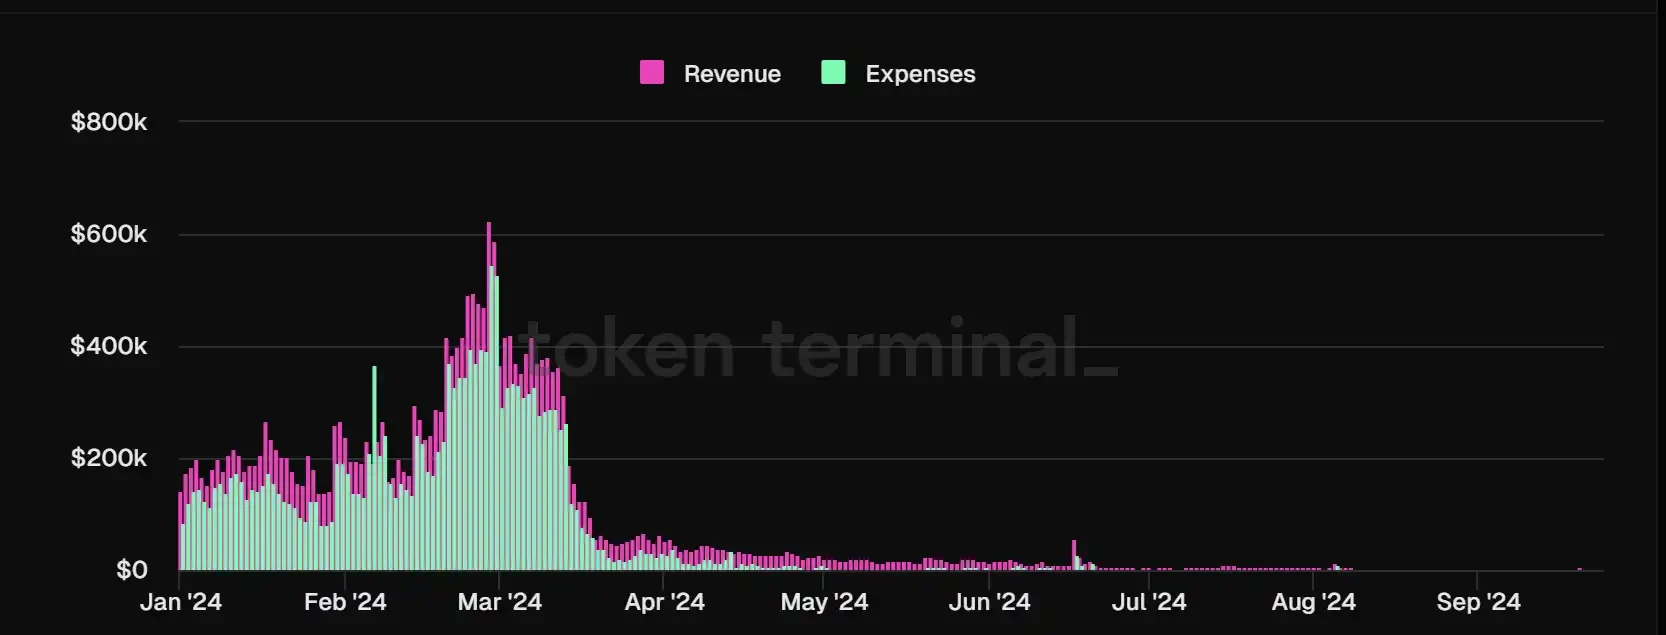
zkSync income and expenditure, data source: Tokenterminal
It is worth noting that in July this year, zkSync suffered a double blow in revenue and the number of developers, but its active users rebounded, increasing from 2 million in June to 3.8 million, and then the monthly active users plummeted to 800,000. For zkSync, it not only needs to consider how to build its own ecosystem to attract funds and users, and strive to get more chips on the L2 battle table, but also pay attention to how to avoid the vicious cycle brought about by its own empty city.
zkSync monthly active user data, data source: Tokenterminal
Obviously, zkSync has realized the problems of weak ecology and loss of existing users in the fierce L2 competition. zkSyncs TVL has doubled from 76 million to 140 million since September 20. The recent changes in TVL are mainly contributed by Venus Core Protocol, which increased by 2434% in one week. At the same time, zkSync has recently become the third L2 in terms of weekly active users, but there is still an order of magnitude difference with Arbitrum and Base. Although zkSync has been catching up recently, it still has a long way to go.
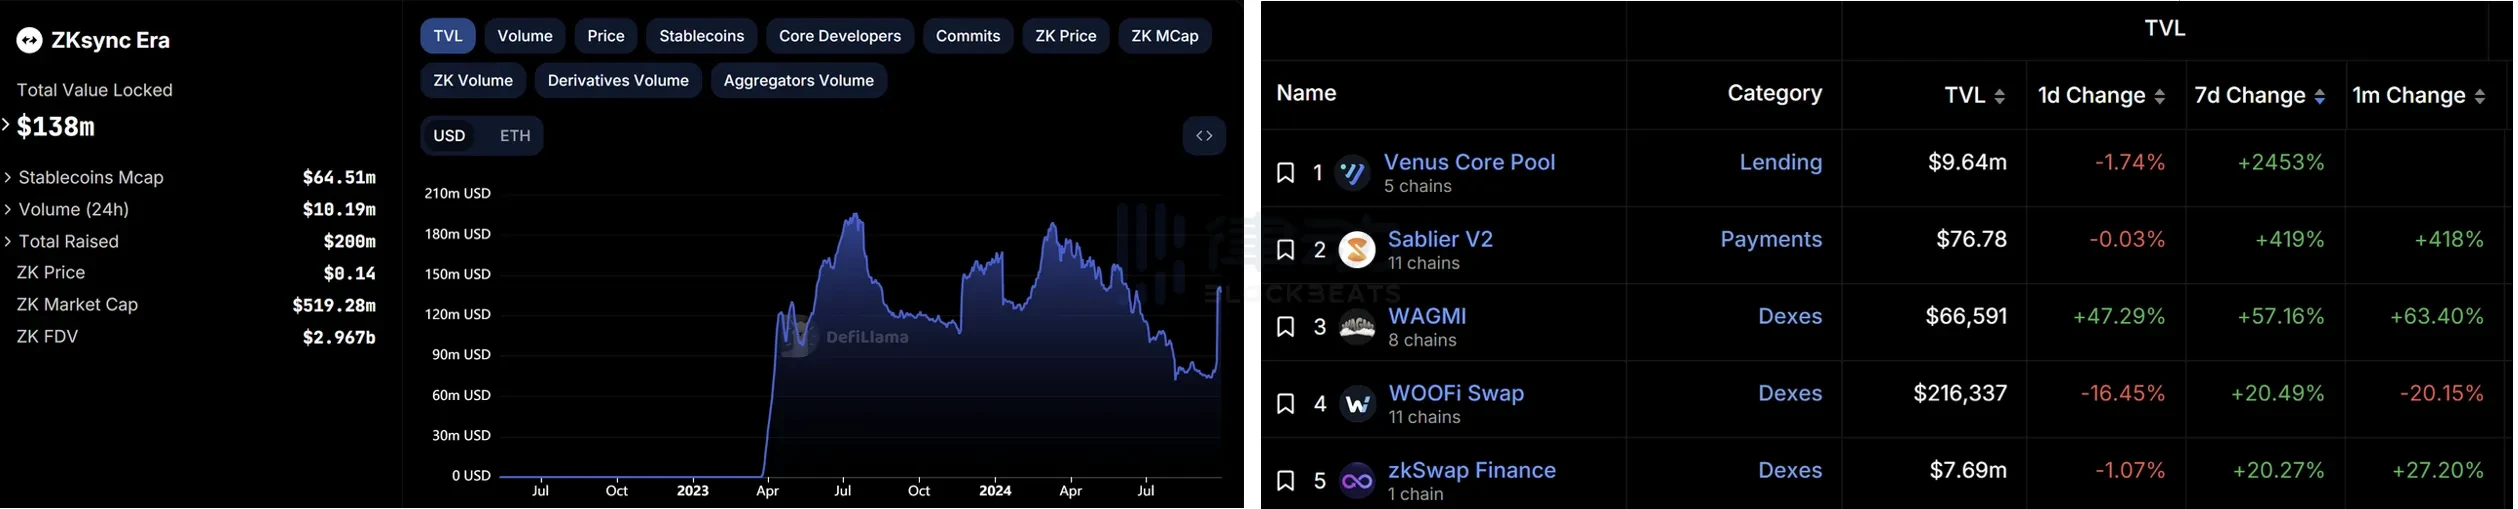
Left: zkSync TVL growth; Right: zkSync TVL distribution, data source: DefiLlama
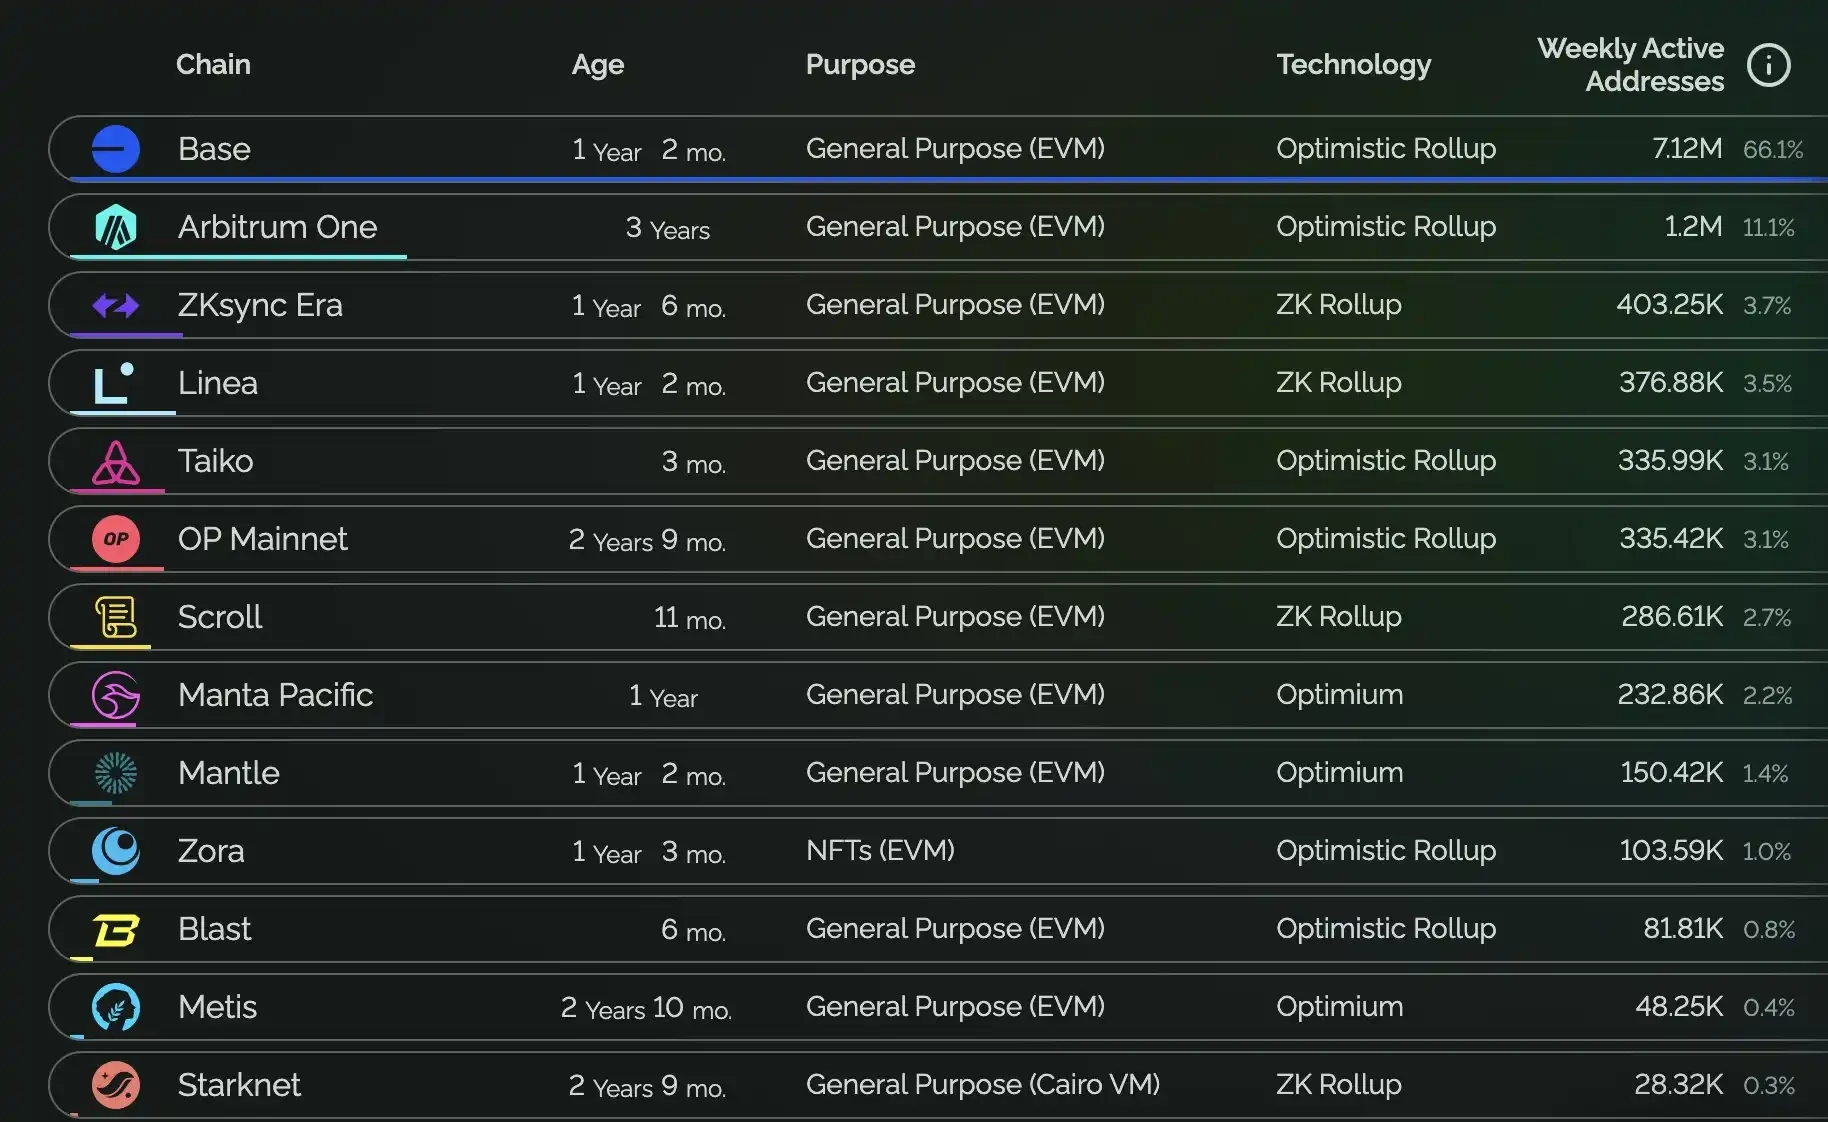
L2 weekly address activity ranking, data source: L2 BEAT
As for the token economics of the above L2, except for Base, which has not issued a coin, the native tokens of the remaining L2s almost only play a governance function. Although L2 is the right-hand man of Ethereum, users do not need to consume its native tokens in actual transactions, but still use ETH as GAS payment. This also determines that if each L2 does not develop an ecosystem that attracts users, it can only serve as a transit chain to save money. As the person with the highest voice in the Ethereum ecosystem, Vitalik recently issued an article advocating for the alignment of the entire Ethereum ecosystem. Now, in addition to considering the objective economic laws of market operation, the development of the L2 track has added many uncontrollable political factors.
Résumer
For infrastructure projects with huge current valuations, maintaining sky-high FDVs depends more on the imagination of their narratives. However, the current situation where the exaggerated valuations of infrastructure projects are inconsistent with their actual operating conditions will not only cause the market to fall into the bubble of the previous bull market, but also bring hidden dangers of the tragedy of the commons to Crypto, where everyone wants to make money by doing nothing.
This article is sourced from the internet: Who is actually making money in the infrastructure sector with overcapacity?
The information, opinions and judgments on markets, projects, currencies, etc. mentioned in this report are for reference only and do not constitute any investment advice. The crypto asset market after March 2024 seems to be passively becoming a second-rate performance with the theme of waiting. All the actors, creators and producers seem to have forgotten the plot, the plot and the original theme, and only craned their necks to wait for a certain audience to enter and whether there will be a hurricane tonight. From mid-March to the end of August, more than five months have passed, and the price of BTC has fluctuated repeatedly in the new high consolidation zone. During this period, the global market has experienced repeated and downward inflation, ambiguous and clear expectations for US dollar…