Rapport de recherche sur le sentiment du marché des crypto-monnaies (2024.07.12-07.19) : L'assassinat de Trump fait grimper le Bitcoin
Trump assassination drives Bitcoin surge
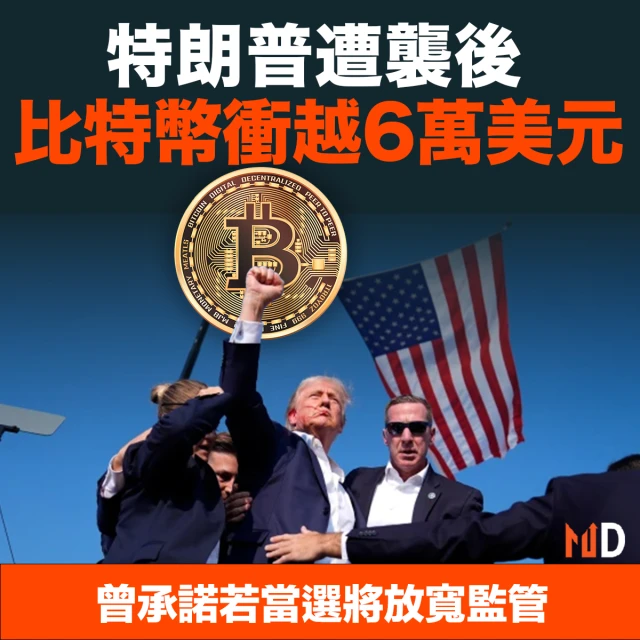
The rising probability of Trumps victory has made risky assets such as Bitcoin popular. In particular, the Republican Party mentioned in its latest campaign platform that if Trump takes office, it will end the suppression of cryptocurrencies, which has greatly boosted confidence in the cryptocurrency market.
The “Trump deal” is a hit.
After Trump was attacked over the weekend, a series of Trump-related assets such as U.S. Treasury yields and Bitcoin soared. This is all thanks to the fact that he survived the assassination attempt, and the American peoples support for Trump has soared.
Among them, Bitcoin rose for six consecutive days, with a total increase of 11.59% this week, reaching a high of US$66,000.
There are about 11 days until the next Fed meeting (August 1, 2024)
https://hk.investing.com/economic-calendar/interest-rate-decision-168
Analyse de l'environnement technique et du sentiment du marché

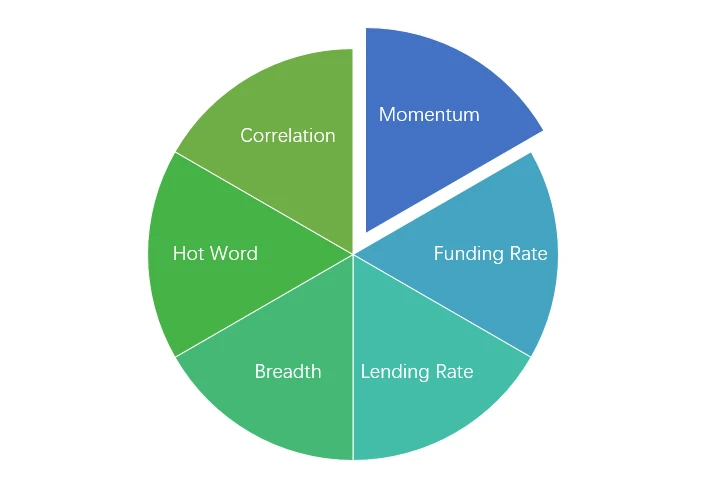
Composants d'analyse des sentiments
Indicateurs techniques
Tendance des prix
In the past week, BTC prices rose 11.59% and ETH prices rose 10.55%.
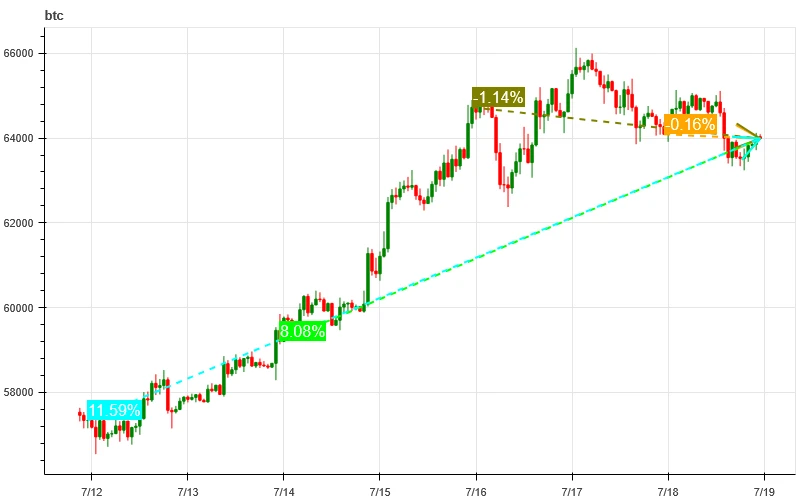
L’image ci-dessus est le graphique des prix du BTC au cours de la semaine dernière.

L’image ci-dessus est le graphique des prix de l’ETH au cours de la semaine dernière.

Le tableau montre le taux de variation des prix au cours de la semaine dernière.
Graphique de distribution du volume des prix (support et résistance)
In the past week, BTC and ETH formed a new intensive trading area as they rose to high levels and increased in volume.
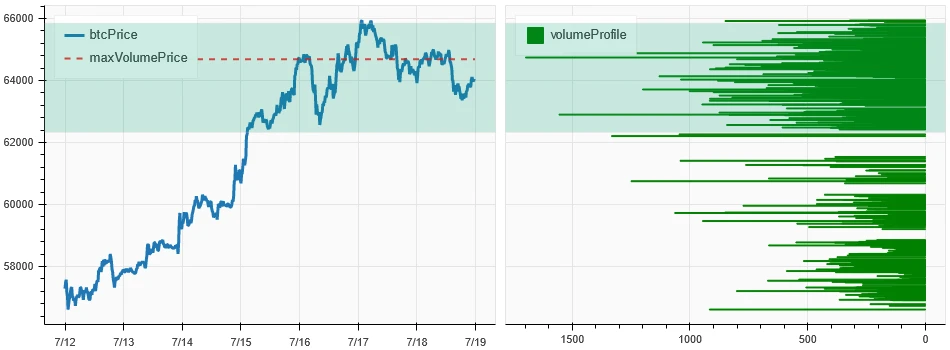
L'image ci-dessus montre la répartition des zones de trading denses de BTC au cours de la semaine dernière.

L’image ci-dessus montre la répartition des zones de négociation denses d’ETH au cours de la semaine dernière.

Le tableau montre la fourchette de négociation hebdomadaire intensive du BTC et de l’ETH au cours de la semaine dernière.
Volume et intérêt ouvert
In the past week, BTC and ETH had the largest trading volume when they rose from July 15 to 16; the open interest of BTC and ETH both fell slightly.

Le haut de l'image ci-dessus montre la tendance des prix du BTC, le milieu montre le volume des transactions, le bas montre l'intérêt ouvert, le bleu clair est la moyenne sur 1 jour et l'orange est la moyenne sur 7 jours. La couleur de la ligne K représente l'état actuel, le vert signifie que la hausse des prix est soutenue par le volume des transactions, le rouge signifie la fermeture des positions, le jaune signifie l'accumulation lente des positions et le noir signifie un état de surpeuplement.

Le haut de l'image ci-dessus montre la tendance des prix de l'ETH, le milieu est le volume des transactions, le bas est l'intérêt ouvert, le bleu clair est la moyenne sur 1 jour et l'orange est la moyenne sur 7 jours. La couleur de la ligne K représente l'état actuel, le vert signifie que la hausse des prix est soutenue par le volume des transactions, le rouge signifie la fermeture des positions, le jaune accumule lentement les positions et le noir est encombré.
Volatilité historique vs volatilité implicite
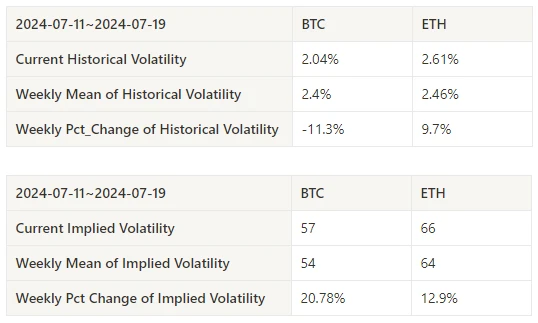
In the past week, the historical volatility of BTC and ETH was the highest when it rose to 7.16; the implied volatility of BTC and ETH rose synchronously.
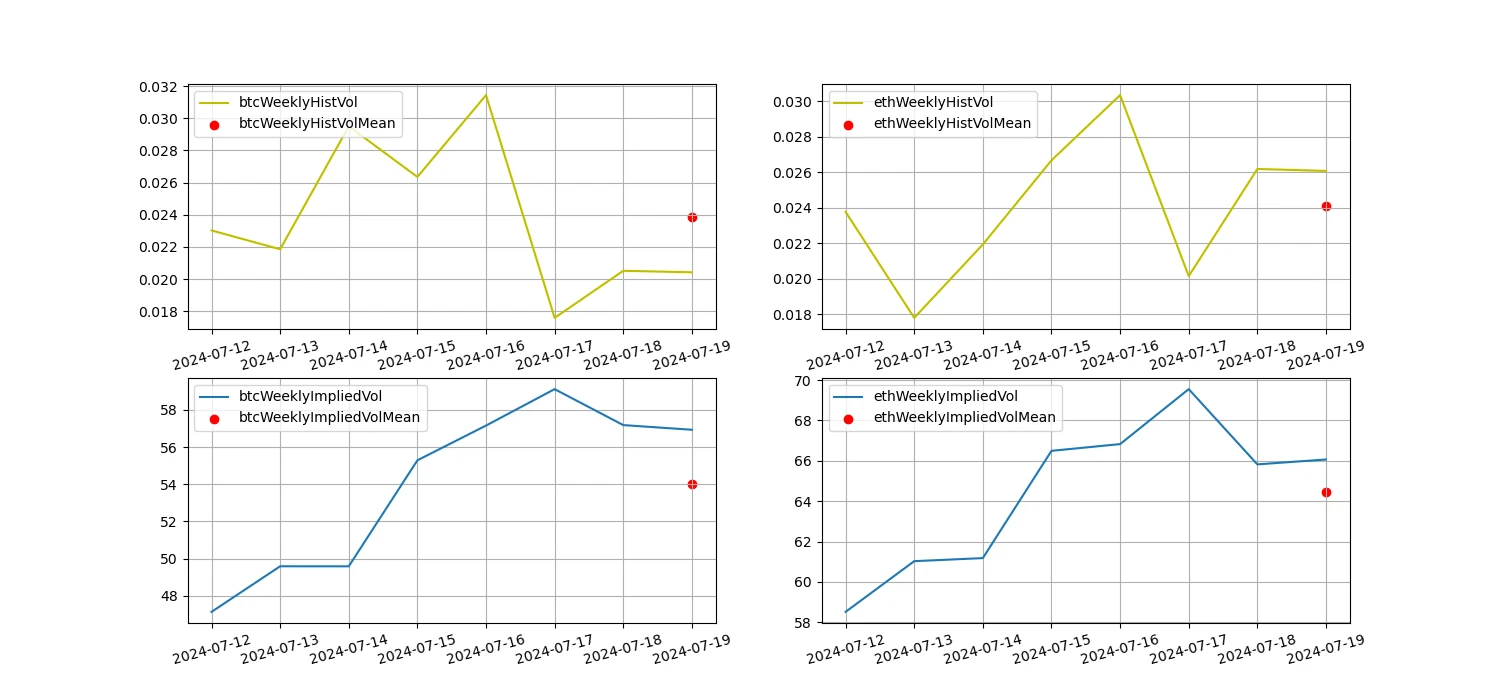
La ligne jaune représente la volatilité historique, la ligne bleue la volatilité implicite et le point rouge la moyenne sur 7 jours.
Piloté par les événements
There were no major data releases in the past week.
Indicateurs de sentiment
Sentiment d’élan
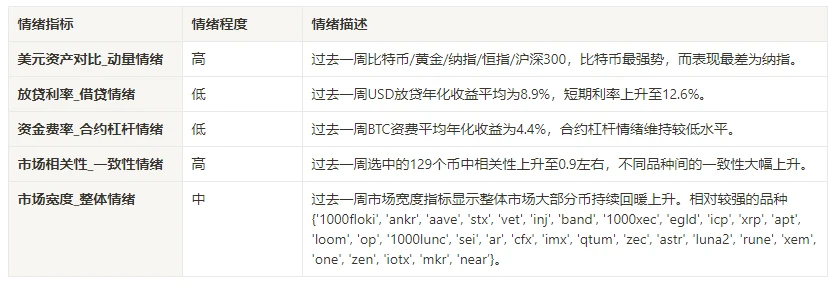
In the past week, among Bitcoin/Gold/Nasdaq/Hang Seng Index/SSE 300, Bitcoin was the strongest, while Nasdaq performed the worst.

L'image ci-dessus montre la tendance des différents actifs au cours de la semaine dernière.

Taux de prêt_Sentiment de prêt
The average annualized return on USD lending over the past week was 8.9%, and short-term interest rates rose to 12.6%.

La ligne jaune représente le prix le plus élevé du taux d'intérêt en USD, la ligne bleue représente 75% du prix le plus élevé et la ligne rouge représente la moyenne sur 7 jours de 75% du prix le plus élevé.

Le tableau montre les rendements moyens des taux d'intérêt en USD à différents jours de détention dans le passé.
Taux de financement_Sentiment de levier du contrat
The average annualized return on BTC fees in the past week was 4.4%, and contract leverage sentiment remained at a low level.
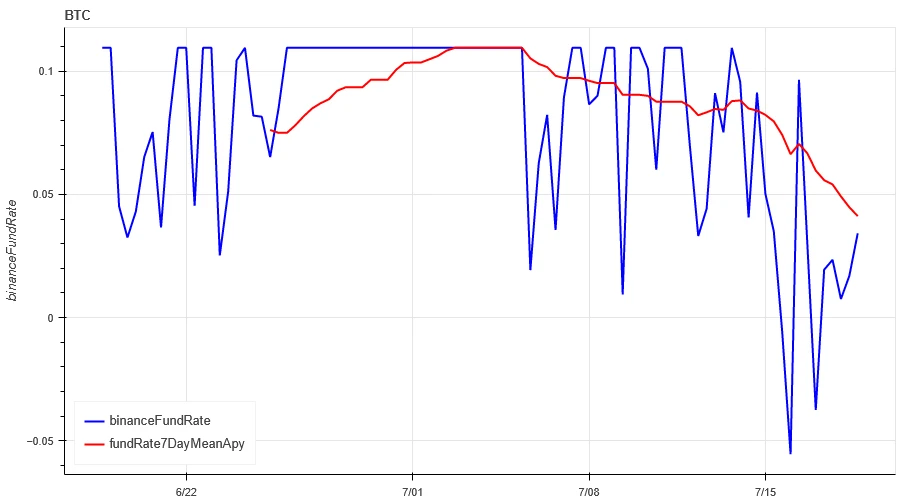
La ligne bleue est le taux de financement du BTC sur Binance, et la ligne rouge est sa moyenne sur 7 jours.

The table shows the average return of BTC fees for different holding days in the past.
Corrélation du marché_Sentiment de consensus
The correlation among the 129 coins selected in the past week remained at around 0.9, and the consistency between different varieties increased significantly.

In the above picture, the blue line is the price of Bitcoin, and the green line is [1000 floki, 1000 lunc, 1000 pepe, 1000 shib, 100 0x ec, 1inch, aave, ada, agix, algo, ankr, ant, ape, apt, arb, ar, astr, atom, audio, avax, axs, bal, band, bat, bch, bigtime, blur, bnb, btc, celo, cfx, chz, ckb, comp, crv, cvx, cyber, dash, doge, dot, dydx, egld, enj, ens, eos,etc, eth, fet, fil, flow, ftm, fxs, gala, gmt, gmx, grt, hbar, hot, icp, icx , imx, inj, iost, iotx, jasmy, kava, klay, ksm, ldo, link, loom, lpt, lqty, lrc, ltc, luna 2, magic, mana, matic, meme, mina, mkr, near, neo, ocean, one, ont, op, pendle, qnt, qtum, rndr, rose, rune, rvn, sand, sei, sfp, skl, snx , sol, ssv, stg, storj, stx, sui, sushi, sxp, theta, tia, trx, t, uma, uni, vet, waves, wld, woo, xem, xlm, xmr, xrp, xtz, yfi, zec, zen, zil, zrx] overall correlation
Étendue du marché_Sentiment général
Among the 129 coins selected in the past week, 78% of the prices were above the 30-day moving average, 37% of the prices were above the 30-day moving average relative to BTC, 33% of the prices were more than 20% away from the lowest price in the past 30 days, and 67.7% of the prices were less than 10% away from the highest price in the past 30 days. The market breadth indicators in the past week showed that most of the coins in the overall market rebounded and rose.

The picture above is [bnb, btc, sol, eth, 1000 floki, 1000 lunc, 1000 pepe, 1000 sats, 1000 shib, 100 0x ec, 1inch, aave, ada, agix, ai, algo, alt, ankr, ape, apt, arb, ar, astr, atom, avax, axs, bal, band, bat, bch, bigtime, blur, cake, celo, cfx, chz, ckb, comp, crv, cvx, cyber, dash, doge, dot, dydx, egld, enj, ens, eos,etc, fet, fil, flow, ftm, fxs, gala, gmt, gmx, grt, hbar, hot , icp, icx, idu, imx, inj, iost, iotx, jasmy, jto, jup, kava, klay, ksm, ldo, link, loom, lpt, lqty, lrc, ltc, luna 2, magic, mana, manta, mask, matic, meme, mina, mkr, near, neo, nfp, ocean, one, ont, op, ordi, pendle, pyth, qnt, qtum, rndr, robin, rose, rune, rvn, sand, sei, sfp, skl, snx, ssv, stg, storj, stx, sui, sushi, sxp, theta, tia, trx, t, uma, uni, vet, waves, wif, wld, woo,xai, xem, xlm, xmr, xrp, xtz, yfi, zec, zen, zil, zrx ] 30-day proportion of each width indicator

Résumer
In the past week, the prices of Bitcoin (BTC) and Ethereum (ETH) rose for 6 consecutive days, while the volatility and trading volume of these two cryptocurrencies reached the highest level when they rose on July 16. The open interest of Bitcoin and Ethereum is declining. In addition, the implied volatility of Bitcoin and Ethereum has also risen in tandem. Bitcoins funding rate remains at a low level, which may reflect the continued low leverage sentiment of market participants towards Bitcoin. Market breadth indicators show that most cryptocurrencies have rebounded and risen, indicating that the overall market has rebounded from lows in the past week.
Twitter : @ https://x.com/CTA_ChannelCmt
Site web: channelcmt.com
This article is sourced from the internet: Crypto Market Sentiment Research Report (2024.07.12-07.19): Trumps assassination drives Bitcoin up
Related: Decoding Dar Open Network: The infrastructure layer for the next generation of Web3 games
At Dar Open Network, we firmly believe in the transformative power of blockchain games. Games are not only entertainment, but also empower players, revolutionize the digital economy, and push the boundaries of technological innovation. As the crypto industry grows, we believe that blockchain games will become the cornerstone of a new paradigm in driving adoption, creativity, and digital interaction. Our team is committed to building a gaming platform that serves game developers and players. We are not creating a new chain, but building an ecosystem. Guided by this vision, we developed Dar Open Network as the infrastructure layer for future games. The creation of Dar Open Network has been going on for six months. Starting from the mission of providing a one-stop solution, we have made progress in many aspects…


