Analyse quantitative : l’ETF Ethereum est-il vraiment bon pour les altcoins ?
Original title: ETH Beta – a Recipe for Disaster?
Original author: Thor
Traduction originale : Peisen, BlockBeats
Editors Note: On July 18, as issuers successively submitted S-1/A and other documents of spot Ethereum ETF to the US SEC, the fees of 9 spot Ethereum ETFs have been announced and trading will start next week. Crypto researcher Thor used linear analysis to analyze the correlation between various altcoins and Ethereum to explore whether ETFs will benefit altcoins while benefiting Ethereum. BlockBeats translated the original text as follows: Introduction
In a few days, ETH ETFs are about to go live. While most people are speculating on the short-term and long-term fund flows of these products, another question arises: Can this momentum of ETH be captured by adding leveraged ETH beta exposure?
ETH beta refers to altcoins within the Ethereum ecosystem that, in theory, should be leveraged exposure to ETH. Common examples include LDO or ENS, and traders trade these altcoins based on the idea that they are more volatile relative to ETH itself. Lately, the term ETH beta has mostly been a joke, as altcoins have generally underperformed. Choosing an altcoin related to ETH as leveraged exposure is like finding a needle in a haystack, often resulting in traders and investors underperforming ETH over longer time frames.
So, will this time really be different? With the launch of the ETH ETF, is the best strategy to bet on altcoins with higher beta relative to ETH? Today’s article will explore this question from a quantitative perspective.
Points clés
-
Rapport qualité/prix
-
Corrélation
-
Beta
-
Sharpe Ratio
-
en conclusion
Rapport qualité/prix
The ratio of TOTA L3 (altcoin market cap) to ETH market cap is around 1.48. This chart has only been this low on a few rare occasions since 2020, which shows that ETH has outperformed relative to most altcoins.

There are a few ways to interpret this chart. First, these altcoins have historically fluctuated around this level. Given the recent high bearish sentiment towards altcoins, this may happen again. However, it is clear that this chart is in a multi-year downtrend, which shows that it is difficult to find the right altcoins that can outperform ETH. What the chart does not show is that while the market capitalization of altcoins may rise, the price may fall due to the low circulation and large unlocking of many tokens. Therefore, finding reliable ETH beta becomes more challenging.
The sample of tokens analyzed as potential ETH betas include the following:
[L2 Project]
OP, ARB, MANTA, MNT, METIS, GNO, CANTO, IMX, STRK
[L1 copycat project]
SOL, AVAX, BNB, TON
[DeFi Project]
MKR, AAVE, SNX, FXS, LDO, PENDLE, ENS, LINK
[Memes]
PEPE, DOGE, SHIB
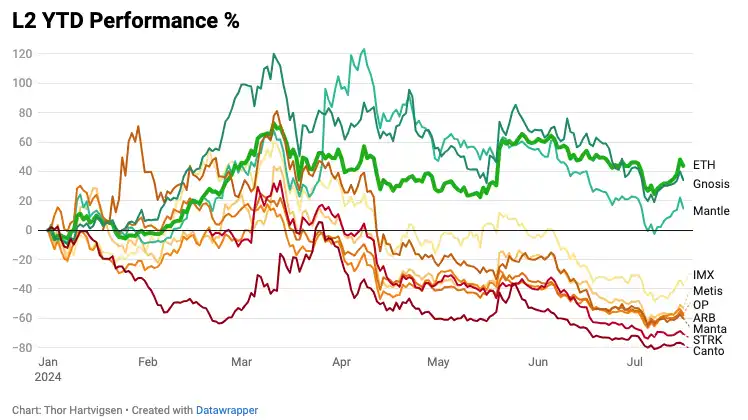
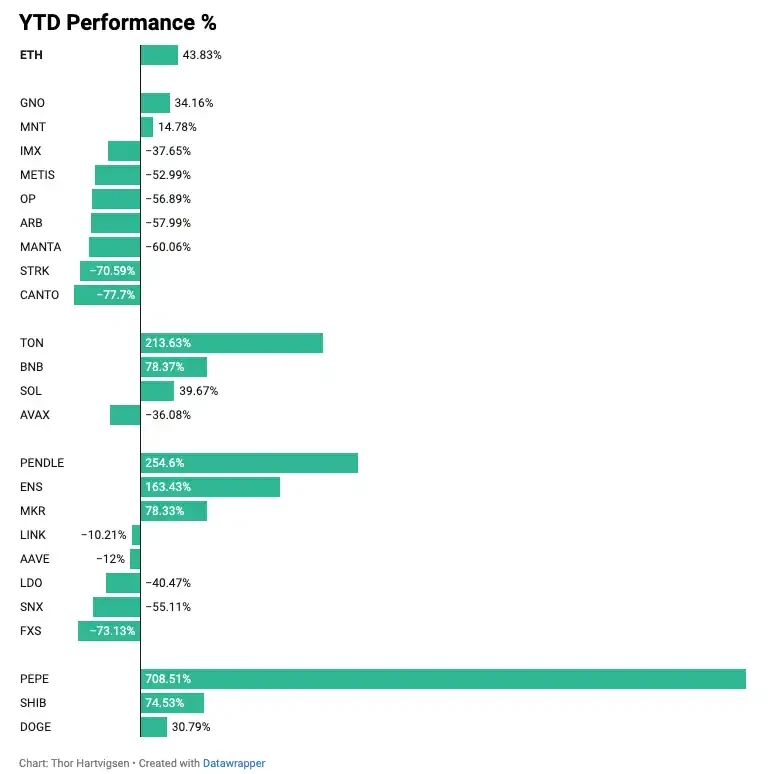
Zooming in, the chart below shows the year-to-date (last 198 days) performance of ETH and these four token categories.

It is worth noting that no L2 token has outperformed ETH this year, with the best performing token being GNO, up 34%, while ETH is up 44%. The worst performers include MANTA, STRK, and CANTO, all down more than 60% this year.

The top alt L1 tokens have performed much better, with both TON and BNB significantly outperforming ETH. AVAX is the only one of these tokens to be down this year.

Of the eight DeFi tokens in this basket, three have outperformed ETH, namely PENDLE (+254%), ENS (+163%), and MKR (+78%). The remaining five have all fallen this year, with FXS being the worst performer, down 73%.

2024 was characterized by the dominance of meme coins, which was also reflected in the performance of the largest Ethereum native meme coins. Pepe was the biggest gainer in the sample, up 708%, while SHIB rose 74% and DOGE rose 31%.
Résumer:

Corrélation
The sample of altcoins was not randomly selected, but rather consisted of tokens that are generally considered to correlate with ETH performance. For example, it makes sense that a random DEX token on Solana or Sui would have a lower correlation with ETH than an ERC-20 token on the Ethereum network.
The YTD performance of each of the above tokens is indicative, and while past performance is no guarantee of future results, there may be some signals in it. If we want to analyze whether these tokens are truly leveraged exposure to ETH, rather than just individual (alone) behavior, we need to dig deeper. There is no perfect way to model this phenomenon, and it is clear that crypto markets are far from efficient. Therefore, the data obtained must be taken with a pinch of salt. However, one way to study this behavior is to look at the correlation between these altcoins and ETH.
Correlation measures the strength and direction of the relationship between two assets and helps explain how they affect each other. Correlation values range from -1 to 1, with 1 indicating a perfect positive correlation and -1 indicating a perfect negative correlation.
The chart below depicts the correlation between various tokens on the left and ETH. ETHs correlation with ETH is obviously perfect, so its 100%. The altcoins with the highest correlation with ETH are GNO, SNX, METIS, AAVE, and ARB.

Among the best performing tokens year-to-date, including PEPE, TON, PENDLE, ENS, and BNB, these tokens have correlations with ETH below 60%, indicating that their performance is more influenced by other factors (perhaps BTC correlation or individual variables). TON has the lowest correlation with ETH, so buying this asset to capture leveraged ETH exposure is not an optimal choice based on this analysis.
Beta
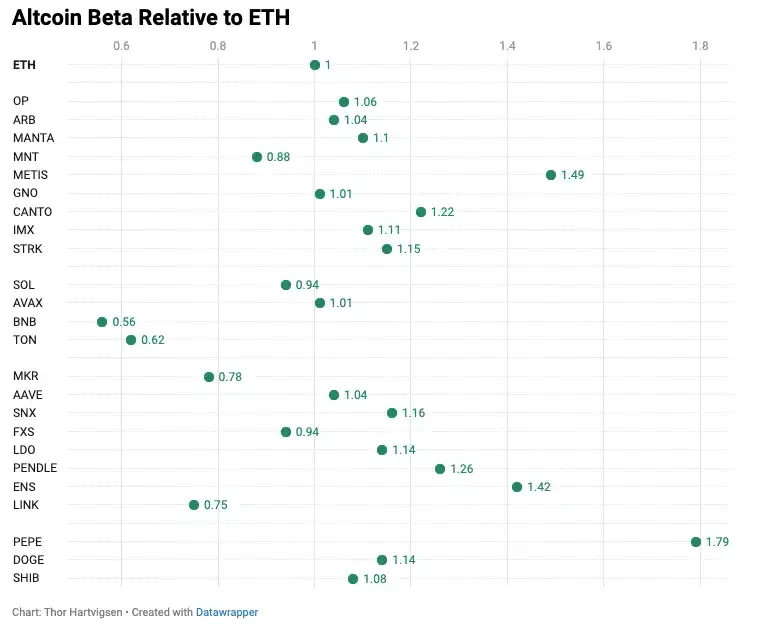
Going a step further, we can calculate the year-to-date beta of these altcoins relative to ETH. Beta is used to indicate the volatility of an asset relative to the underlying market, in this case ETH. ETH has a beta of 1, altcoins with higher volatility have betas greater than 1, and altcoins with lower volatility have betas less than 1.

From this analysis, it can be seen that only a few altcoins have high beta coefficients relative to ETH, namely PEPE, METIS, ENS, and PENDLE. Altcoins with high beta coefficients are more volatile relative to ETH. Combining our results in the correlation and beta analysis, it can be speculated that PEPE may be a good beta asset for ETH, and if ETH appreciates due to the listing of the ETF, PEPE may provide good returns. However, it is important to keep in mind the limitations of this analysis. There are many external factors that affect the performance of these assets, which are not included in this analysis. Therefore, I once again remind you to treat this as a theoretical analysis rather than data that can be used directly for trading.
Sharpe Ratio
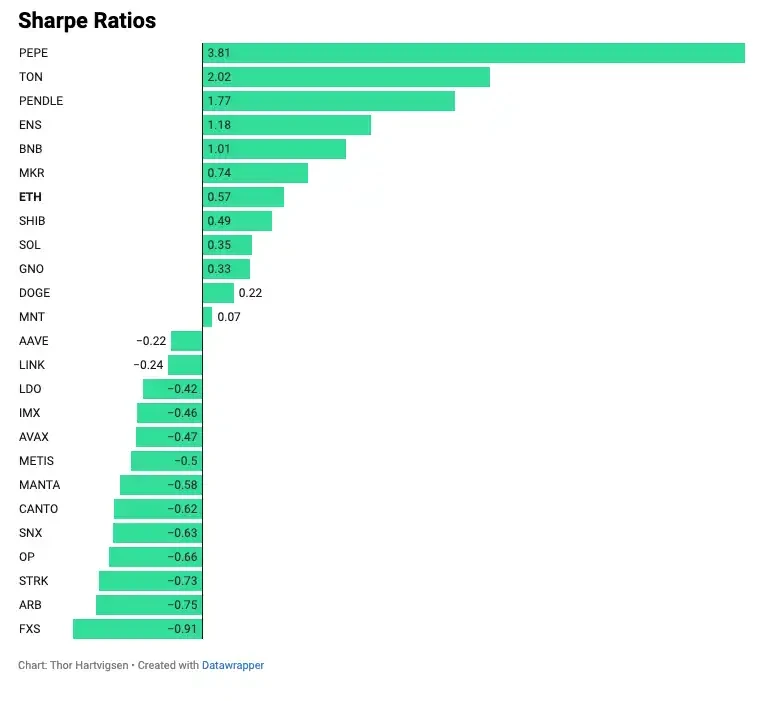
Finally, we can calculate the year-to-date Sharpe Ratio for these assets as another way to assess their recent performance. The Sharpe Ratio measures volatility-adjusted returns and is calculated by subtracting the risk-free rate from the return and then dividing by the volatility (standard deviation). The risk-free rate used in this analysis is the 8% annual interest rate provided by Makers DAI Savings Rate. The higher the Sharpe Ratio, the better the performance.

en conclusion
What are the main conclusions we can draw from this analysis?
First, only a handful of altcoins, known as “ETH beta,” have been able to outperform ETH itself.
Second, the performance of many altcoins cannot be attributed solely to correlation or beta with ETH. These tokens are not only correlated with assets other than ETH, but are also affected by individual variables.
I think it is unwise to buy these altcoins to get leveraged exposure to ETH because you will be taking on a lot of additional risk that you may not be aware of. If you want leveraged exposure to ETH, it would make more sense to do a 2x ETH long strategy directly on Aave, for example. In this case, you can achieve a 100% correlation and a beta of 2.
Finally, the argument for ETH doing well after an ETF launch involves potential positive inflows from new ETH ETF buyers. These altcoins don’t experience this positive buying pressure (they are not the tokens that are about to be ETFed), and there are usually a lot of tokens unlocked in the coming weeks and months. Don’t overcomplicate things.
This article is sourced from the internet: Quantitative Analysis: Is Ethereum ETF Really Good for Altcoins?
Ulysse, le protagoniste du poème épique d'Homère L'Odyssée, a dit à ses membres d'équipage au cours de son aventure : Nous devons prendre de tels risques et aller dans des endroits lointains pour voir si l'aventure et la connaissance peuvent se transformer en fleurs et en fruits. L'évolution des portefeuilles Web3 est comme l'aventure en bateau d'Ulysse, explorant le monde numérique de demain à travers des mises à jour continues et des sauts technologiques. La plupart des premières versions des portefeuilles Web3 étaient dédiées à la gestion d'actifs et aux fonctions de trading. Plus tard, avec le développement d'applications on-chain telles que DeFi, des fonctions plus complexes telles que les transactions inter-chaînes, l'exécution de contrats intelligents et l'intégration DApp ont été progressivement ajoutées. Il est actuellement mis à niveau vers une plate-forme complète avec des fonctions avancées telles que les transactions intelligentes, la protection MEV et l'analyse des données de marché en temps réel, créant ainsi un système financier plus ouvert et inclusif…


