Rapport de recherche sur le sentiment du marché des crypto-monnaies (2024.07.05–07.12) : l'IPC baisse, les prix des devises traditionnelles augmentent et baissent
CPI data fell, mainstream currency prices rose and fell
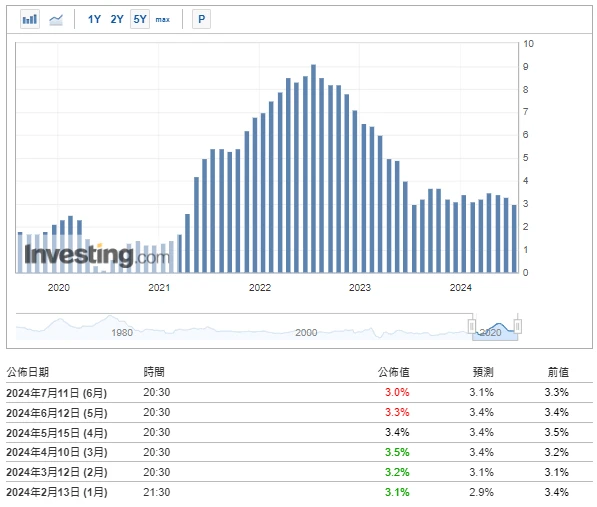
La source de données: https://hk.investing.com/economic-calendar/cpi-733
Expectations for interest rate cuts have increased significantly this year, with the probability of the first rate cut in September rising to 80%, and the probability of a rate cut in July reappearing. The prices of Bitcoin and Ethereum continued to rise before the release of CPI data, and then fell back after the data was released. Data released by the U.S. Department of Labor showed that the year-on-year growth rate of the U.S. Consumer Price Index (CPI) slowed from 3.3% in May to 3% in June, the lowest growth rate since June last year; month-on-month, it turned from flat in May to a decline of 0.1% in June, a 0.1 percentage point drop from the previous month, the first negative growth since May 2020, showing signs of continued slowdown in inflation.
There are about 17 days until the next Fed meeting (August 1, 2024)
https://hk.investing.com/economic-calendar/interest-rate-decision-168
Analyse de l'environnement technique et du sentiment du marché


Composants d'analyse des sentiments

Indicateurs techniques
Tendance des prix
BTC prices rose 0.51% and ETH prices rose 1.3% over the past week.
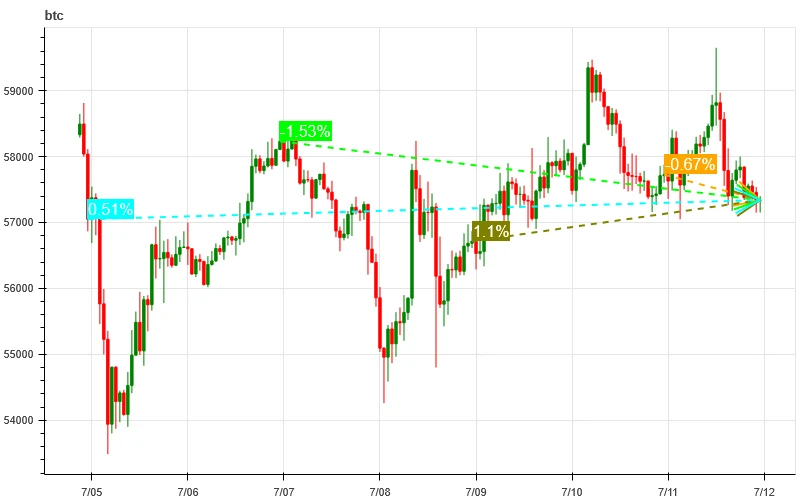
L’image ci-dessus est le graphique des prix du BTC au cours de la semaine dernière.

L’image ci-dessus est le graphique des prix de l’ETH au cours de la semaine dernière.
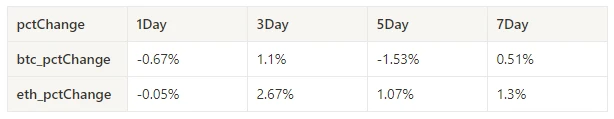
Le tableau montre le taux de variation des prix au cours de la semaine dernière.
Graphique de distribution du volume des prix (support et résistance)
In the past week, BTC and ETH fluctuated upward after forming a new dense trading area with large volumes at low levels.
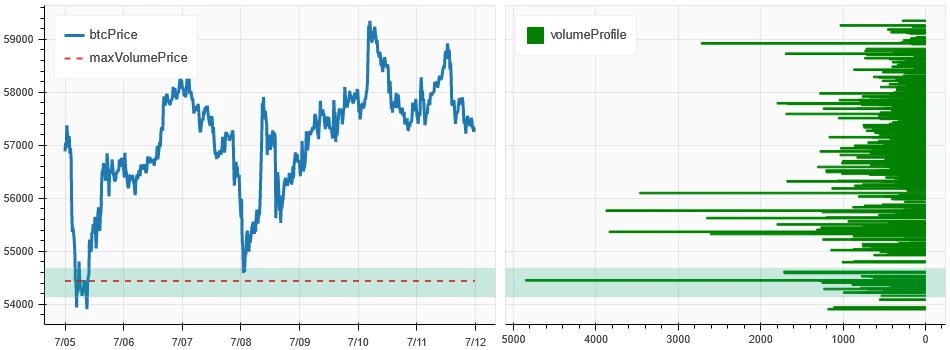
L'image ci-dessus montre la répartition des zones de trading denses de BTC au cours de la semaine dernière.

L’image ci-dessus montre la répartition des zones de négociation denses d’ETH au cours de la semaine dernière.

Le tableau montre la fourchette de négociation hebdomadaire intensive du BTC et de l’ETH au cours de la semaine dernière.
Volume et intérêt ouvert
Over the past week, BTC and ETH had the largest trading volume when they fell on July 5; open interest for both BTC and ETH continued to decline.
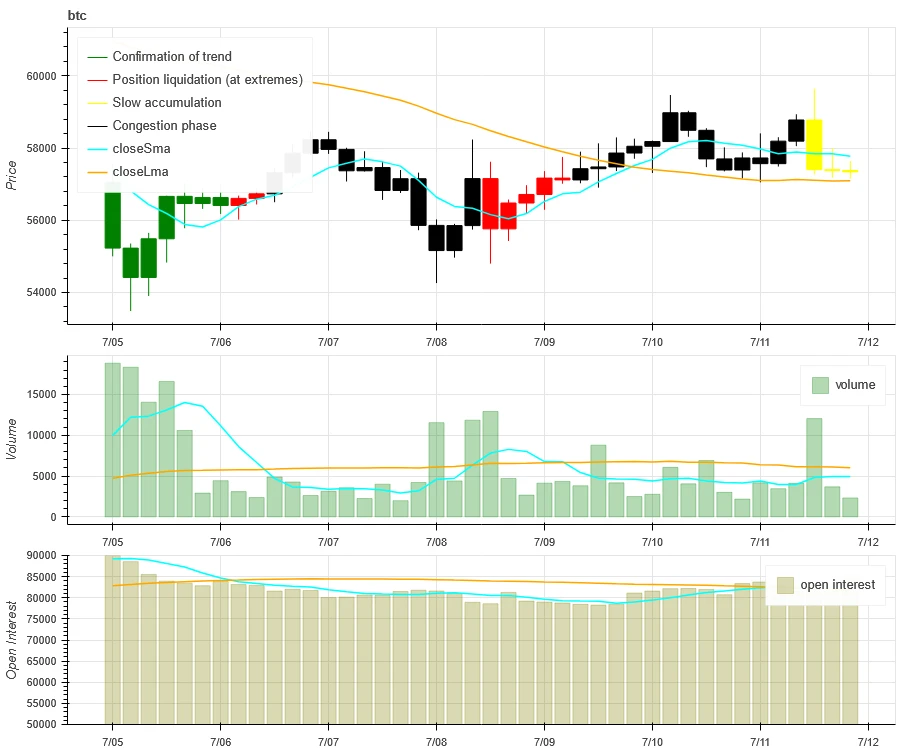
Le haut de l'image ci-dessus montre la tendance des prix du BTC, le milieu montre le volume des transactions, le bas montre l'intérêt ouvert, le bleu clair est la moyenne sur 1 jour et l'orange est la moyenne sur 7 jours. La couleur de la ligne K représente l'état actuel, le vert signifie que la hausse des prix est soutenue par le volume des transactions, le rouge signifie la fermeture des positions, le jaune signifie l'accumulation lente des positions et le noir signifie un état de surpeuplement.
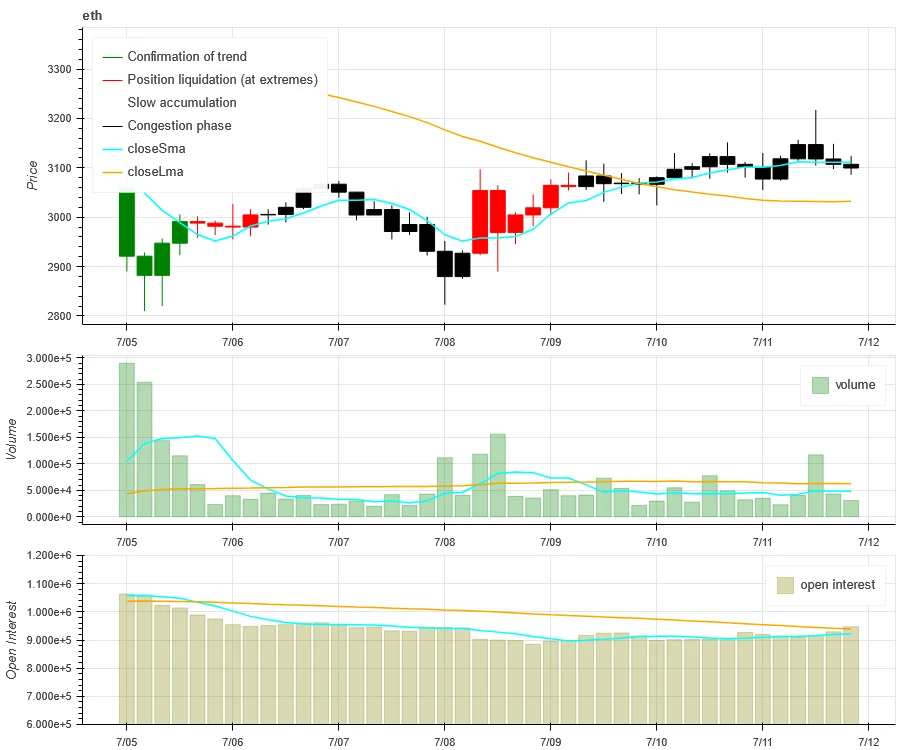
Le haut de l'image ci-dessus montre la tendance des prix de l'ETH, le milieu est le volume des transactions, le bas est l'intérêt ouvert, le bleu clair est la moyenne sur 1 jour et l'orange est la moyenne sur 7 jours. La couleur de la ligne K représente l'état actuel, le vert signifie que la hausse des prix est soutenue par le volume des transactions, le rouge signifie la fermeture des positions, le jaune accumule lentement les positions et le noir est encombré.
Volatilité historique vs volatilité implicite
In the past week, the historical volatility of BTC and ETH was highest when it fell to 7.5; the implied volatility of BTC and ETH fell synchronously.
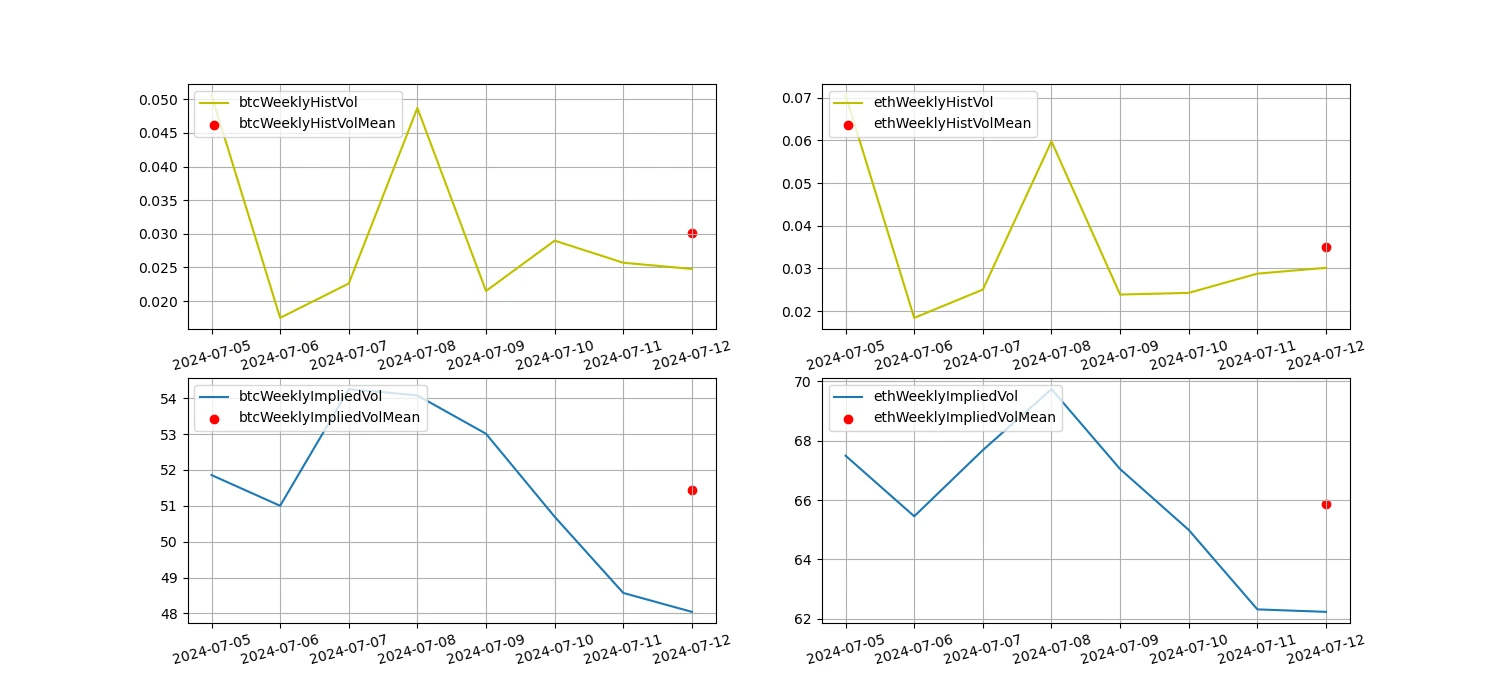
La ligne jaune représente la volatilité historique, la ligne bleue la volatilité implicite et le point rouge la moyenne sur 7 jours.

Piloté par les événements
Over the past week, the prices of Bitcoin and Ethereum continued to rise before the release of CPI data, and then fell back after the data was released.
Indicateurs de sentiment
Sentiment d’élan
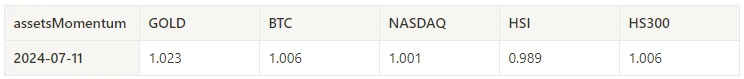
In the past week, among Bitcoin/gold/Nasdaq/Hang Seng Index/CSI 300, gold was the strongest, while Hang Seng Index performed the worst.
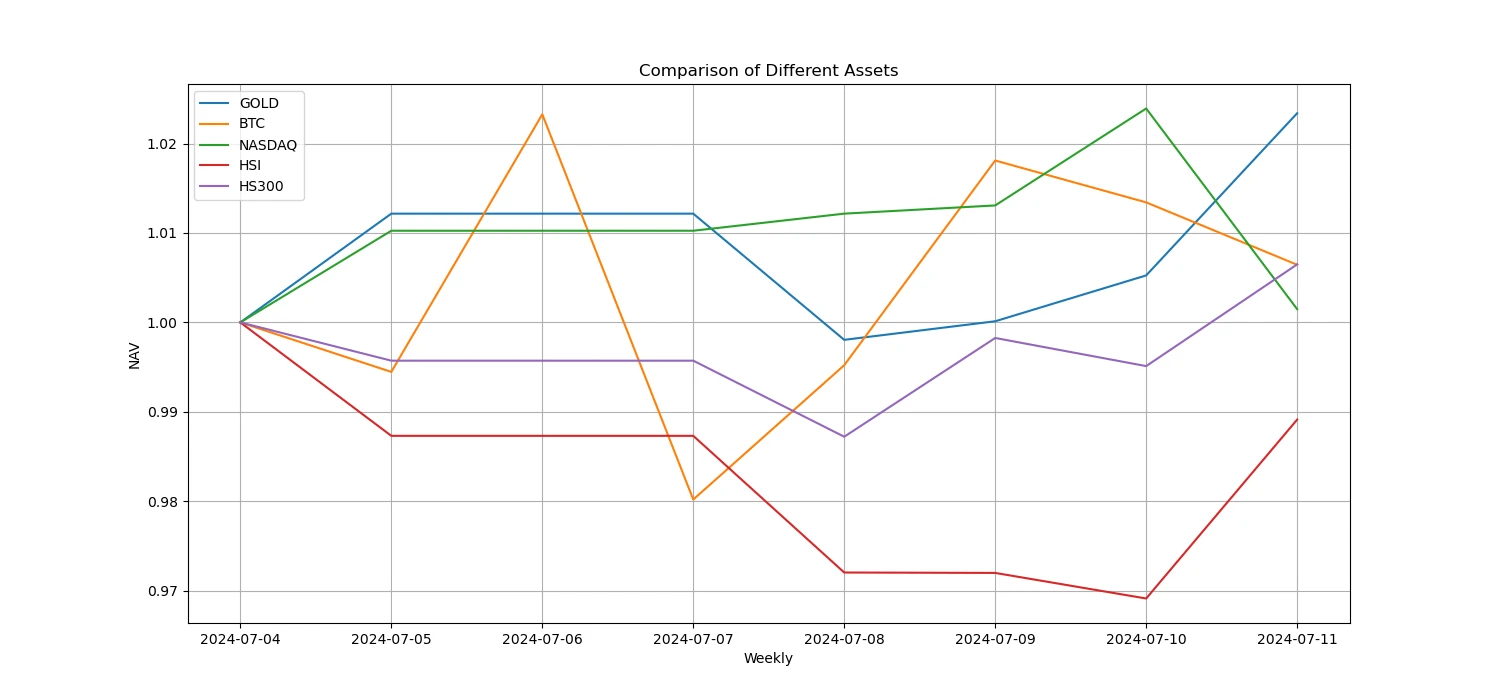
L'image ci-dessus montre la tendance des différents actifs au cours de la semaine dernière.
Taux de prêt_Sentiment de prêt
The average annualized return on USD lending over the past week was 12%, and short-term interest rates fell to 3.8%.

La ligne jaune représente le prix le plus élevé du taux d'intérêt en USD, la ligne bleue représente 75% du prix le plus élevé et la ligne rouge représente la moyenne sur 7 jours de 75% du prix le plus élevé.

Le tableau montre les rendements moyens des taux d'intérêt en USD à différents jours de détention dans le passé.
Taux de financement_Sentiment de levier du contrat
The average annualized return on BTC fees in the past week was 8.8%, and contract leverage sentiment remained at a low level.
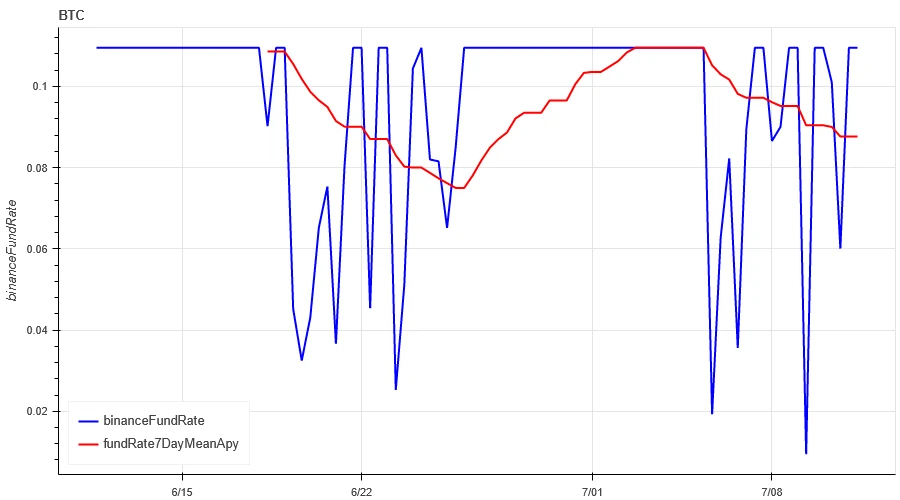
La ligne bleue est le taux de financement du BTC sur Binance, et la ligne rouge est sa moyenne sur 7 jours.
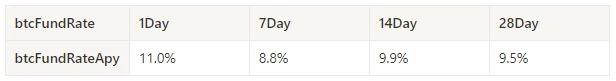
Le tableau montre le rendement moyen des frais BTC pour différents jours de détention dans le passé.
Corrélation du marché_Sentiment de consensus
The correlation among the 129 coins selected in the past week remained at around 0.73, and the consistency between different varieties fell from a high level.
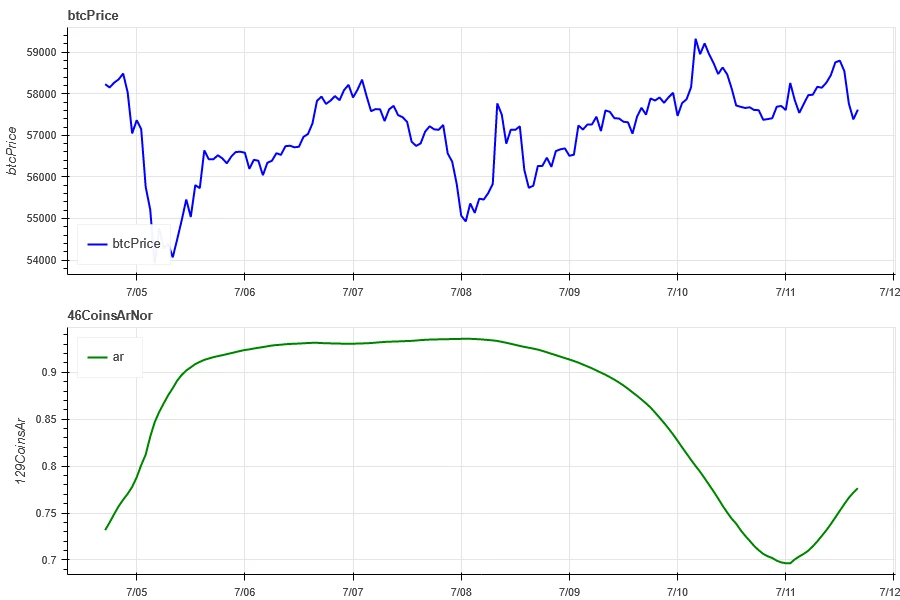
In the above picture, the blue line is the price of Bitcoin, and the green line is [1000 floki, 1000 lunc, 1000 pepe, 1000 shib, 100 0x ec, 1inch, aave, ada, agix, algo, ankr, ant, ape, apt, arb, ar, astr, atom, audio, avax, axs, bal, band, bat, bch, bigtime, blur, bnb, btc, celo, cfx, chz, ckb, comp, crv, cvx, cyber, dash, doge, dot, dydx, egld, enj, ens, eos,etc, eth, fet, fil, flow, ftm, fxs, gala, gmt, gmx, grt, hbar, hot, icp, icx, imx, inj, iost, iotx, jasmy, kava, klay, ksm, ldo, link, loom, lpt, lqty, lrc, ltc, luna 2, magic, mana, matic, meme, mina, mkr, near, neo, ocean, one, ont, op, pendle, qnt, qtum, rndr, rose, rune, rvn, sand, sei, sfp, skl, snx, sol, ssv, stg, storj, stx, sui, sushi, sxp, theta, tia, trx, t, uma, uni, vet, waves, wld, woo, xem, xlm, xmr, xrp, xtz, yfi, zec, zen, zil, zrx] overall correlation
Étendue du marché_Sentiment général
Among the 129 coins selected in the past week, 9.4% of the coins were priced above the 30-day moving average, 33.8% of the coins were priced above the 30-day moving average relative to BTC, 5.5% of the coins were more than 20% away from the lowest price in the past 30 days, and 10% of the coins were less than 10% away from the highest price in the past 30 days. The market breadth indicator in the past week showed that most coins in the overall market continued to fall.

L'image ci-dessus montre [bnb, btc, sol, eth, 1000 floki, 1000 lunc, 1000 pepe, 1000 sats, 1000 shib, 100 0x ec, 1inch, aave, ada, agix, ai, algo, alt, ankr, ape, apt, arb, ar, astr, atom, avax, axs, bal, band, bat, bch, bigtime, blur, cake, celo, cfx, chz, ckb, comp, crv, cvx, cyber, dash, doge, dot, dydx, egld, enj, ens, eos, etc, fet, fil, flow, ftm, fxs, gala, gmt, gmx, grt, hbar, hot, icp, icx, idu, imx, inj, iost, iotx, jasmy, jto, jup, kava, klay, ksm, ldo, lien, métier à tisser, lpt, lqty, lrc, ltc, luna 2, magie, mana, manta, masque, matic, meme, mina, mkr, près, néo, nfp, océan, un, ont, op, ordi, pendle, pyth, qnt, qtum, rndr, robin, rune, rvn, sable, sei, sfp, skl, snx, ssv, stg, storj, stx, sui, sushi, sxp, theta, tia, trx, t, uma, uni, vétérinaire, vagues, wif, wld, woo,xai, xem, xlm, xmr, xrp, xtz, yfi, zec, zen, zil, zrx] Proportion sur 30 jours de chaque indicateur de largeur

Résumer
In the past week, the prices of Bitcoin (BTC) and Ethereum (ETH) fluctuated upward after heavy volume at low levels, while the volatility and trading volume of these two cryptocurrencies reached their highest levels when they fell to the low point on July 5. The open interest of Bitcoin and Ethereum is declining. In addition, the implied volatility of Bitcoin and Ethereum also fell simultaneously. Bitcoins funding rate remains at a low level, which may reflect the continued low leverage sentiment of market participants towards Bitcoin. The market breadth indicator shows that most cryptocurrencies continue to fall, indicating that the entire market has maintained a weak trend in the past week. CPI data fell, and the prices of mainstream currencies rose and fell when the data was released.
Twitter : @ https://x.com/CTA_ChannelCmt
Site web: channelcmt.com
This article is sourced from the internet: Crypto Market Sentiment Research Report (2024.07.05–07.12): CPI declines, mainstream currency prices rise and fall
Original|Odaily Planet Daily Author|LiaoLiao As digital gold, Bitcoins value storage attribute is widely recognized by the market, but its market application scenarios have never been expanded. More projects are still being developed on a large scale on blockchains such as Ethereum and Solana and launched into the market. Although last years inscriptions and the runes that emerged after the halving this year have brought some attention to the issuance of assets on the Bitcoin chain, it is limited to meme culture. The current asset protocol of the Bitcoin ecosystem is difficult to meet the more complex functions and requirements proposed by developers and creators, which is also the core reason why the Bitcoin chain ecosystem has not exploded on a large scale. Giants Protocol came into being and is bringing…