Glassnode : La volatilité continue de diminuer historiquement, et il pourrait y avoir une plus grande volatilité à l'avenir
Original source: Glassnode
Original translation: Lila, BlockBeats
Résumé
-
Despite Bitcoin prices moving sideways or falling, a large portion of the market remains in profit, while short-term holders bear the majority of losses.
-
By combining on-chain pricing models and technical indicators, we explore the future development of the market.
-
Volatility continues to compress historically, which indicates investor apathy but also suggests that greater volatility may be ahead.
Market profitability remains strong
When Bitcoin price dropped to the $60,000 range, a certain level of fear and bearishness set in among many digital asset investors. It is not uncommon for apathy to creep in when market volatility stagnates and goes dormant.
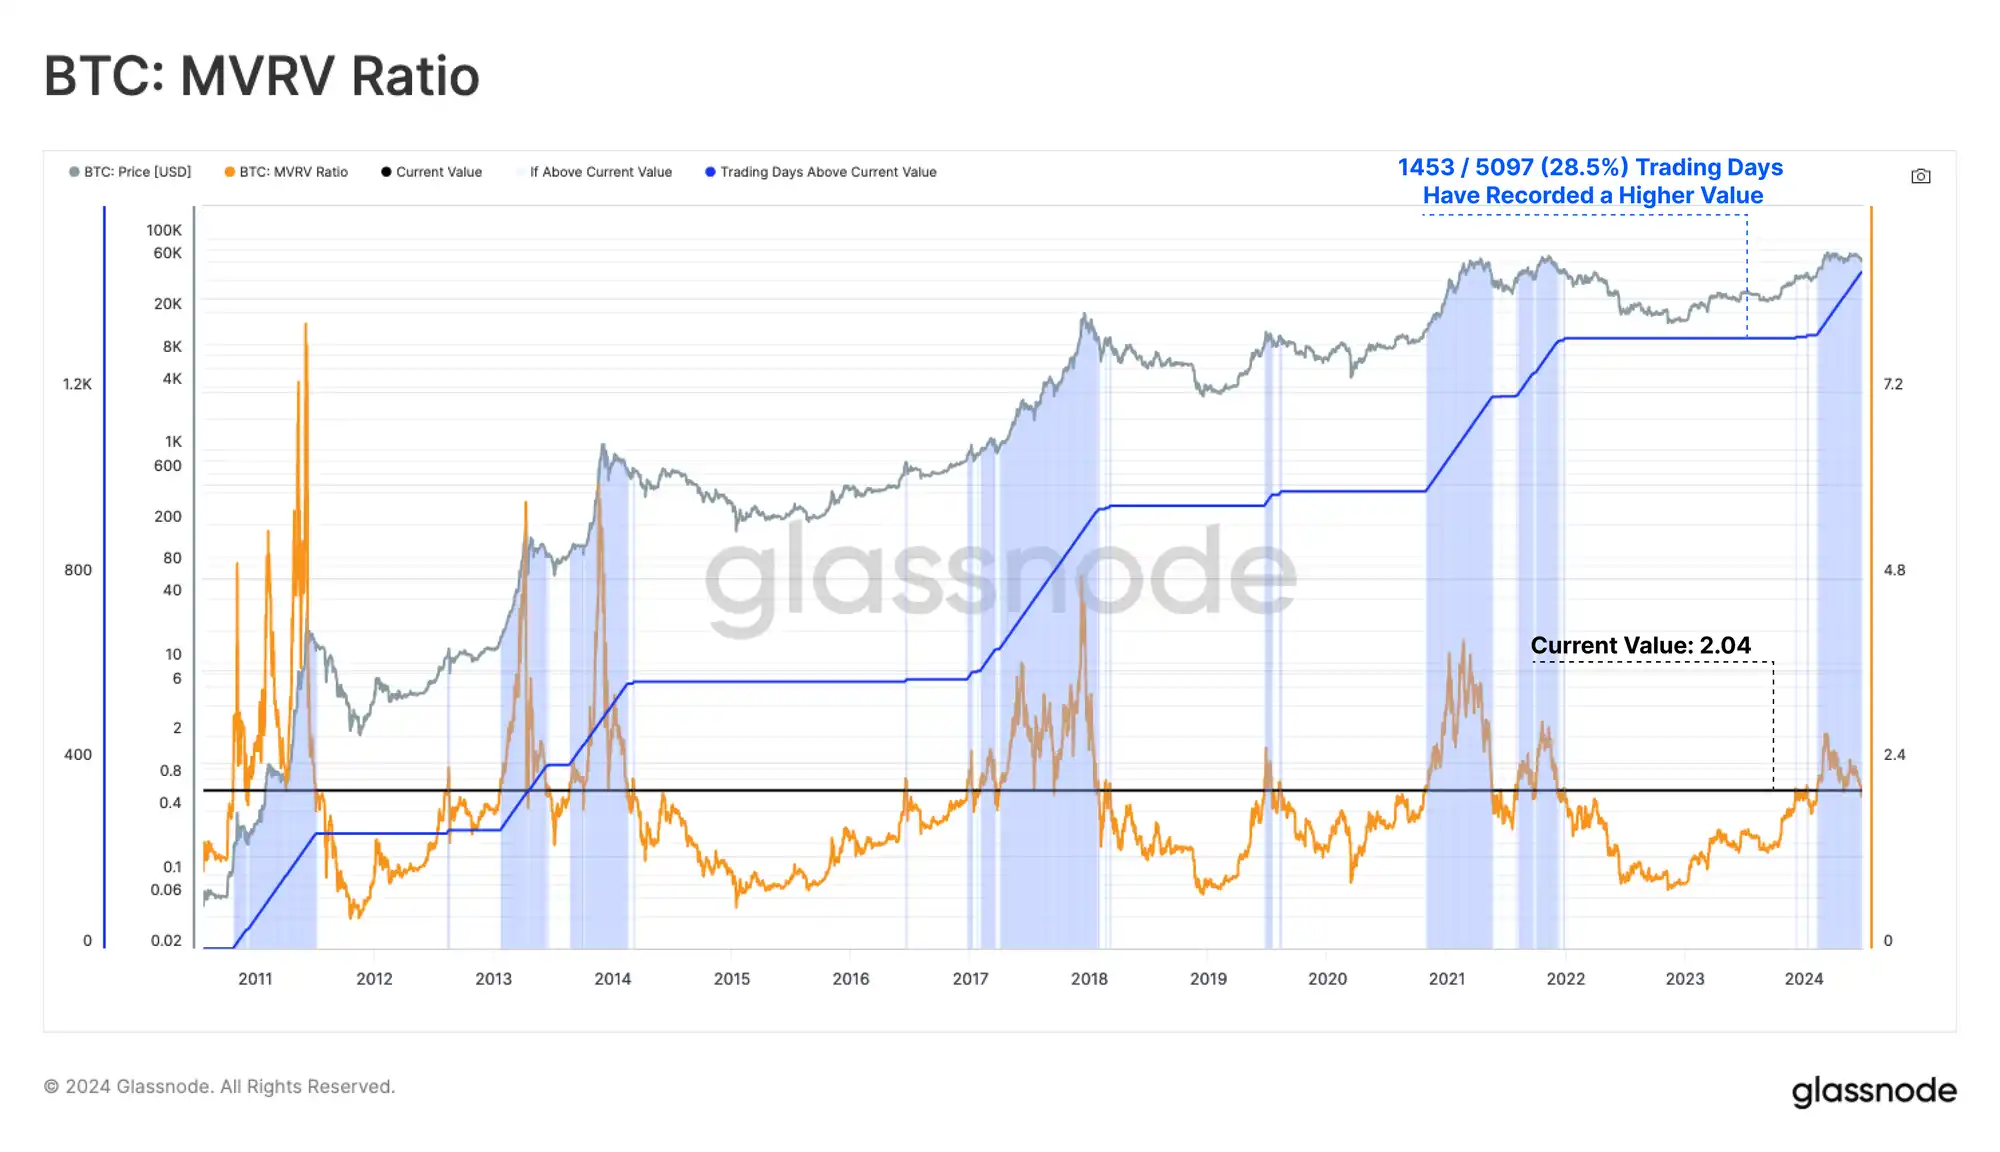
Still, overall investor profitability remains very strong from a MVRV ratio perspective, with the average coin still making 2x profit. This is often the indicator or rule that distinguishes between “enthusiastic” and “fanatical” bull market phases.
Live Chart
By grouping all holdings into unrealized profits or losses, we can assess the average cost basis of each group and the average magnitude of unrealized profits and losses per coin.
-
The average profitable coin holding has an unrealized gain of $41.3k and costs of about $19.4k. It is worth noting that this data is distorted by coins that were moved from earlier cycles, including Patoshi entities, early miners, and those lost coins.
-
The average losing coin has an unrealized loss of $5.3k and costs about $66.1k. These coins are mainly held by short-term holders, as few top buyers from the 2021 cycle are still holding.
These two indicators help identify potential points of selling pressure as investors look to hold on to their gains, or avoid larger unrealized losses.

Live Workbench
By looking at the unrealized profit/loss ratio for each coin, we can see that paper gains on holdings outweigh paper losses by a factor of 8.2. Only 18% of trading days record a greater relative value, all of which suggests that we are in a frenetic bull market.
It can be argued that the all-time high (ATH) in March was consistent with historical bull market peaks following the ETF approval due to several characteristics.

Live Workbench
Determine position in cycle
Bitcoin price has been consolidating in the $60,000 to $70,000 range since its all-time high in March, with investor apathy and boredom spreading. This has led to indecision among most investors and the market has failed to establish a solid trend.
To determine where we are in the cycle, we will refer to a simplified framework for thinking about historical Bitcoin market cycles:
-
Deep bear market: price is lower than realized price
-
Early bull market: price between realized price and true market mean
-
Enthusiastic bull market: prices are between all-time highs and the true market mean
-
Bull run: Prices are higher than the previous cycles all-time high
Currently, prices are still in the enthusiastic bull phase, with only a few very brief forays into the mania zone. The real market average is $50k, representing the average cost basis of each active investor.
This level is a key pricing level for whether the market can continue its macro bull run.

Live Workbench
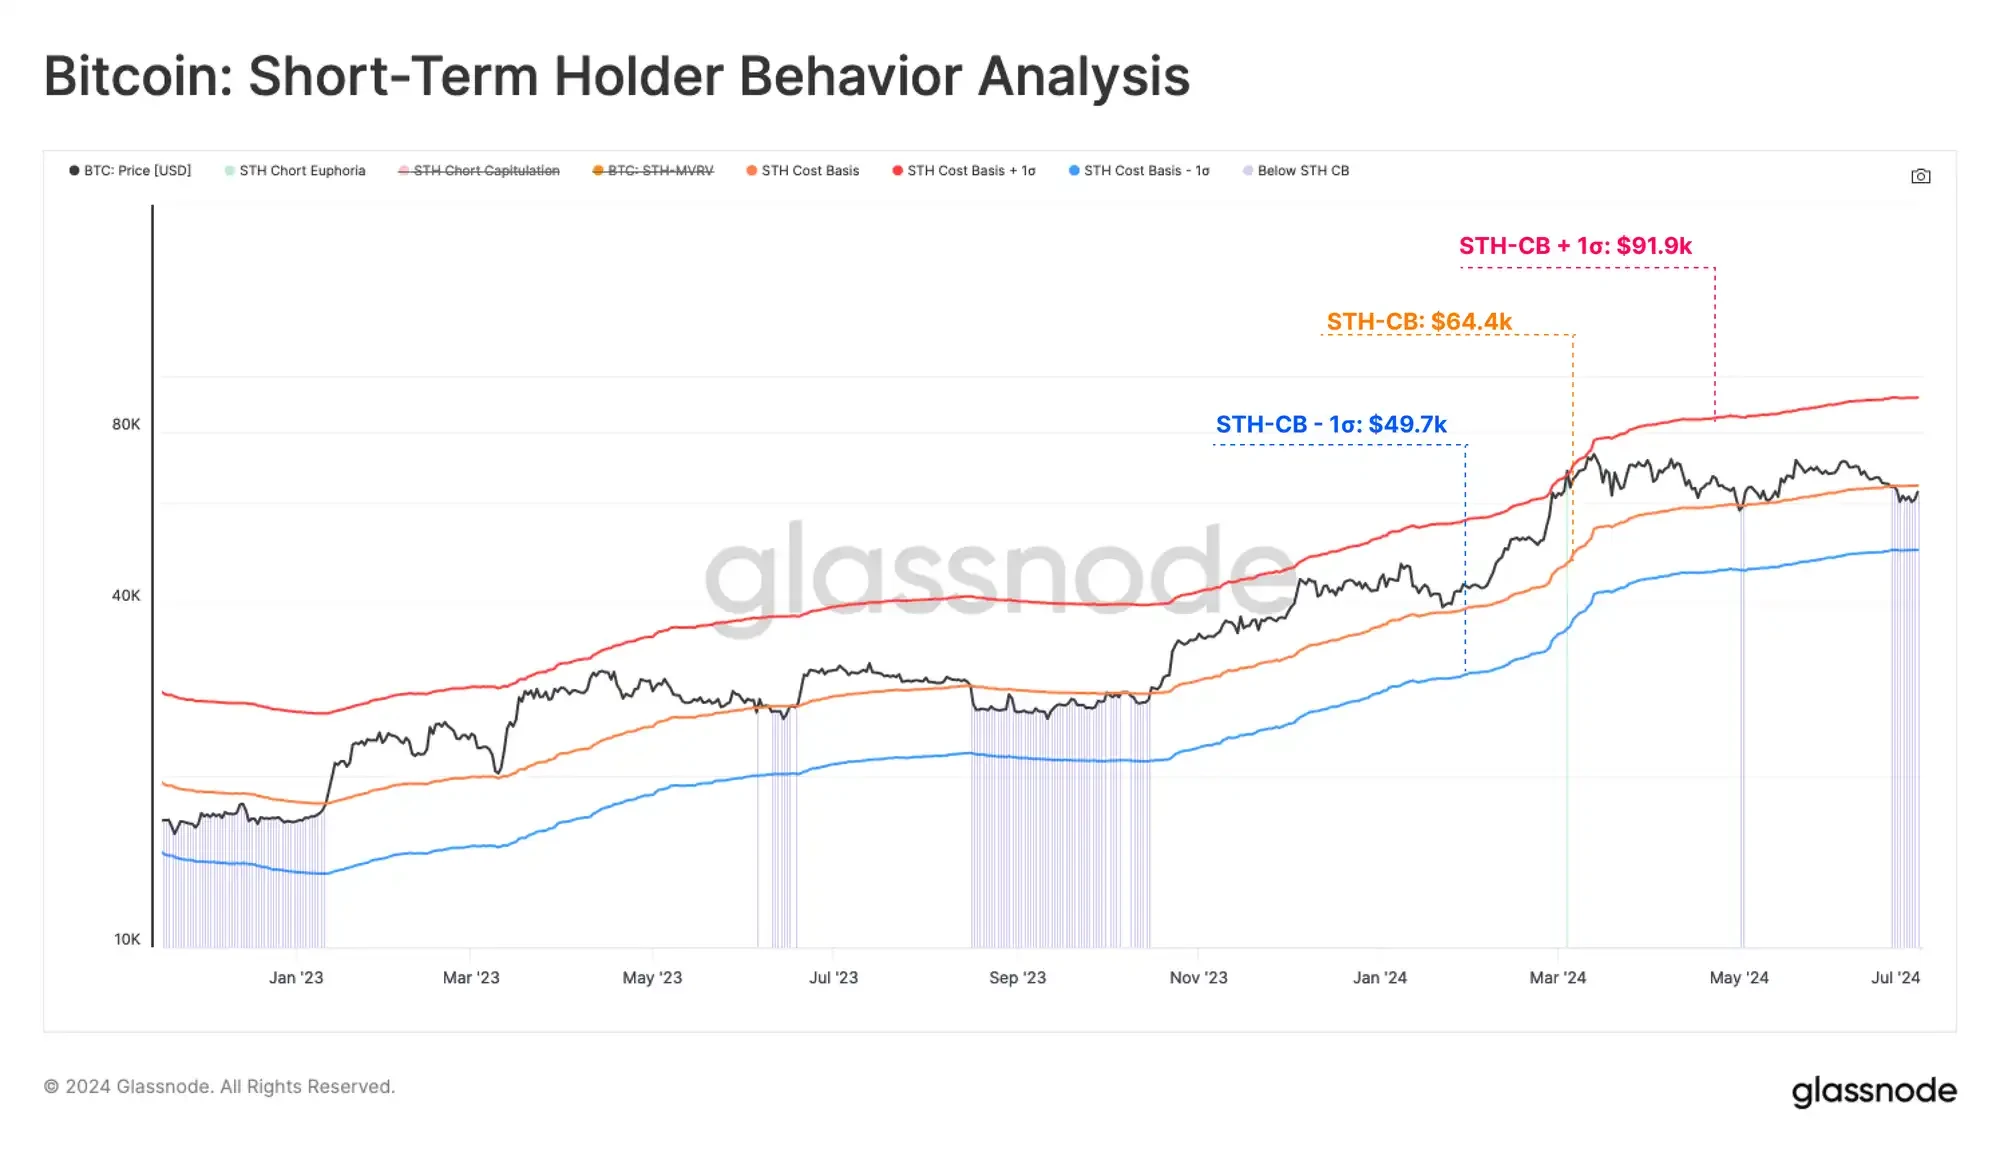
Next we will look at the short-term holder group and overlay their cost basis with their level of plus or minus 1 standard deviation. This provides an area where these price sensitive holders may begin to react:
-
Significant unrealized profits signal a potentially overheated market, with the current value at $92k.
-
The breakeven level for the short term holder group is $64k and currently the spot price is trading below this level but is trying to recapture it.
-
Significant unrealized losses signal a potential oversold market, currently at $50k. This is consistent with the true market mean as a bullish boundary.
It is noteworthy that only 7% of trading days recorded spot prices below the -1 standard deviation band, which is a relatively uncommon occurrence.
Live Workbench
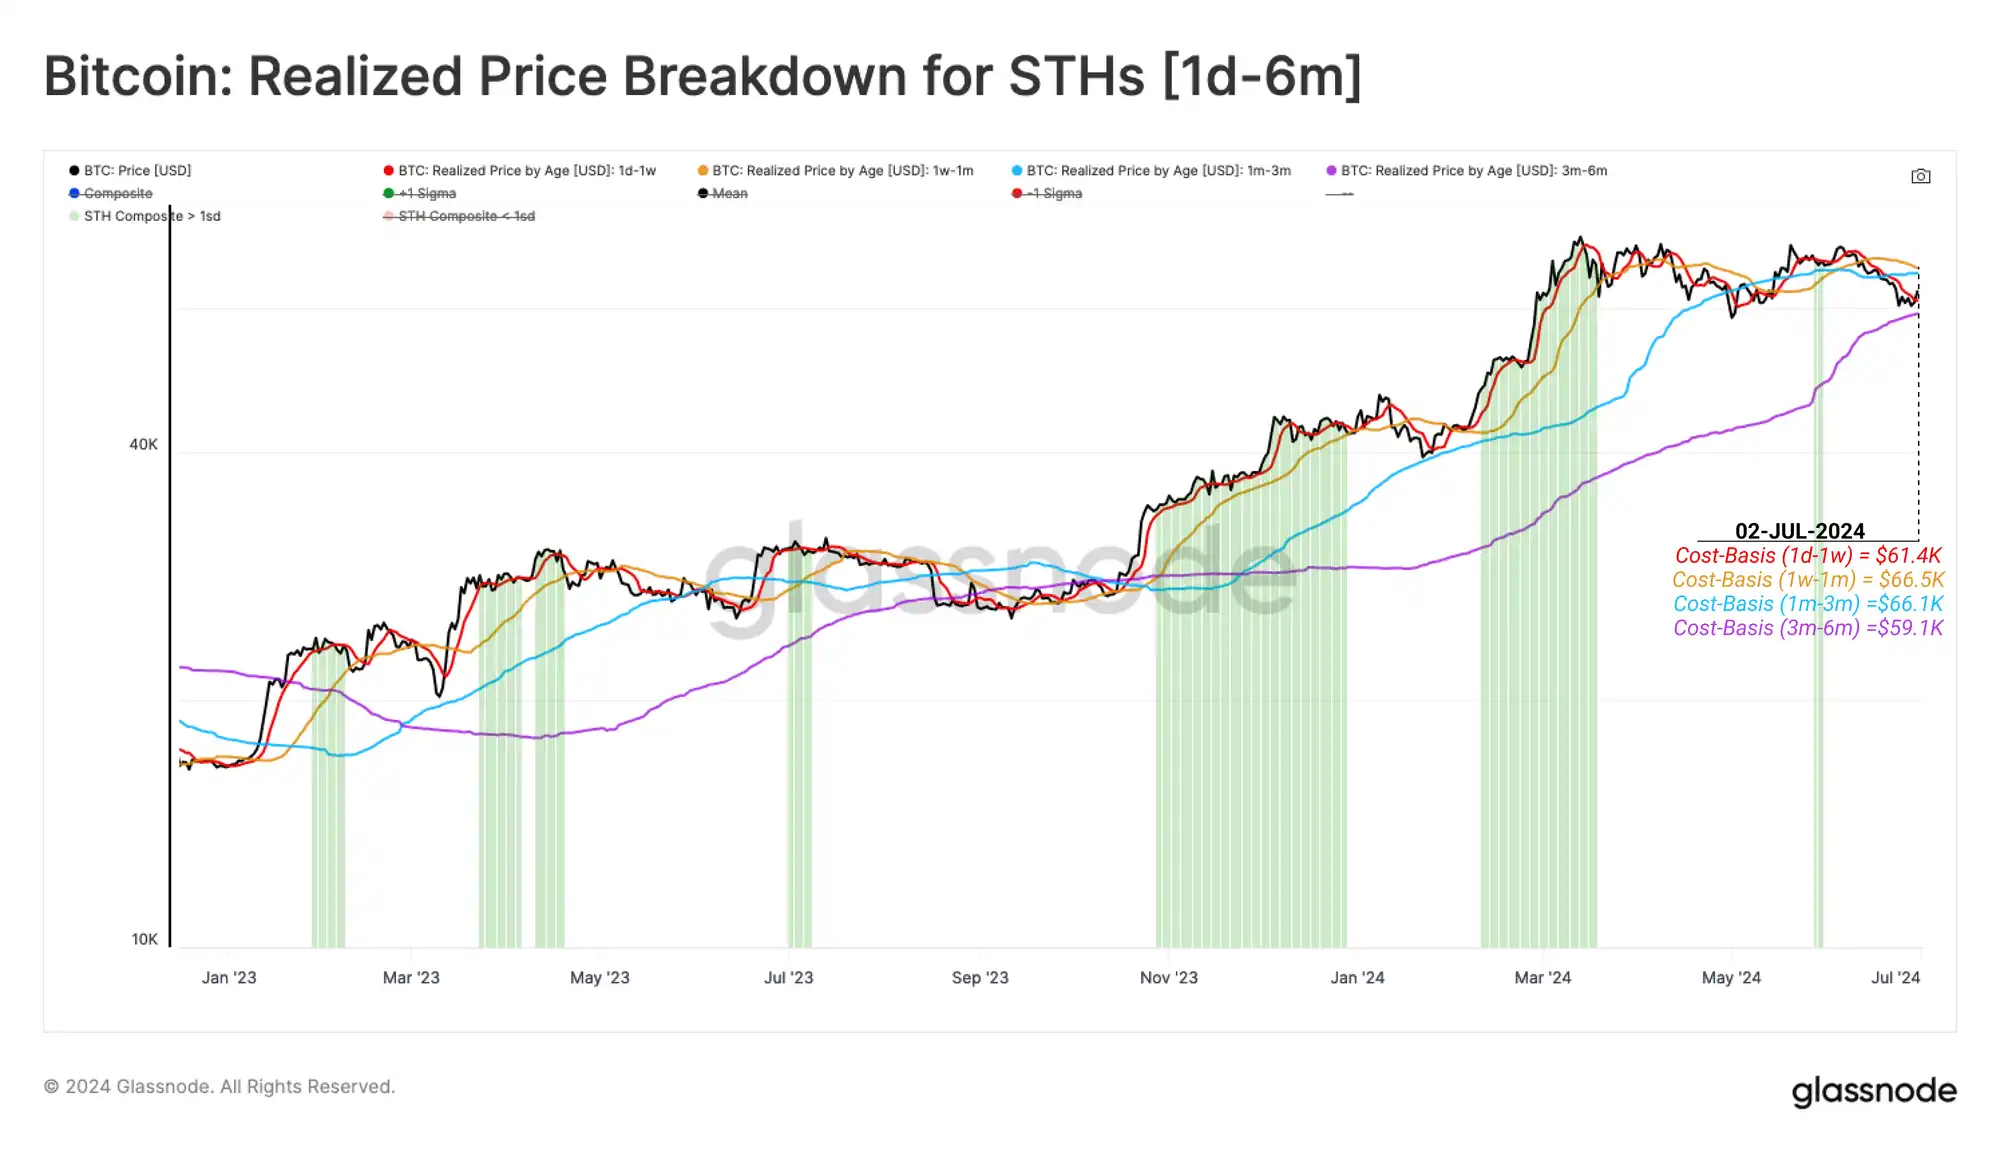
With prices below the short-term holders’ cost basis, it is important to examine the degree of financial stress for different subsets of this group. By segmenting by age, we can dissect and examine the cost basis of different age groups within the short-term holder group.
Currently, coins are on average in unrealized losses for 1 day-1 week, 1 week-1 month, and 1 month-3 months. This suggests that this consolidation range is mostly unproductive for traders and investors.
The 3-6 month cohort is the only subgroup still in unrealized profit, with an average cost basis of $58k. This coincides with the price low of this correction, again marking it as a key area of interest.
Live Workbench
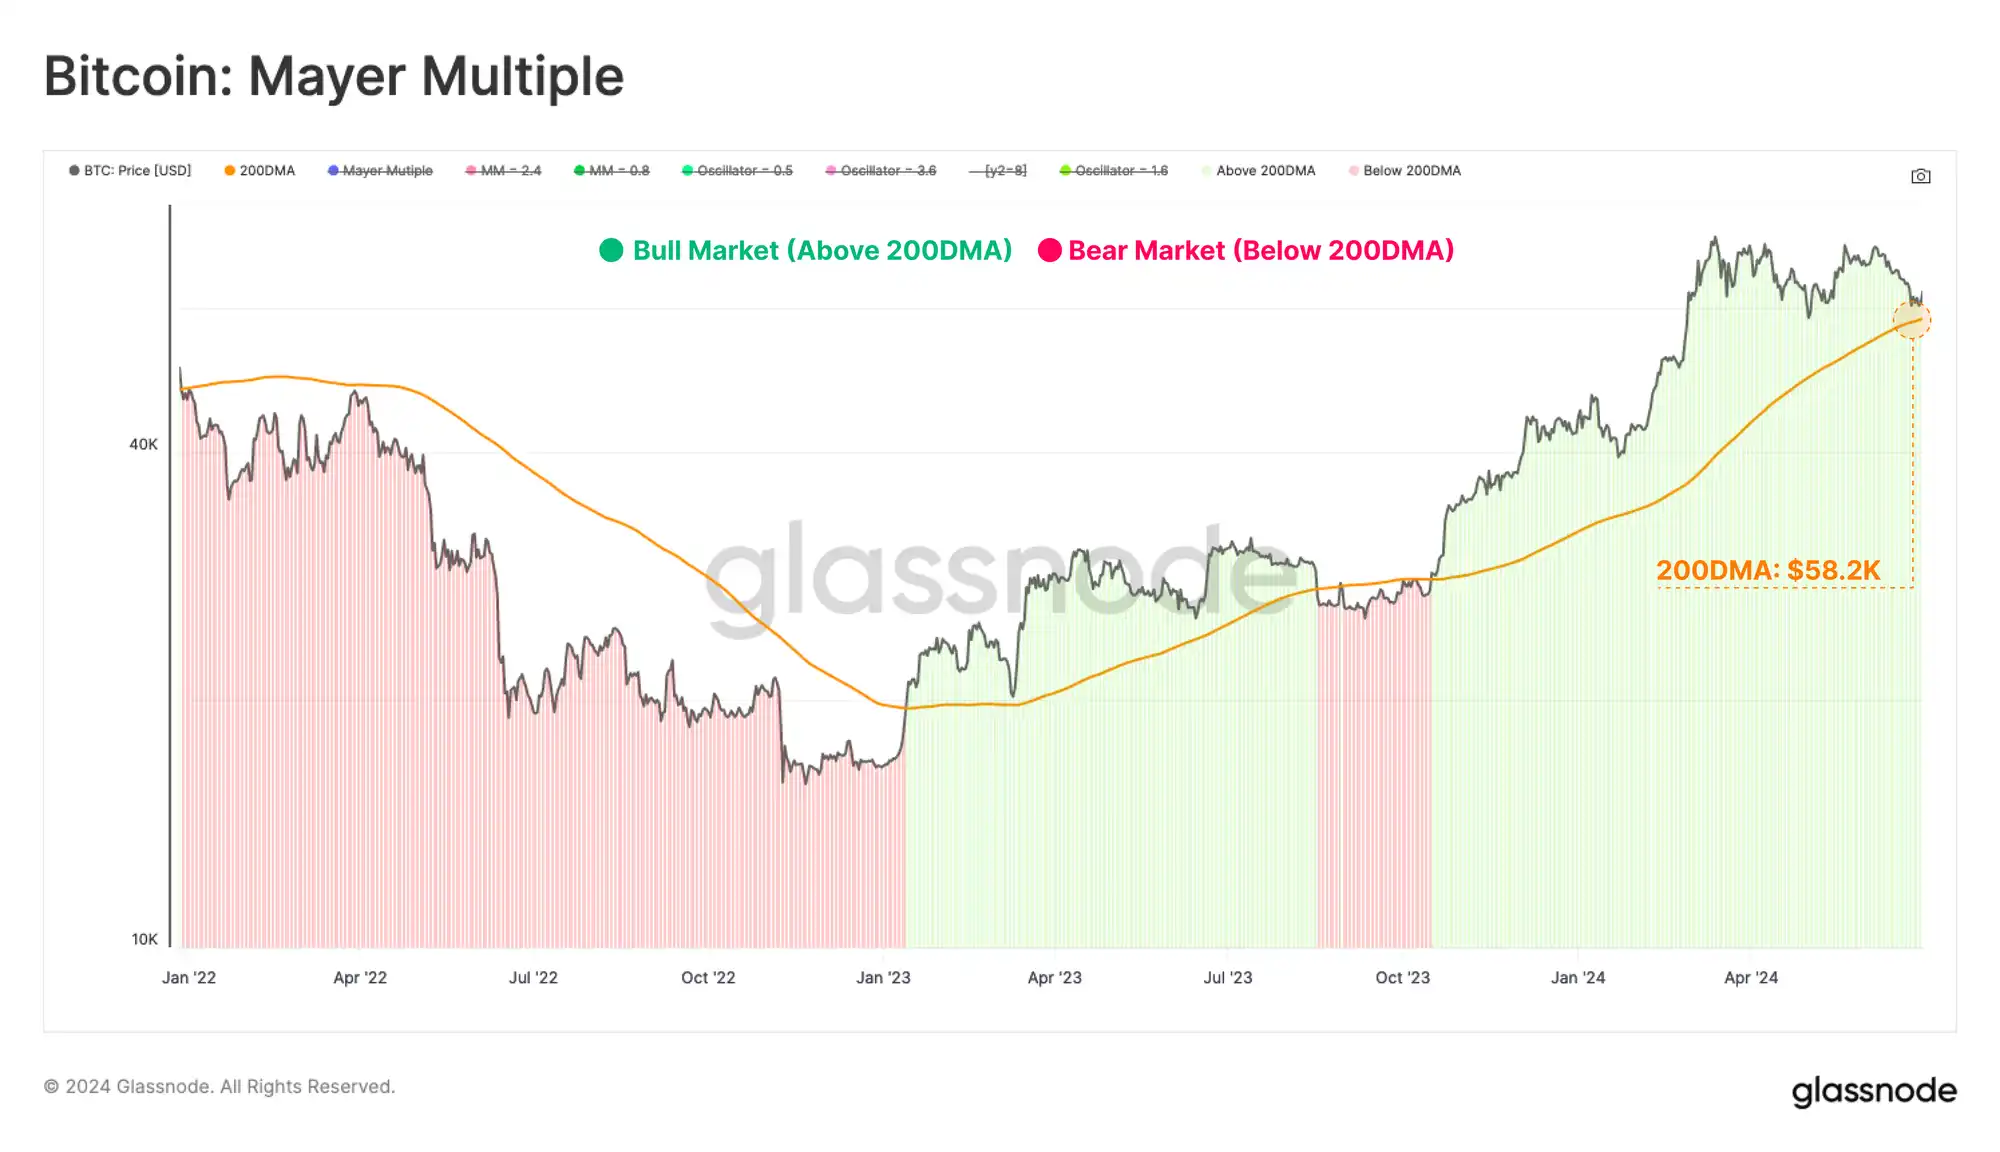
Turning to technical indicators, we can use the Mayer Multiple indicator, which evaluates the ratio of price to the 200 DMA (200-day moving average). The 200 DMA is often used as a simple indicator to evaluate bullish or bearish momentum, making any breakout above or below a key market pivot point.
The 200 DMA is currently valued at $58k, again providing convergence with the on-chain price model.
Live Workbench
We can further assess the concentration of supply around specific cost basis clusters using the URPD metric. Currently, the spot price is near the lower bound of a large supply node between $60k and the all-time high. This is consistent with a cost basis model for short-term holders.
Currently, 2.63 million BTC (13.4% of the circulating supply) are in the $60k to $70k range, and small price fluctuations can significantly affect the profitability of the coin and investor portfolio.
Overall, this suggests that many investors may be sensitive to any price declines below $60k.

Live Chart
Volatility expectations
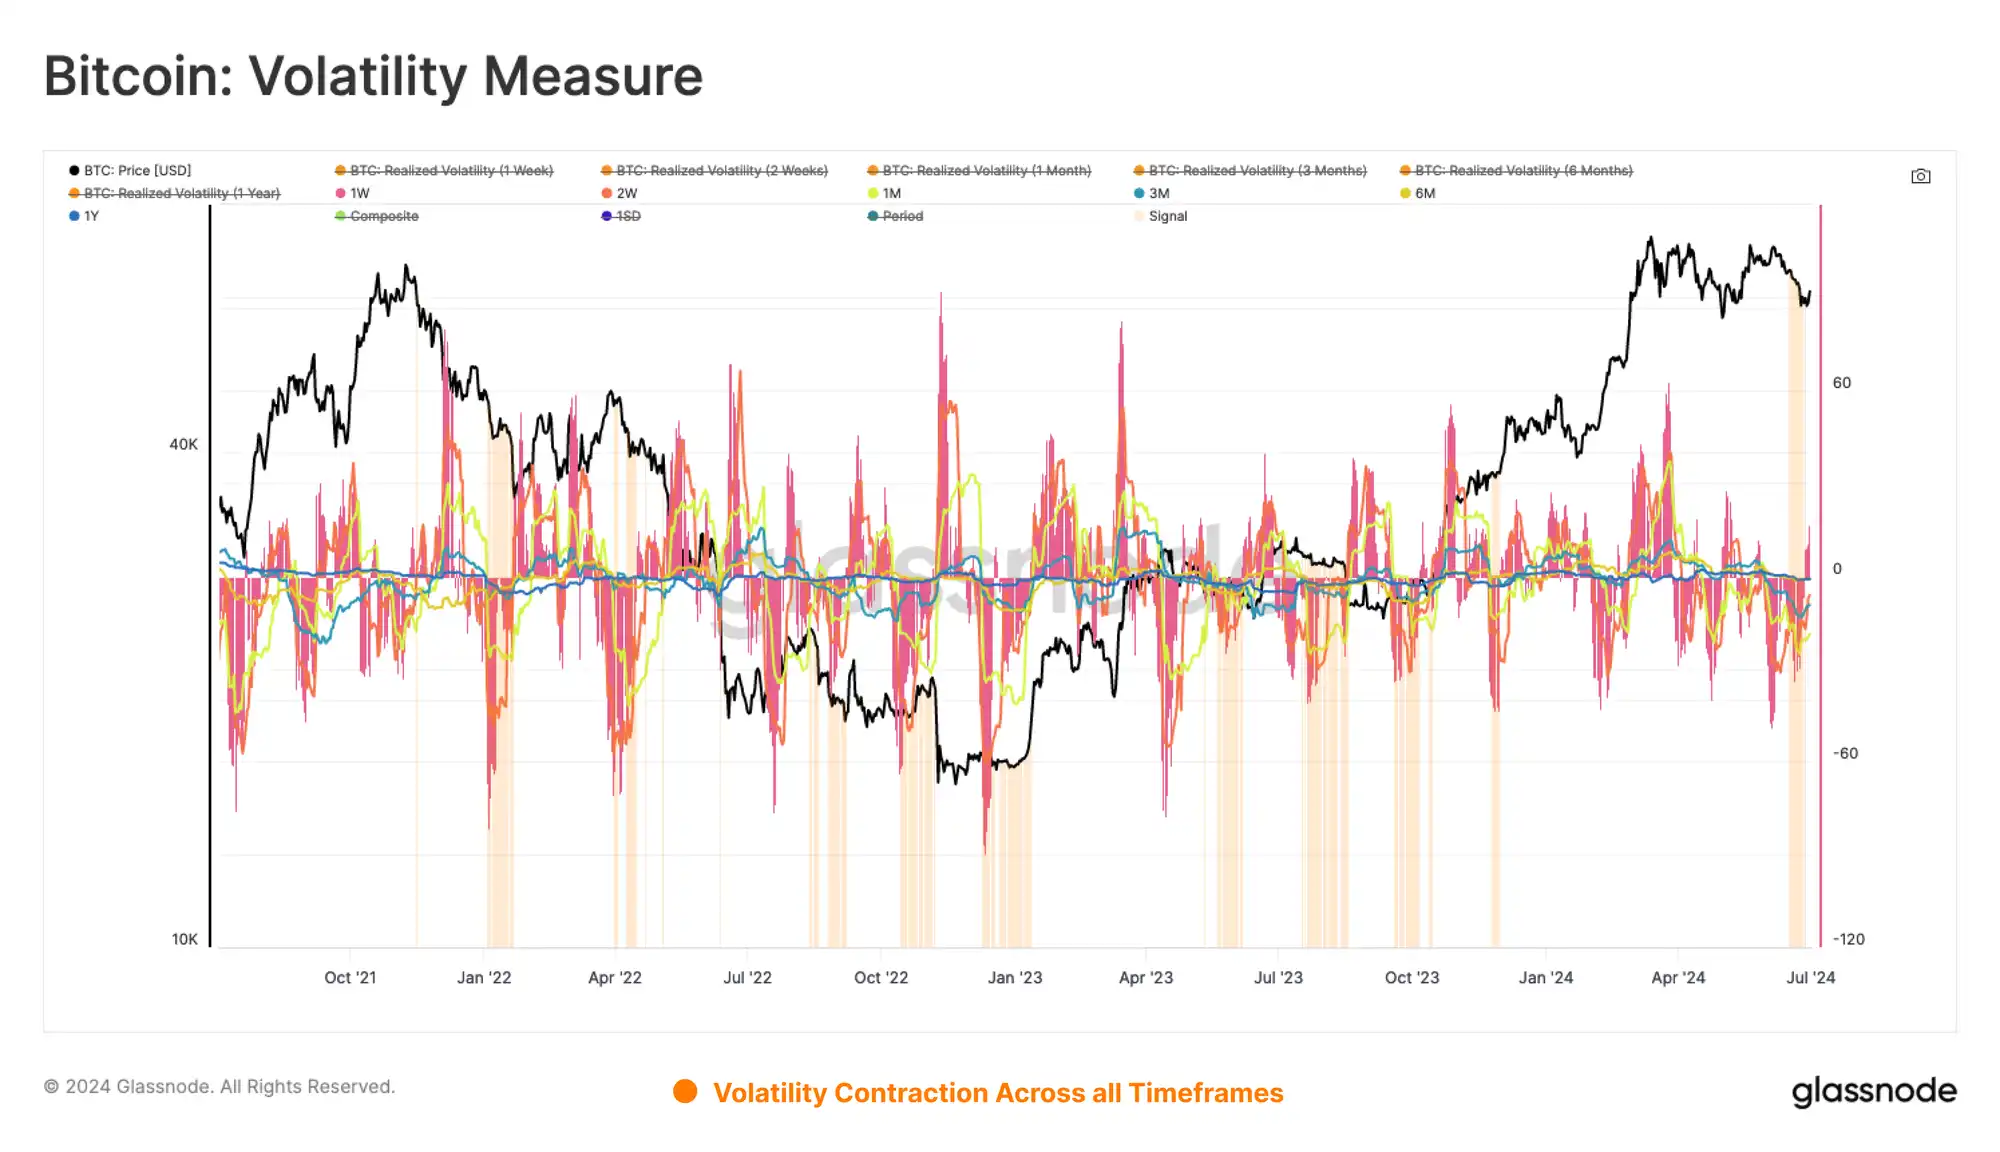
After several months of range-bound price action, we noticed a significant drop in volatility across many rolling window timeframes. To visualize this phenomenon, we introduced a simple tool to detect periods of realized volatility contraction, which generally provides an indication of higher volatility to come.
The model evaluates the 30-day change in realized volatility over the 1-week, 2-week, 1-month, 3-month, 6-month, and 1-year timeframes. A signal is triggered when all windows exhibit a negative 30-day change, inferring that volatility is compressing and investors’ expectations of future volatility are decreasing.
Live Workbench
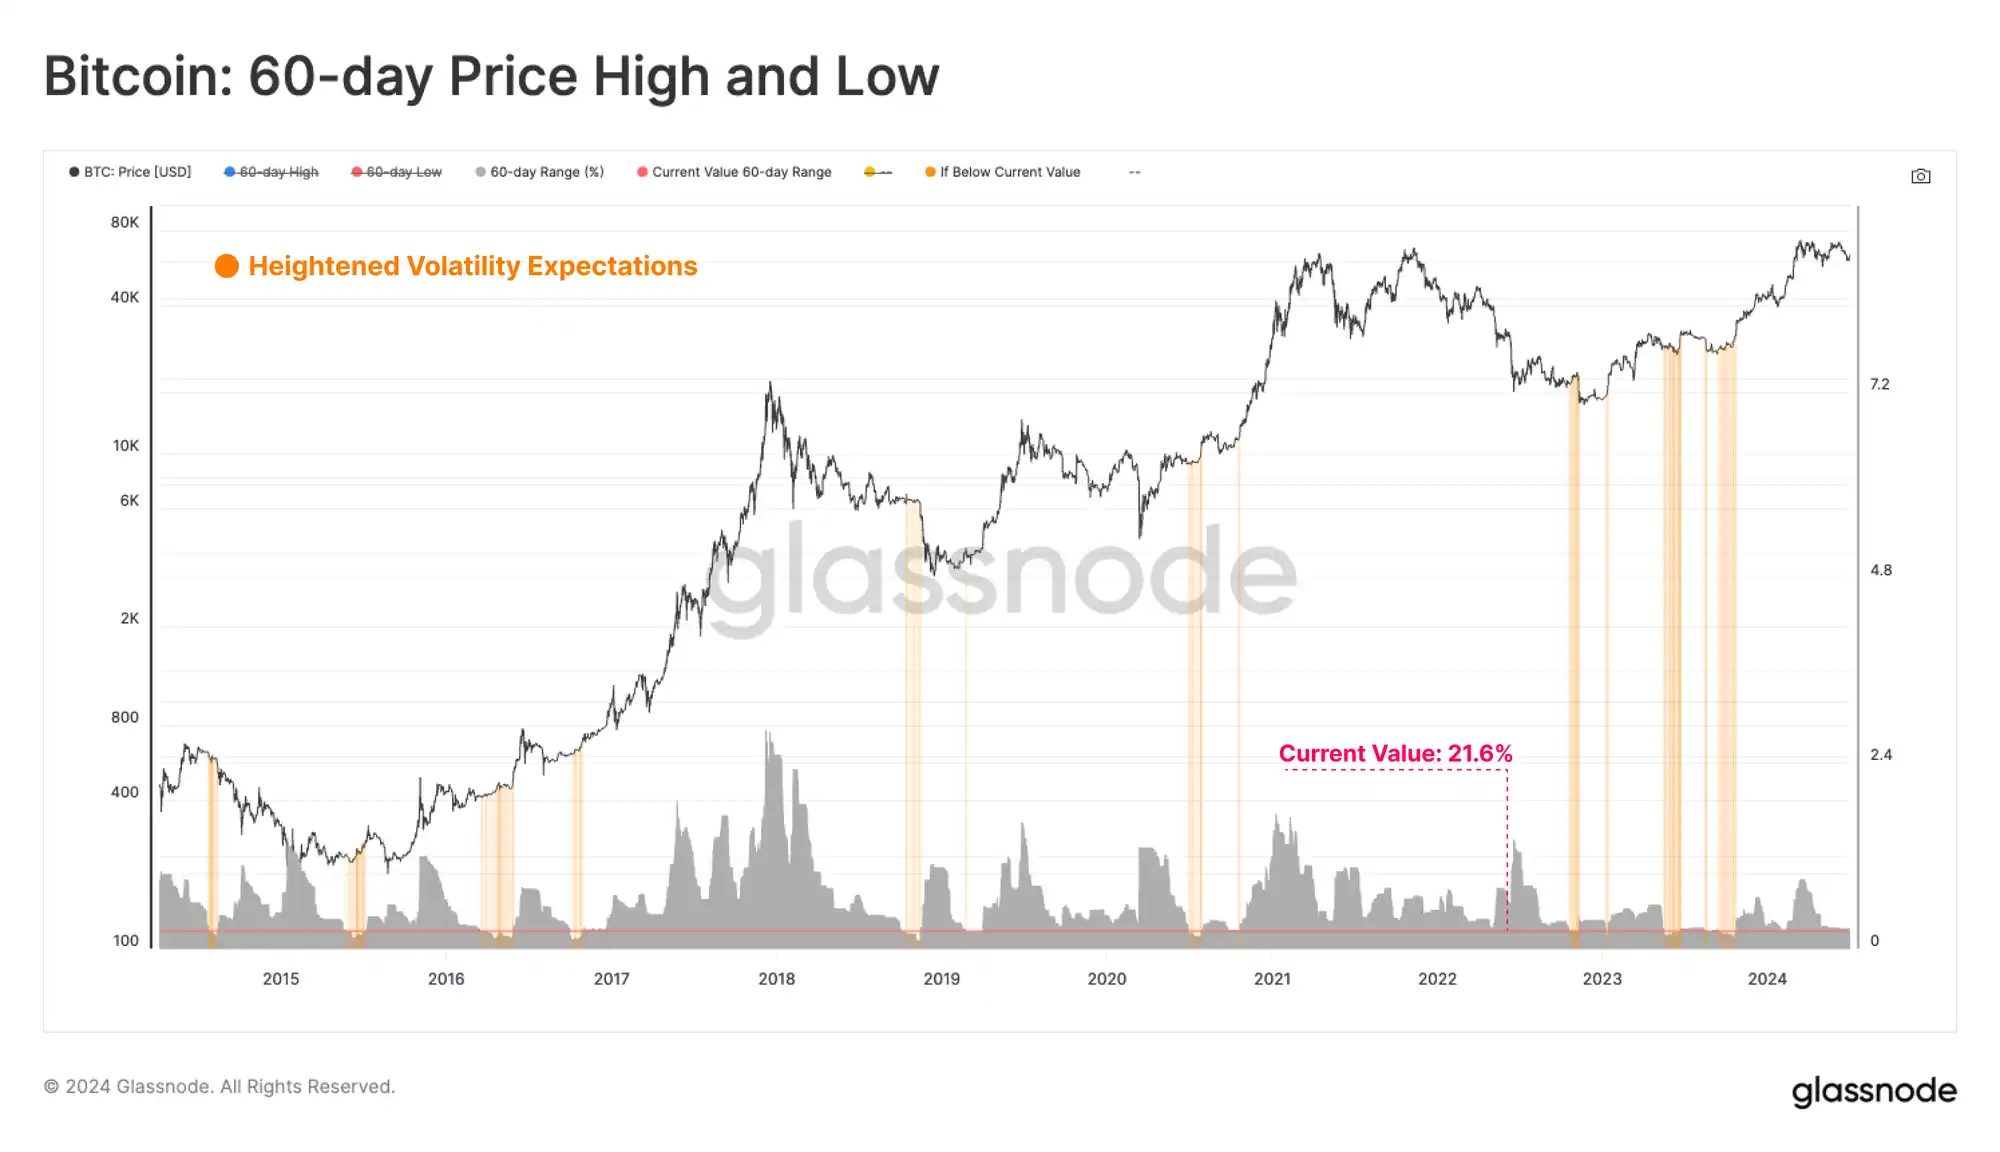
We can also assess market volatility by measuring the percentage range of the highest and lowest price swings over the past 60 days. By this metric, volatility continues to compress to levels that are rarely seen, but usually after long periods of consolidation and before big market moves.
Live Workbench
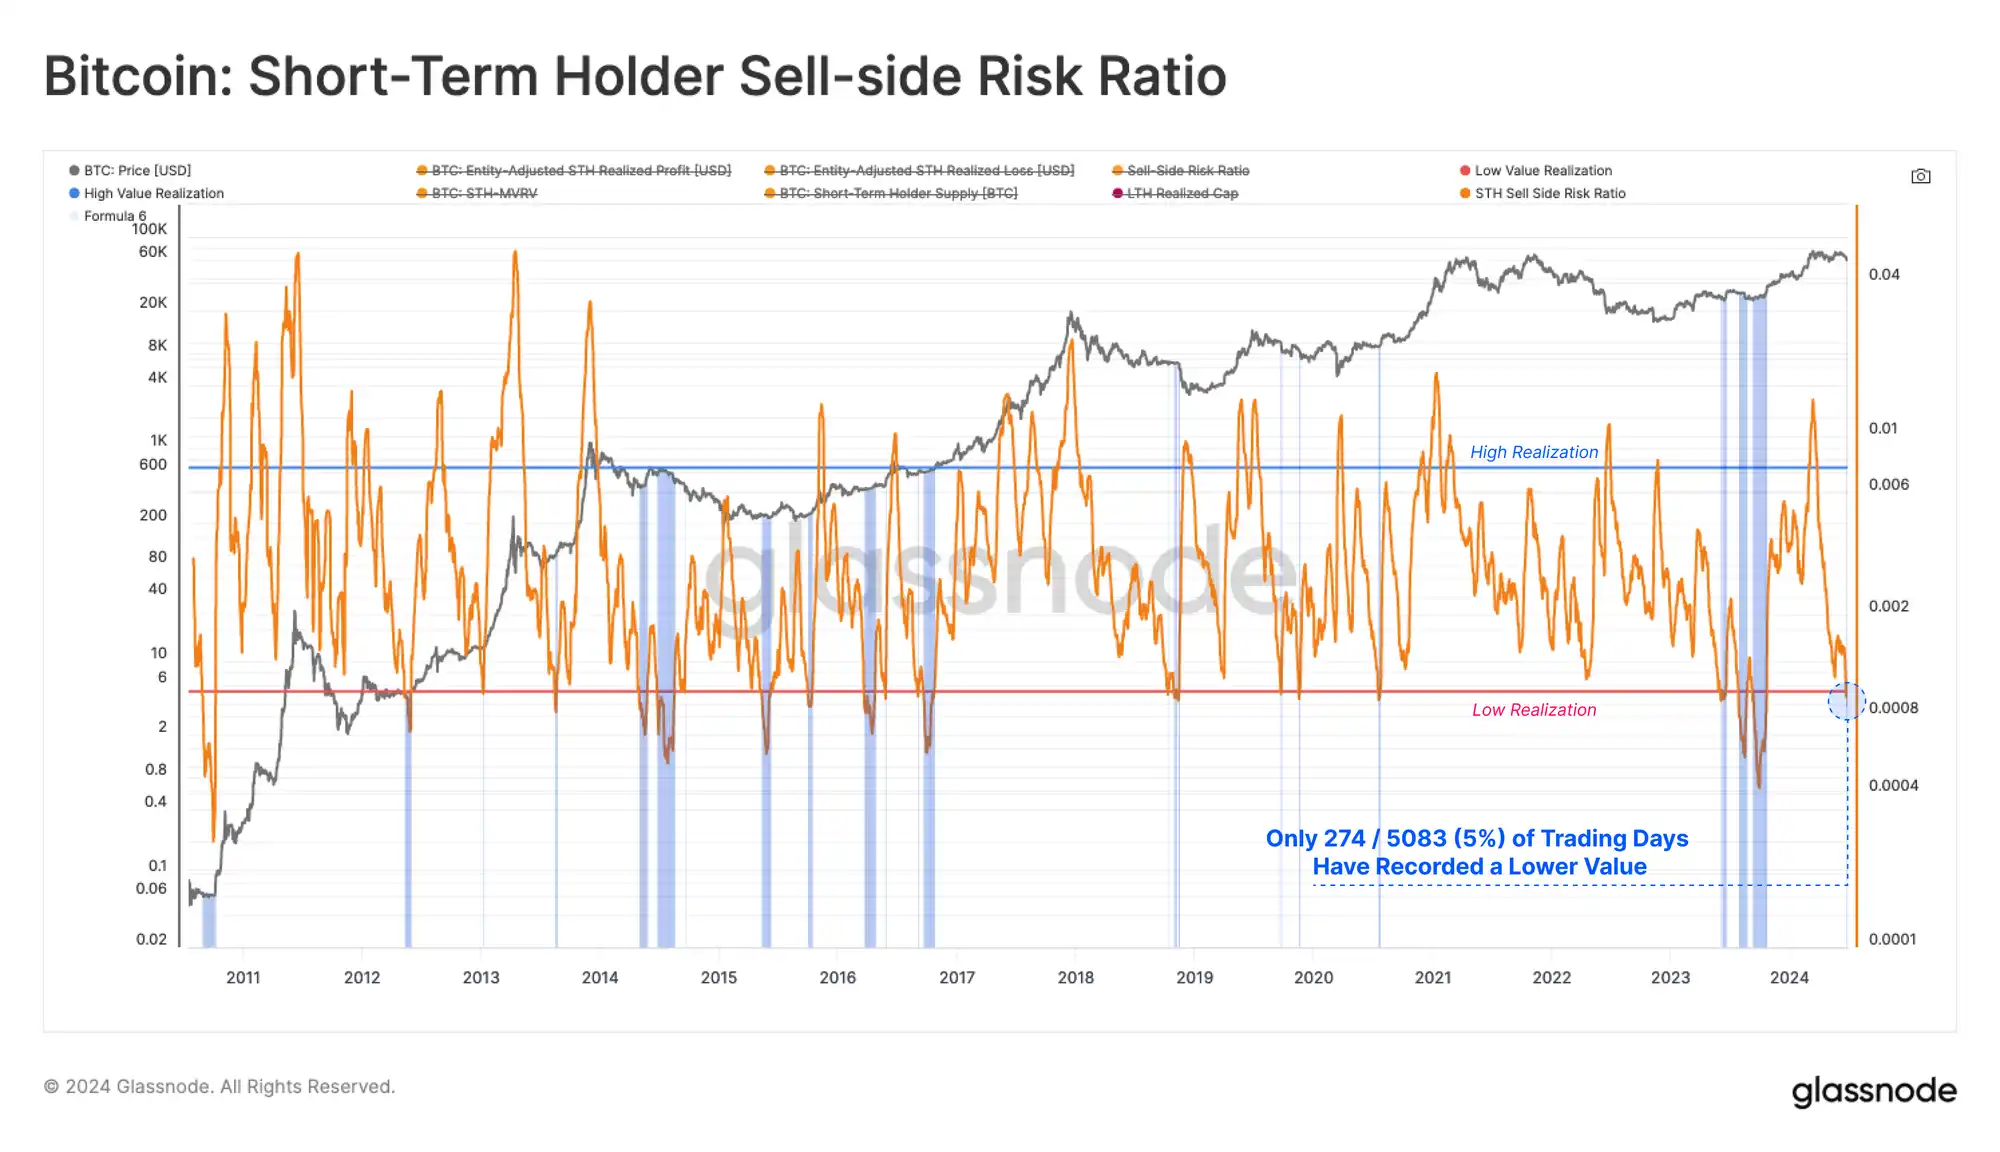
Finally, we can enhance the volatility assessment using the sell-side risk ratio. This tool assesses the absolute sum of realized profits and losses locked in by investors, relative to the size of the asset (realized market value). We can think of this metric according to the following framework:
High values indicate that investors are spending coins at a large profit or loss relative to their cost basis. This situation indicates that the market may need to re-find equilibrium, usually after a high volatility price movement.
Low values indicate that most coins are being spent relative to their breakeven cost basis, indicating that some level of equilibrium has been reached. This situation typically indicates that profit and loss are being exhausted within the current price range, and generally describes a low volatility environment.
It is noteworthy that the short-term holder-seller risk ratio has contracted to a record low, with only 274 of the 5,083 trading days recording a lower value (5%). This suggests that a certain degree of balance has been established during this period of price consolidation and suggests that high volatility can be expected in the near term.
Live Workbench
Résumer
The Bitcoin market is in an interesting phase, where apathy and boredom reign supreme despite the price being 20% below its all-time high. The average coin is still holding 2x unrealized profits, but new buyers are losing money on their positions.
We also explored key factors that could explain a shift in investor behavior patterns. We looked for some degree of convergence in on-chain and technical indicators and came up with three key areas of focus.
-
A break below $58k to $60k would put a large number of short-term holders into losses and move below the 200 DMA price level.
-
The price movement between $60k and $64k continues the current sideways trend of market hesitation.
-
A breakout above $64k would return the coin to profitability for a large number of short-term holders and investor sentiment could rise as a result.
Volatility continues to compress across multiple timeframes, both from a pricing and on-chain data perspective. Indicators such as the sell-side risk ratio and 60-day price range have fallen to all-time lows. This suggests that the current trading range is in the late stages of an expansion to the next range.
This article is sourced from the internet: Glassnode: Volatility continues to shrink historically, and there may be greater volatility in the future
Related: Overview of the development of emerging DEX in Bitcoin Layer 1
Original author: Jonnyhimalaya Original translation: Vernacular blockchain This article explores some of the most promising Layer 1 Bitcoin decentralized exchanges (Dexs) and automated market makers (AMMs). Most of these markets are still under development, and some are only in the testnet stage. In general, these markets can be divided into two categories: order book exchanges and automated market makers. This article conducts research interviews with most of the teams involved. DeFi on Bitcoin is coming. We have already seen the initial appearance of DeFi on Bitcoin, such as Ordinals, Runes, and the emergence of meta-protocols such as BRC 20 and TAP. The community wants to trade shitcoins on Bitcoin, but this situation is about to change! Currently, the experience of trading tokens on Bitcoin is poor and full of friction.…