Rapport de recherche sur le sentiment du marché des crypto-monnaies (2024.06.14-2024.06.21) : les ETF Bitcoin ont été continuellement vendus au cours des dernières années
Bitcoin ETFs have been sold off continuously over the past 5 days
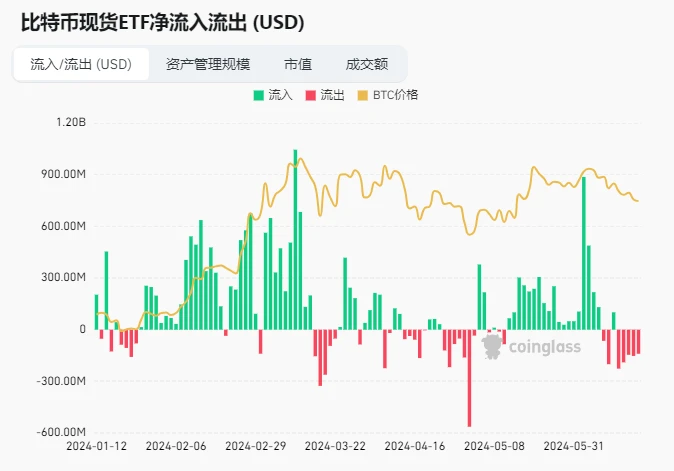
La source de données: https://www.coinglass.com/en/bitcoin-etf
The latest data shows that the US spot Bitcoin ETF set off a selling storm on June 17! A total of 3,169 Bitcoins were sold, worth more than $200 million!
Among them, the well-known institution Fidelity reduced its holdings of 1,224 bitcoins, worth up to $80.34 million, and currently still holds a large amount of bitcoins. Another giant, Grayscale, also reduced its holdings of 936 bitcoins, worth more than $61.4 million. The reduction of holdings by these two giants has undoubtedly brought a lot of shock to the market.
This selling storm has created more uncertainty about the future trend of the Bitcoin market, and more risk management is needed.
There are about 38 days until the next Federal Reserve interest rate meeting (2024.08.01)
https://hk.investing.com/economic-calendar/interest-rate-decision-168
Analyse de l'environnement technique et du sentiment du marché

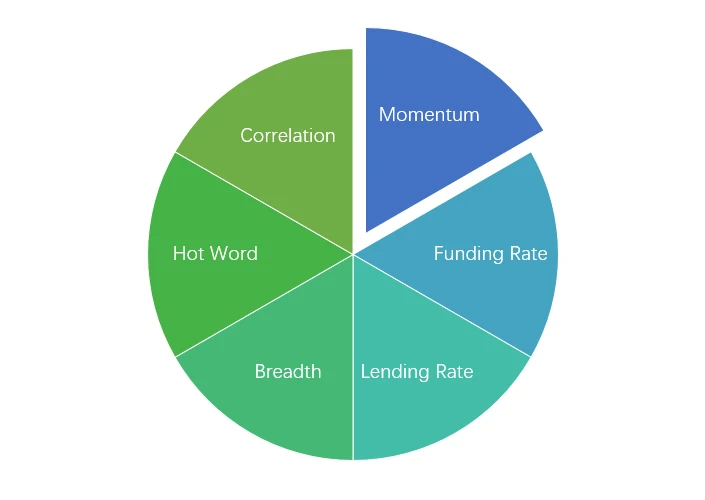
Composants d'analyse des sentiments

Indicateurs techniques
Tendance des prix
Over the past week, BTC prices fell -2.85% and ETH prices rose 1.26%.

L’image ci-dessus est le graphique des prix du BTC au cours de la semaine dernière.
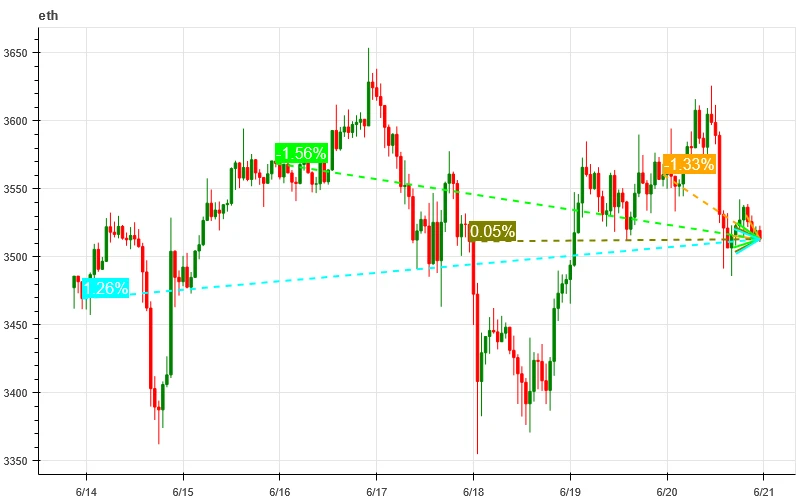
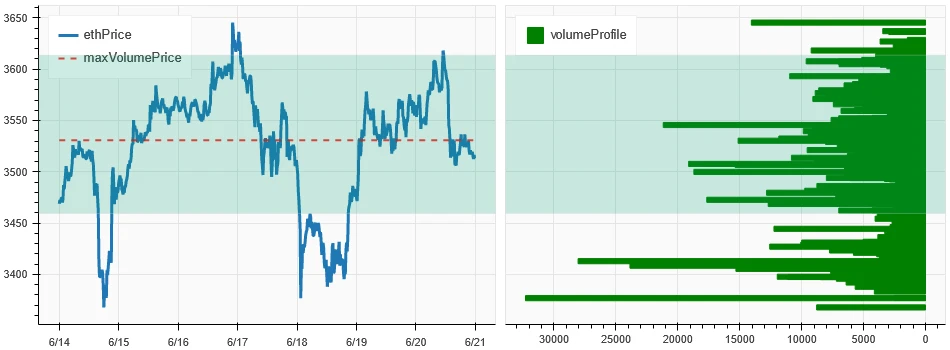
L’image ci-dessus est le graphique des prix de l’ETH au cours de la semaine dernière.
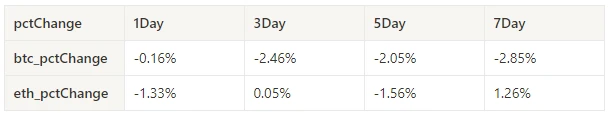
Le tableau montre le taux de variation des prix au cours de la semaine dernière.
Graphique de distribution du volume des prix (support et résistance)
In the past week, BTC and ETH have fluctuated widely in the area of intensive trading.
L'image ci-dessus montre la répartition des zones de trading denses de BTC au cours de la semaine dernière.

L’image ci-dessus montre la répartition des zones de négociation denses d’ETH au cours de la semaine dernière.

Le tableau montre la fourchette de négociation hebdomadaire intensive du BTC et de l’ETH au cours de la semaine dernière.
Volume et intérêt ouvert
BTC and ETH saw the largest volume this past week, with the decline on June 18; open interest for BTC fell while ETH rose slightly.
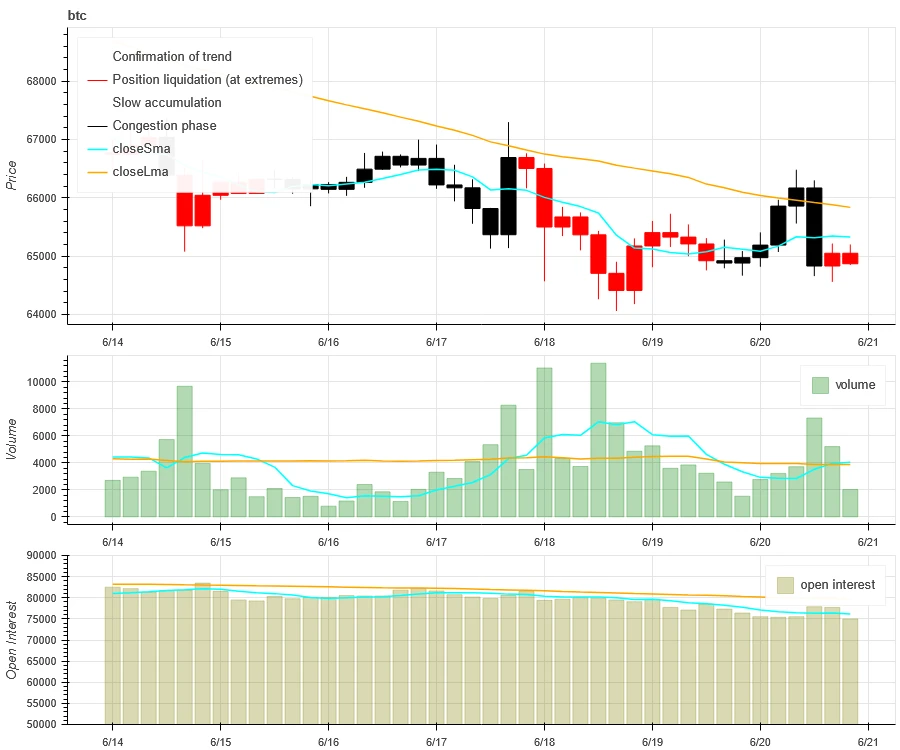
Le haut de l'image ci-dessus montre la tendance des prix du BTC, le milieu montre le volume des transactions, le bas montre l'intérêt ouvert, le bleu clair est la moyenne sur 1 jour et l'orange est la moyenne sur 7 jours. La couleur de la ligne K représente l'état actuel, le vert signifie que la hausse des prix est soutenue par le volume des transactions, le rouge signifie la fermeture des positions, le jaune signifie l'accumulation lente des positions et le noir signifie un état de surpeuplement.

Le haut de l'image ci-dessus montre la tendance des prix de l'ETH, le milieu est le volume des transactions, le bas est l'intérêt ouvert, le bleu clair est la moyenne sur 1 jour et l'orange est la moyenne sur 7 jours. La couleur de la ligne K représente l'état actuel, le vert signifie que la hausse des prix est soutenue par le volume des transactions, le rouge signifie la fermeture des positions, le jaune accumule lentement les positions et le noir est encombré.
Volatilité historique vs volatilité implicite
In the past week, the historical volatility of BTC and ETH was the highest when it fell to 6.14; the implied volatility of BTC and ETH both increased compared to the beginning of the week.

La ligne jaune représente la volatilité historique, la ligne bleue la volatilité implicite et le point rouge la moyenne sur 7 jours.

Piloté par les événements
No data was released in the past week.
Indicateurs de sentiment
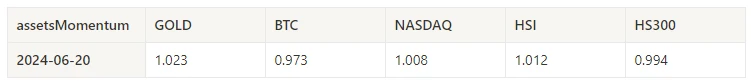
Sentiment d’élan
In the past week, among Bitcoin/Gold/Nasdaq/Hang Seng Index/SSE 300, gold was the strongest, while Bitcoin performed the worst.
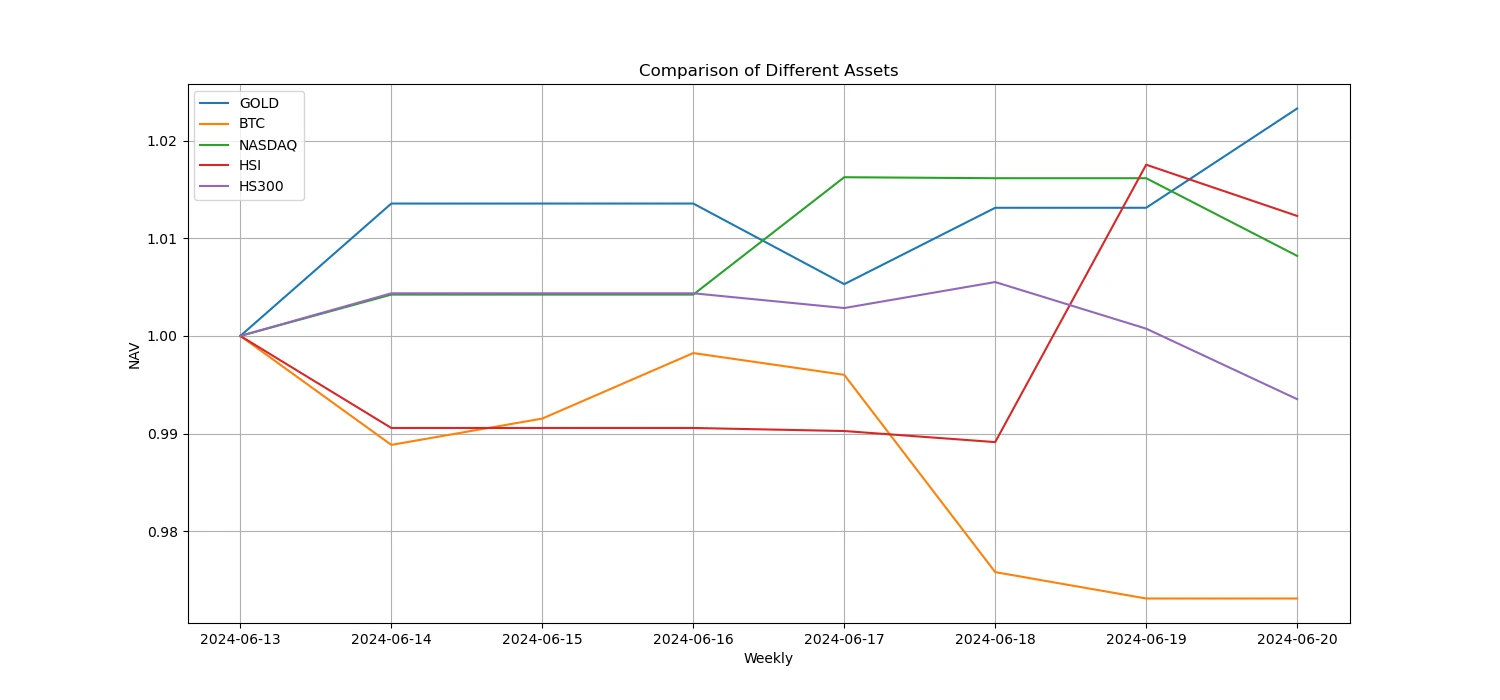
L'image ci-dessus montre la tendance des différents actifs au cours de la semaine dernière.
Taux de prêt_Sentiment de prêt
The average annualized return on USD lending in the past week was 10.8%, and short-term interest rates rebounded to around 12.6%.
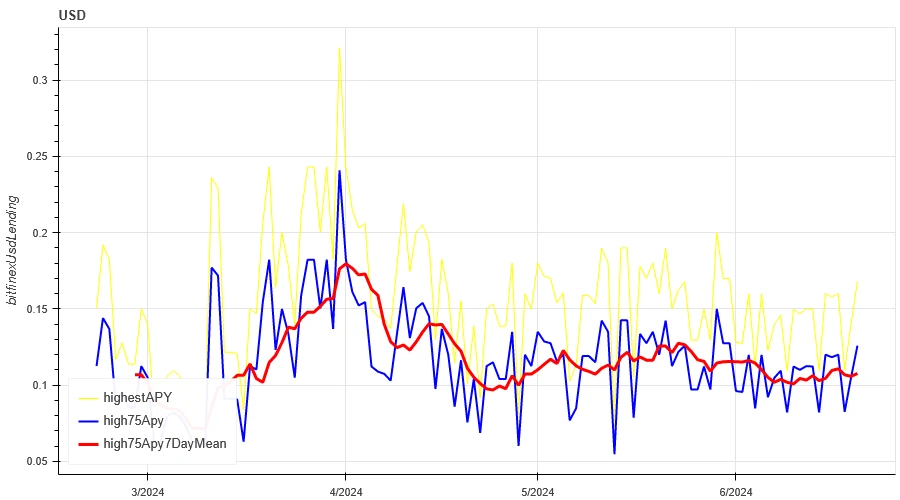
La ligne jaune représente le prix le plus élevé du taux d'intérêt en USD, la ligne bleue représente 75% du prix le plus élevé et la ligne rouge représente la moyenne sur 7 jours de 75% du prix le plus élevé.

Le tableau montre les rendements moyens des taux d'intérêt en USD pour différents jours de détention dans le passé.
Taux de financement_Sentiment de levier du contrat
The average annualized return on BTC fees in the past week was 9.6%, and contract leverage sentiment returned to a low level.

La ligne bleue est le taux de financement du BTC sur Binance, et la ligne rouge est sa moyenne sur 7 jours.
Le tableau montre le rendement moyen des frais BTC pour différents jours de détention dans le passé.
Corrélation du marché_Sentiment de consensus
The correlation among the 129 coins selected in the past week remained at around 0.88, and the consistency between different varieties was at a high level.

In the above picture, the blue line is the price of Bitcoin, and the green line is [1000 floki, 1000 lunc, 1000 pepe, 1000 shib, 100 0x ec, 1inch, aave, ada, agix, algo, ankr, ant, ape, apt, arb, ar, astr, atom, audio, avax, axs, bal, band, bat, bch, bigtime, blur, bnb, btc, celo, cfx, chz, ckb, comp, crv, cvx, cyber, dash, doge, dot, dydx, egld, enj, ens, eos,etc, eth, fet, fil, flow, ftm, fxs, gala, gmt, gmx, grt, hbar, hot, icp, icx, imx, inj, iost, iotx, jasmy, kava, klay, ksm, ldo, link, loom, lpt, lqty, lrc, ltc, luna 2, magic, mana, matic, meme, mina, mkr, near, neo, ocean, one, ont, op, pendle, qnt, qtum, rndr, rose, rune, rvn, sand, sei, sfp, skl, snx, sol, ssv, stg, storj, stx, sui, sushi, sxp, theta, tia, trx, t, uma, uni, vet, waves, wld, woo, xem, xlm, xmr, xrp, xtz, yfi, zec, zen, zil, zrx] overall correlation
Étendue du marché_Sentiment général
Among the 129 coins selected in the past week, 4% of them were priced above the 30-day moving average, 8.6% of them were above the 30-day moving average relative to BTC, 2.4% of them were more than 20% away from the lowest price in the past 30 days, and 4.7% of them were less than 10% away from the highest price in the past 30 days. The market breadth indicator in the past week showed that the overall market was in a continuous decline for most coins.

L'image ci-dessus montre [bnb, btc, sol, eth, 1000 floki, 1000 lunc, 1000 pepe, 1000 sats, 1000 shib, 100 0x ec, 1inch, aave, ada, agix, ai, algo, alt, ankr, ape, apt, arb, ar, astr, atom, avax, axs, bal, band, bat, bch, bigtime, blur, cake, celo, cfx, chz, ckb, comp, crv, cvx, cyber, dash, doge, dot, dydx, egld, enj, ens, eos, etc, fet, fil, flow, ftm, fxs, gala, gmt, gmx, grt, hbar, hot, icp, icx, idu, imx, inj, iost, iotx, jasmy, jto, jup, kava, klay, ksm, ldo, lien, métier à tisser, lpt, lqty, lrc, ltc, luna 2, magie, mana, manta, masque, matic, meme, mina, mkr, près, néo, nfp, océan, un, ont, op, ordi, pendle, pyth, qnt, qtum, rndr, robin, rune, rvn, sable, sei, sfp, skl, snx, ssv, stg, storj, stx, sui, sushi, sxp, theta, tia, trx, t, uma, uni, vétérinaire, vagues, wif, wld, woo,xai, xem, xlm, xmr, xrp, xtz, yfi, zec, zen, zil, zrx] Proportion sur 30 jours de chaque indicateur de largeur

Résumer
Over the past week, the prices of Bitcoin (BTC) and Ethereum (ETH) experienced wide range declines, reaching the peak of volatility on June 18. At the same time, the trading volume of these two cryptocurrencies also reached the highest level during the decline on June 18. Bitcoins open interest volume has declined, while Ethereums open interest volume has increased slightly. In addition, both implied volatilities have increased slightly. In addition, Bitcoins funding rate has fallen to a low level, which may reflect the decline in leverage sentiment of market participants towards Bitcoin. In addition, the market breadth indicator shows that most currencies continue to fall, which indicates that the entire market has generally shown a weak trend over the past week.
Twitter : @ https://x.com/CTA_ChannelCmt
Site web: channelcmt.com
This article is sourced from the internet: Crypto Market Sentiment Research Report (2024.06.14-2024.06.21): Bitcoin ETFs have been continuously sold off in the past 5 days
Originale | Odaily Planet Auteur quotidien | Azuma Le 30 avril à 20h00, heure de Pékin, Kamino, le principal protocole DeFi de l'écosystème Solana, ouvrira officiellement les applications de jetons pour le jeton de gouvernance KMNO. Le 5 avril, Kamino avait ajouté une page de création de jetons à son site officiel. Les utilisateurs pouvaient auparavant interroger les partages de jeton KMNO spécifiques via cette page. La réclamation ouverte de ce soir signifie que les utilisateurs pourront réclamer les actions KMNO établies via cette interface et les échanger sur DEX ou sur un CEX prenant en charge KMNO. Décomposition du modèle économique de Kamino Le modèle économique de Kamino n'est pas compliqué et son produit de base est un protocole de prêt que tout le monde connaît. Selon les données de DeFi Llama, Kamino est actuellement le troisième protocole DeFi et le premier protocole de prêt…