Colonne de volatilité SignalPlus (20240516) : La macroéconomie est positive, le BTC revient à 66 000


Hier (15 mai 2024), d'importantes données économiques ont été publiées. Au cours des derniers jours, trois données consécutives sur l'inflation ont dépassé les attentes, tandis que l'indice CPI américain était à peu près conforme aux attentes ; les données sur le commerce de détail ont été étonnamment stables, prolongeant la faiblesse récente des données sur la consommation. Bien que le niveau et la dynamique actuels de l'inflation soient encore bien supérieurs à l'objectif de la Fed, ces deux données ont apaisé dans une certaine mesure les inquiétudes du marché concernant la réaccélération des prix, ont restauré la confiance du marché dans la baisse des taux de la Fed en septembre et les rendements du Trésor américain ont baissé à court terme. Les trois principaux indices boursiers américains ont également clôturé en hausse d'environ 1%, établissant un record.
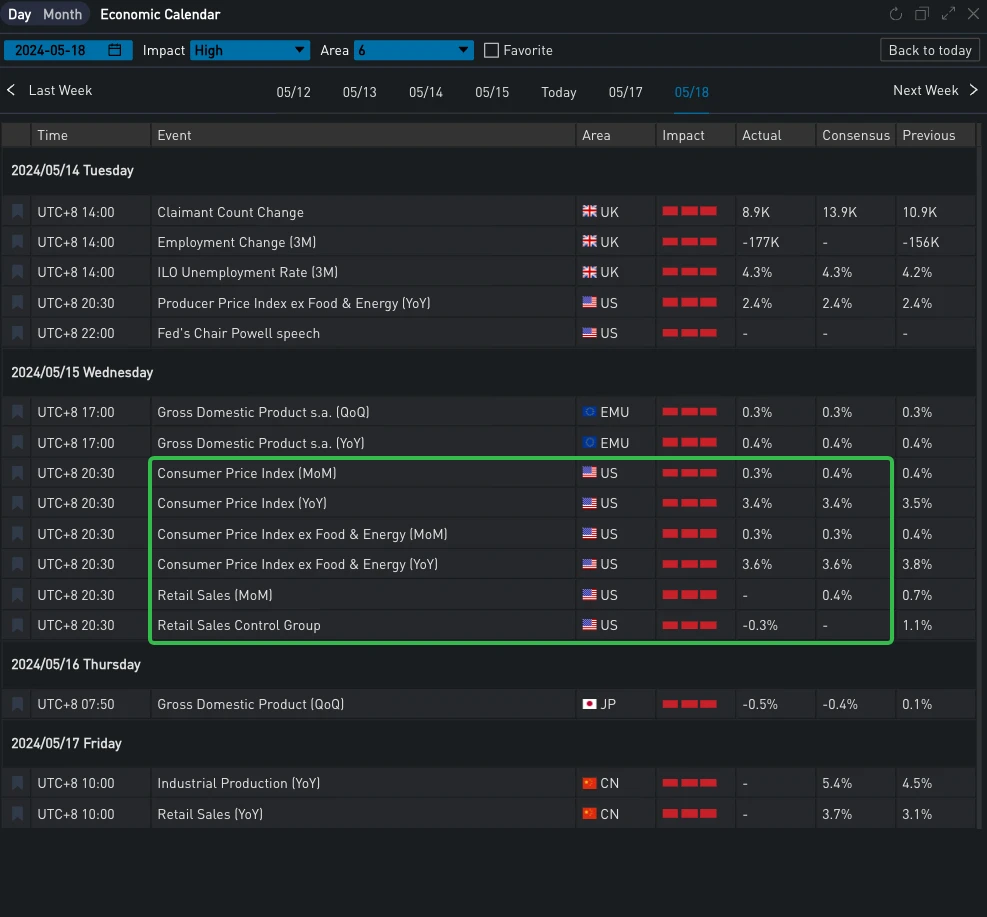
Source : SignalPlus, Calendrier économique

Source : Investir
En termes de monnaies numériques, stimulé par l'affaiblissement des données économiques américaines, le prix du BTC a augmenté jusqu'à franchir la barre des 66 000, attirant le carnaval des communautés. L'afflux récent de l'ETF BTC Spot est également relativement sain. Bien que l'IBIT ne connaisse plus de croissance, l'afflux total par jour a atteint hier 303 $m, principalement contribué par FBTC et BITB. D'autre part, à partir du graphique de comparaison ci-dessous, nous pouvons voir que la performance de l'ETH dans ce cycle de marché est relativement médiocre. Au cours des dernières 24 heures, il n'a gagné que la moitié de l'augmentation du BTC et est revenu aux alentours de 3 000 dollars américains.

Source : TradingView
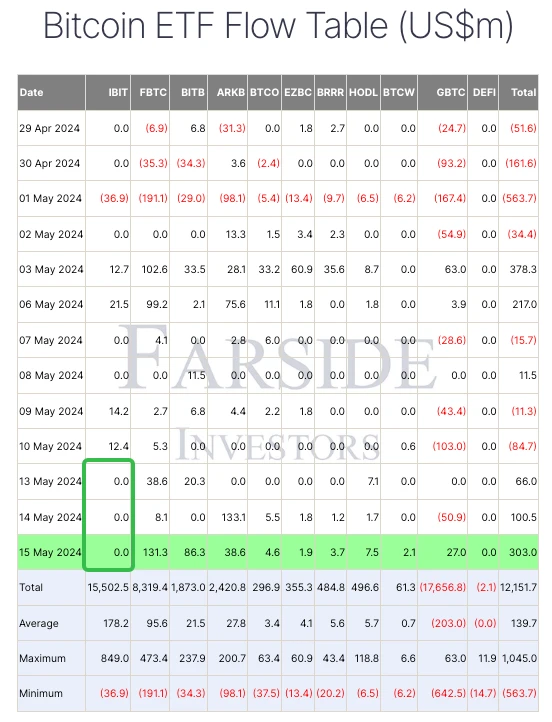
Source : Investisseurs Farside
En termes d'options, les niveaux de volatilité implicite du BTC et de l'ETH ont également montré des changements très différents. Le principal changement du BTC se reflète dans le mouvement à la hausse de l'IV à moyen et long terme. Les transactions en bloc de la journée passée sont également principalement réparties à moyen et long terme. Le plus important est le Long Straddle de 277,5 BTC par jambe, qui est haussier sur la volatilité à la fin du mois de juin, et le spread diagonal de vente de May et d'achat de June Call. L'IV front-end de l'ETH a fortement chuté, attirant un groupe de transactions Buy 17 MAY vs Sell 24 MAY avec un volume allant jusqu'à 19 450 ETH par jambe sur le bloc. Dans le même temps, il existe également de nombreuses positions d'options d'achat sur la chaîne d'options à la fin du mois de mai. Bien que l'ETH ait enregistré des performances relativement médiocres récemment, il existe toujours des traders qui paient pour son prochain espace de hausse.
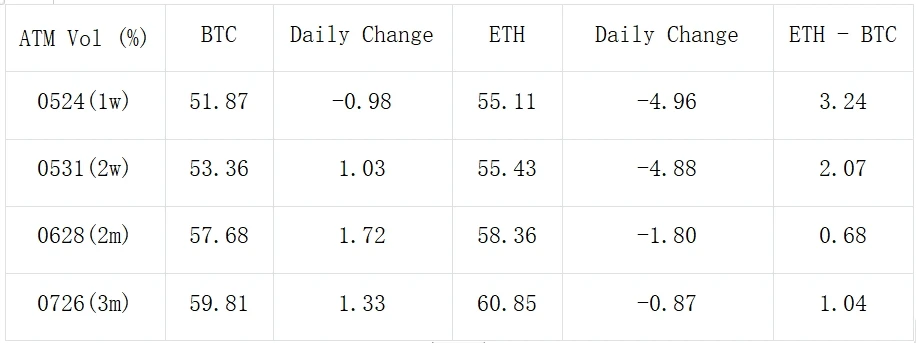
Source : Deribit (au 16 MAI 16:00 UTC+ 8)

Source : SignalPlus
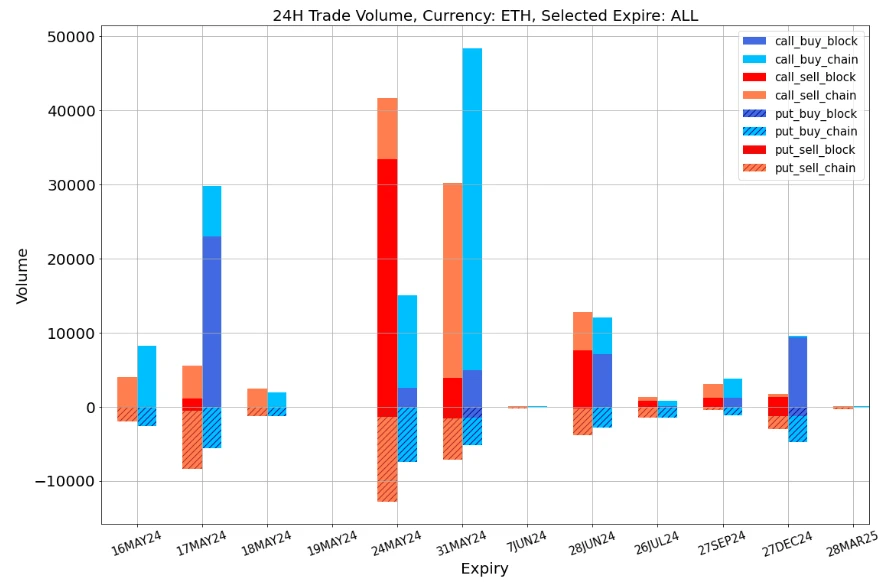
Source de données : Deribit, répartition globale des transactions ETH
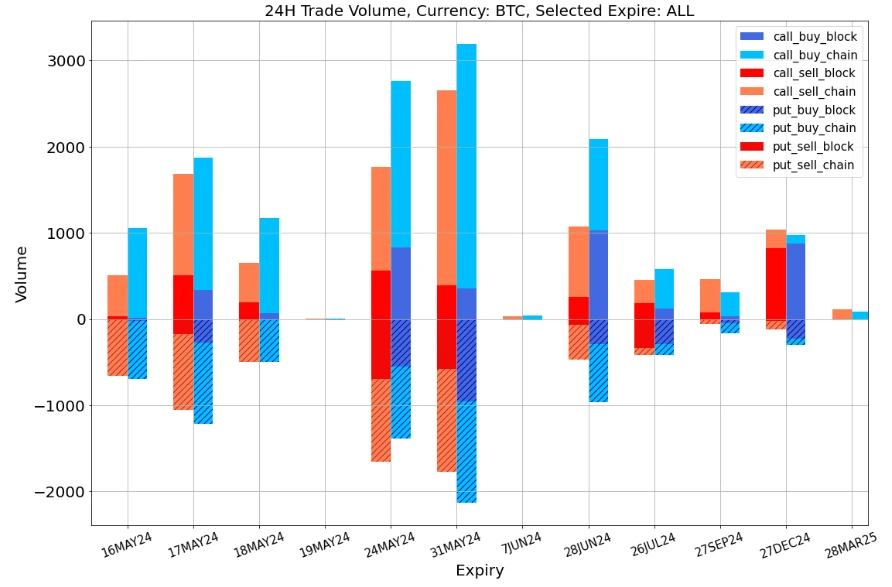
Source de données : Deribit, répartition globale des transactions BTC
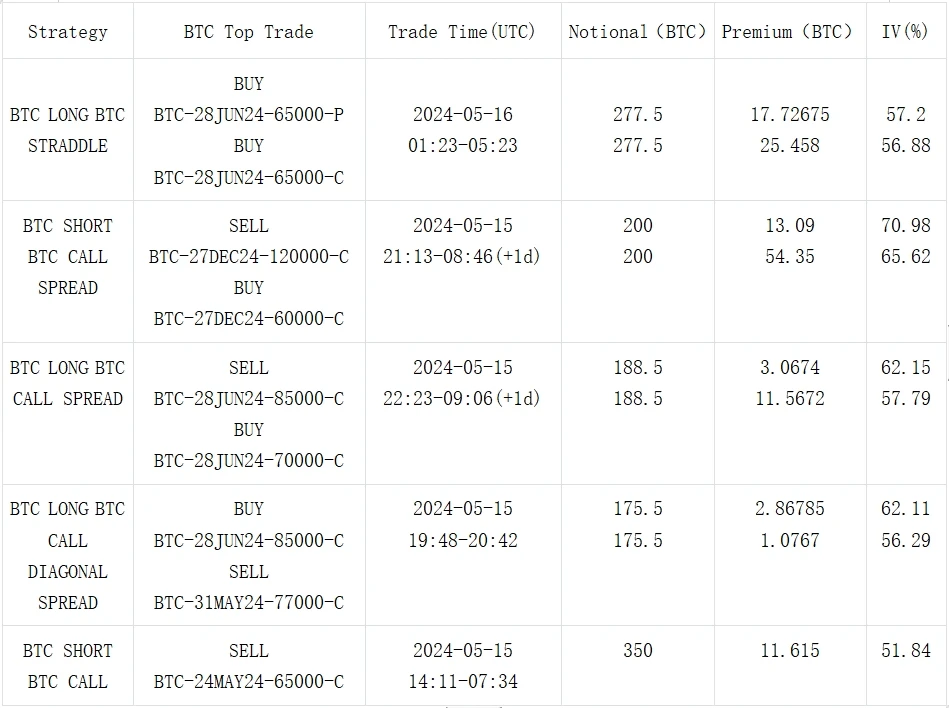
Source : échange de blocs Deribit
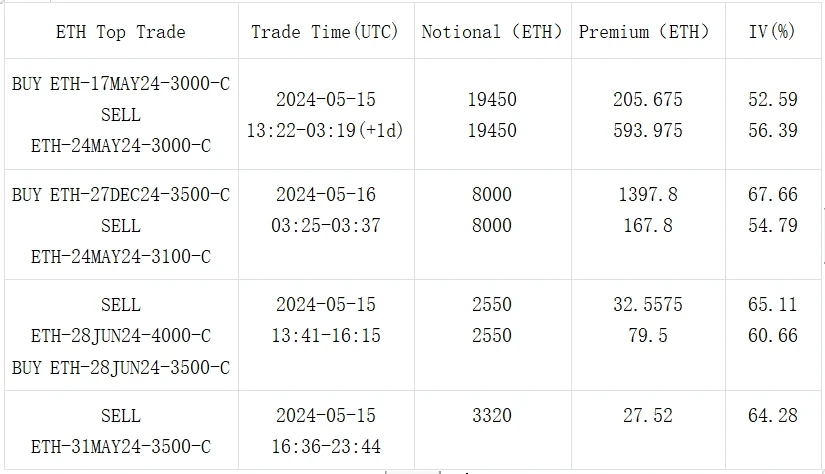
Source : échange de blocs Deribit

Vous pouvez rechercher SignalPlus dans le Plugin Store de ChatGPT 4.0 pour obtenir des informations de cryptage en temps réel. Si vous souhaitez recevoir nos mises à jour immédiatement, veuillez suivre notre compte Twitter @SignalPlus_Web3, ou rejoindre notre groupe WeChat (ajouter l'assistant WeChat : SignalPlus 123), le groupe Telegram et la communauté Discord pour communiquer et interagir avec plus d'amis. Site officiel de SignalPlus : https://www.signalplus.com
Cet article provient d'Internet : SignalPlus Volatility Column (20240516) : La macroéconomie est positive, le BTC revient à 66 000
Connexes : Prédiction des prix Fantom (FTM) : peut-il atteindre un nouveau sommet sur 2 ans ?
En bref L'offre de FTM entre les mains des commerçants a considérablement diminué ces derniers jours, indiquant une augmentation du nombre de détenteurs à moyen et long terme. Le RSI FTM à 7 jours est actuellement à 77, contre 81 la semaine dernière, indiquant toujours un statut de surachat. Les lignes EMA décrivent un scénario haussier, et nous pourrions bientôt voir un sommet sur 2 ans pour le prix FTM. La diminution de l'offre de FTM parmi les traders au cours des derniers jours signale un changement notable vers l'accumulation par les détenteurs à moyen et long terme, suggérant une confiance renforcée dans les perspectives d'avenir du FTM. Le prix du FTM est soutenu par le sentiment positif du marché, son RSI sur 7 jours indiquant un intérêt élevé des investisseurs malgré le fait qu'il soit dans la zone de surachat. La tendance haussière suggérée par les lignes de la moyenne mobile exponentielle (EMA) fait allusion à…


