My XP
0
Acceso
Autor original: Viee, colaborador principal de Biteye
Editor original: Crush, colaborador principal de Biteye
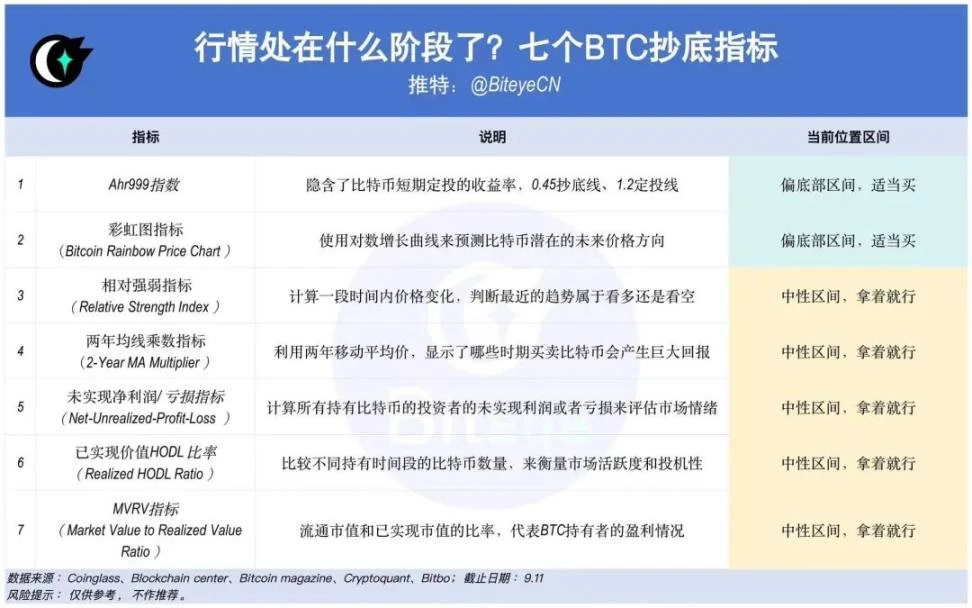
What stage is the market at?
Is the market bullish or bearish? Can you still buy at the bottom?
The price has dropped so much that it鈥檚 frightening. Is the bull market still there?
In order to better analyze the current trend, Biteye has compiled 7 BTC bottom-picking indicators.
Help you judge market sentiment and currency price fluctuations from multiple perspectives! Forward and collect, and learn slowly!
Current value: 0.6, in the fixed investment range
Interpretation: The indicator implies the rate of return of short-term fixed investment in Bitcoin and the deviation of Bitcoin price from expected valuation.
0.45 bottom line, 1.2 fixed investment line
When the AHR 999 index is
When the AHR 999 index is between 0.45-1.2, the indicator will recommend buying fixed investment
When the AHR 999 index > 1.2, the price of the currency is already high and it is not suitable for operation.
Trend review: The index has been fluctuating around 1.2 since mid-April, and has completely fallen below 1.2 since June, entering the fixed investment range. In the past three months, it has been approaching the bottom line of 0.45.
Current value: In a relatively cold market range, suitable for buying
Interpretation: Use the logarithmic growth curve to predict the potential future price direction of Bitcoin. There are 10 color bands in total. The warmer colors on the top indicate that the market is overheated, which is a better selling point; the colder colors indicate that the market sentiment is depressed, which is a better buying point.
Trend review: Bitcoin prices have been basically in a cooler range this year. The market is not yet overheated, and recent prices are suitable for buying.
Current value: 58.41, not yet reaching the bottom-picking range
Interpretation: The RSI indicator determines whether the recent trend is bullish or bearish by calculating price changes over a period of time. The score is evaluated relative to the previous 12 months.
A high RSI means that price action is very positive relative to the previous 12 months.
A low RSI means that price movement is very negative relative to the previous 12 months.
RSI >70: Bitcoin is overbought and may fall soon, so you can sell it
RSI
Trend review: From the perspective of historical prices, the RSI indicator has not been lower than 30. When referring to this indicator, it can be judged as the closer to 30, the more oversold, and the closer to 70, the more overbought.
Current value: BTC 57604 USD, in the price neutral range
2 YMA: 38,018
2 YMA x 5: 190,092
Interpretation:
Using the 2 Year Moving Average (green line), and the 5x product of that moving average (red line), we highlight the periods when buying and selling Bitcoin would have produced huge returns.
Precio
Price > 2 YMA x 5 (red line): Price is at a historical high, sell at the top
If the price is between the moving averages, it is in a neutral position.
Trend review: Currently in the neutral range, it is not the time to buy the bottom. From May 22 to October 23, the indicator was in the bottom-hunting range.
Current value: 45.33%, not the best buying range
Interpretation: Assess market sentiment by calculating the unrealized profits or losses of all investors holding Bitcoin.
NUPL
NUPL 0-0.25: Micro-profit area, also suitable for buying
NUPL 0.25-0.5: Bull-bear transition, slowly entering the bull market
NUPL 0.5-0.75: Strong bullish sentiment
NUPL 0.75-1: Extremely greedy, considering escaping the top
That is, the further NUPL deviates from 0, the closer the market trend is to the bottom or top.
Trend review: Since January 2023, the market has been out of the loss range and gradually profitable. From February to July this year, RSI was 0.5, and the bullish sentiment was strong. However, in the past two months, RSI fell to the 0.25-0.5 range, and market sentiment also fell.
Current value: 2689.22, neutral range
Interpretation: By comparing the number of bitcoins held in different time periods, such as the number of UTXOs (unspent transaction outputs) in the short term (within 1 month) and the long term (more than 1 year), the market activity and speculation are measured. A higher value means that there are more short-term holders and the market is highly speculative; a lower value means that there are more long-term holders and the market is relatively stable.
When approaching the red zone, the market is overheated and it is suitable for profit taking.
When approaching the green area, the price of the currency is relatively cold, suitable for bottom-fishing buying
Trend Review: Since January 2023, RHODL Ratio has gradually moved out of the green area and shown an upward trend. It has been in a volatile downward trend in the past few months, reflecting that the market heat has subsided, but it has not yet completely entered the cooling stage.
Current value: 1.83, the market has not entered the bottom range
Interpretation: MVRV is a relative indicator, which is the ratio of the circulating market value (Market Cap, MV) to the realized market value (Realized Cap, RV), that is, the ratio of the total market value of BTC to the market value calculated from the last activity price of BTC, representing the profitability of BTC holders.
MVRV > 3.5, the market has reached its peak, holders will make a large profit and tend to sell
MVRV
Trend review: Over the past three or four months, the indicator has been on a downward trend, and holders profits have slowly decreased. The closer it is to the bottom range, the easier it is for the market to rebound.
This article is sourced from the internet: Will the market reverse? Check out 7 indicators for Bitcoin bottom-fishing
Related: Bitlayer announces $11 million Series A funding to build Bitcoin computing layer
On July 23, Bitlayer, the first Bitcoin second-layer project based on BitVM, announced the completion of a US$11 million Series A financing round . This round of financing was jointly led by first-tier investment institutions Franklin Templeton Digital Assets and ABCDE Capital. Framework Ventures, which previously led Bitlayers seed round, also continued to participate in this round of financing. In addition to the lead investors, investment institutions such as Stake Capital Group, WAGMI Ventures, Skyland Ventures, Flow Traders, GSR Ventures, FalconX, Metalpha, 280 Capital, Presto Labs and Caladan, as well as well-known angel investors such as BRC 20 founder DOMO and FactBlock KBW co-founder Brian Kang also participated in this round of financing. Bitlayer is a Bitcoin Layer 2 project strategically invested by Franklin Templeton, a Bitcoin spot ETF service…


