Task
Ranking
已登录
Bee登录
Twitter 授权
TG 授权
Discord 授权
去签到
下一页
关闭
获取登录状态
My XP
0

Fuente de imagen: https://www.cnbc.com/2024/08/13/wednesdays-cpi-report-could-mark-a-change-in-thinking-for-the-fed.html?qsearchterm=CPI
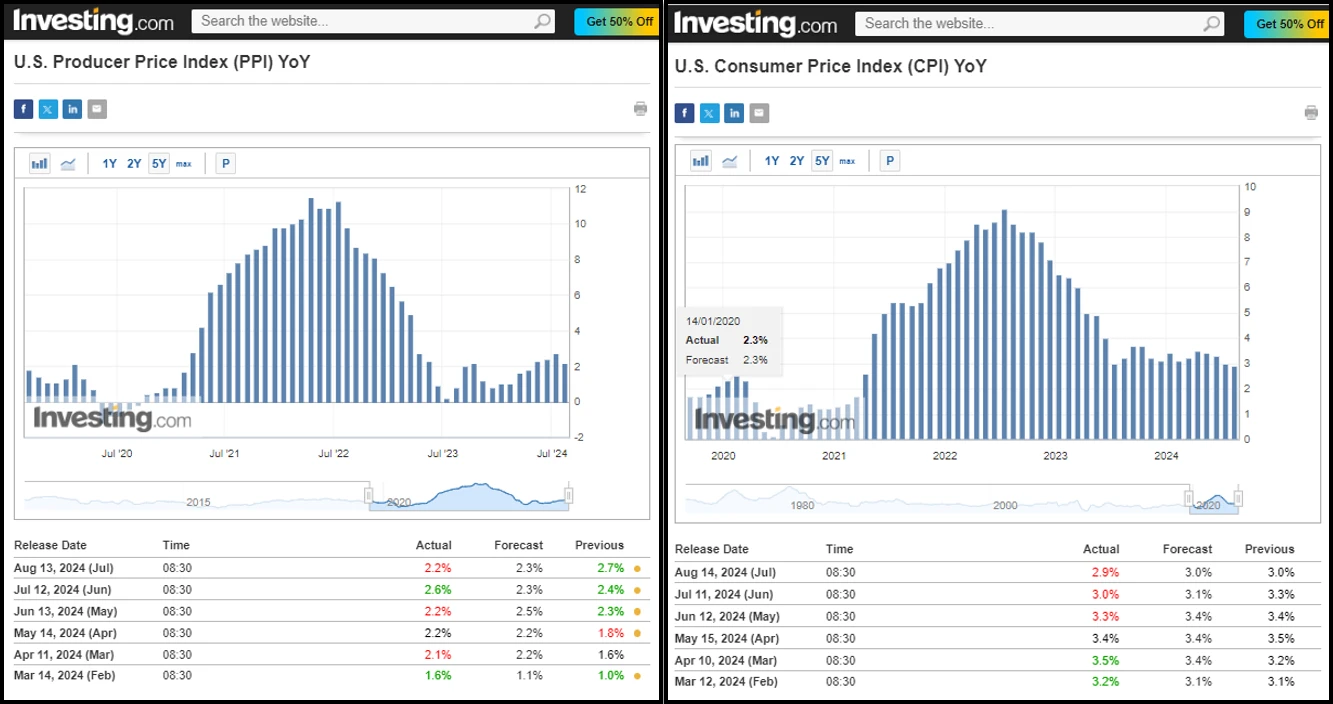
Fuente de imagen: https://hk.investing.com/
This week, two important inflation data, PPI and CPI, were released. CNBC said the data showed that the United States has passed the environment of ultra-high inflation. Moderate inflation data may mean that the Federal Reserve can turn its attention to other economic challenges, such as employment rate.
Data: PPI data, an indicator of producer inflation, showed that prices rose by only 0.2% in July and were up about 2.2% year-on-year. This figure is now very close to the Feds 2% target, indicating that market expectations for the central bank to start cutting interest rates are basically on target.
CPI data, an indicator of consumer inflation, showed a year-on-year growth rate of 2.9% over the past 12 months, a figure that, while much lower than the high point in mid-2022, is still far from the Feds 2% target.
In terms of market conditions: After the release of the PPI data at 20:30 on the evening of the 13th, Hong Kong time, the market began to rise, and Bitcoin rose from 59,000 to around 61,500. It was not until the release of the CPI data at 20:30 on the 14th that the market began to fall, and Bitcoin fell from 61,500 to around 58,000.
Future events: The latest employment rate data will be released on September 6, the latest CPI and PPI data will be released on September 11 and 12, and the Federal Reserve will hold its interest rate decision at 02:00 Hong Kong time on September 19. September will be a critical node. If the Federal Reserve decides to cut interest rates, the market may bring a new round of surprises.
There are about 33 days until the next Federal Reserve interest rate meeting (September 19, 2024)
https://hk.investing.com/economic-calendar/interest-rate-decision-168

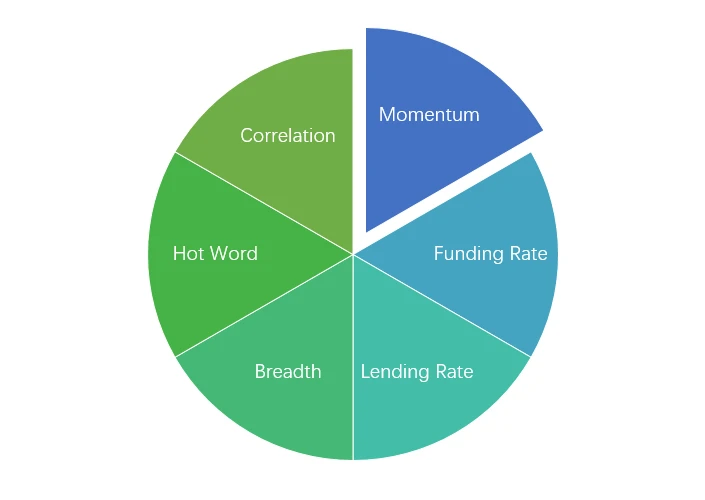
Componentes del análisis de sentimiento

BTC price fell -6.72% and ETH price fell -4.2% in the past week.

La imagen de arriba es el gráfico de precios de BTC la semana pasada.
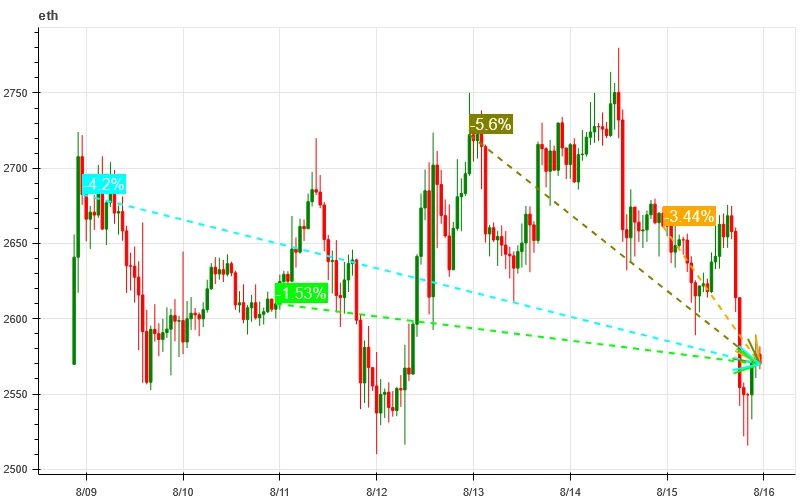
La imagen de arriba es el gráfico de precios de ETH la semana pasada.
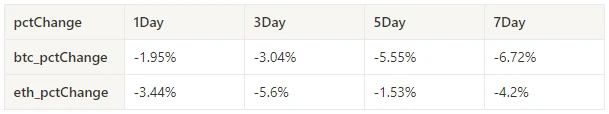
La tabla muestra la tasa de cambio de precios durante la última semana.
In the past week, both BTC and ETH have been fluctuating downward in a range of dense trading areas.

La imagen de arriba muestra la distribución de las densas áreas comerciales de BTC durante la semana pasada.

La imagen de arriba muestra la distribución de las densas áreas comerciales de ETH durante la semana pasada.
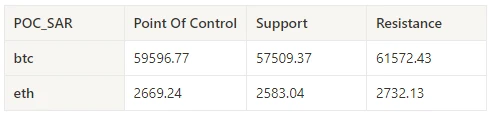
La tabla muestra el rango de negociación intensivo semanal de BTC y ETH durante la semana pasada.
In the past week, both BTC and ETH had the largest trading volume when they rebounded sharply on August 12; the open interest of BTC increased while that of ETH decreased.
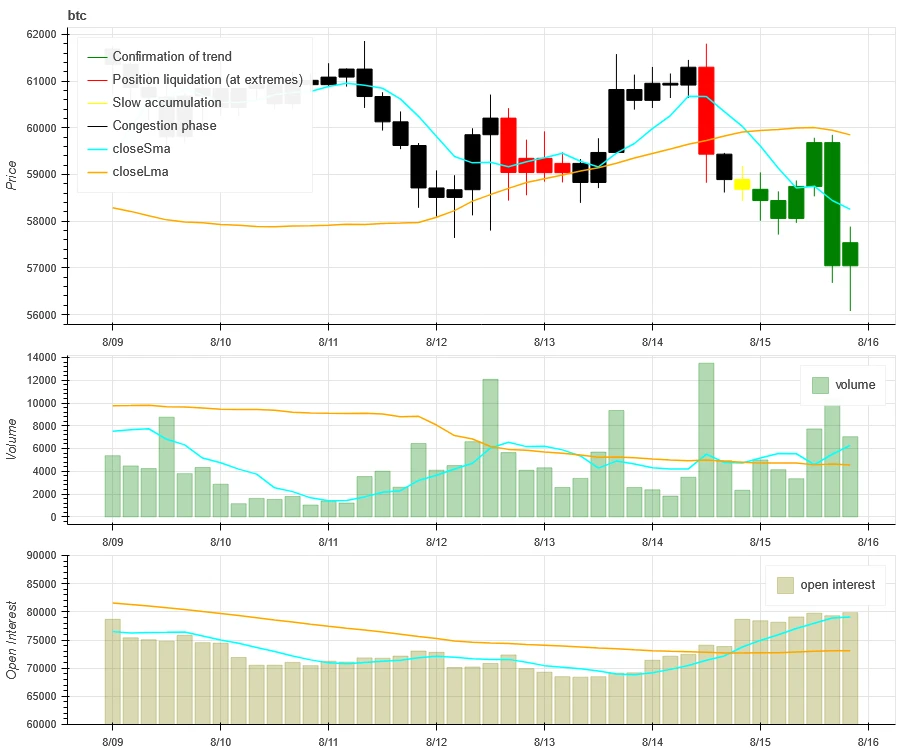
La parte superior de la imagen de arriba muestra la tendencia del precio de BTC, el medio muestra el volumen de operaciones, la parte inferior muestra el interés abierto, el azul claro es el promedio de 1 día y el naranja es el promedio de 7 días. El color de la línea K representa el estado actual, el verde significa que el aumento de precios está respaldado por el volumen de operaciones, el rojo significa cerrar posiciones, el amarillo significa acumular posiciones lentamente y el negro significa estado abarrotado.

La parte superior de la imagen de arriba muestra la tendencia del precio de ETH, el medio es el volumen de operaciones, la parte inferior es el interés abierto, el azul claro es el promedio de 1 día y el naranja es el promedio de 7 días. El color de la línea K representa el estado actual, el verde significa que el aumento de precios está respaldado por el volumen de operaciones, el rojo significa que se cierran posiciones, el amarillo se acumula lentamente y el negro está abarrotado.
In the past week, the historical volatility of BTC and ETH was the highest when they rebounded sharply on August 12; the implied volatility of BTC and ETH both decreased.
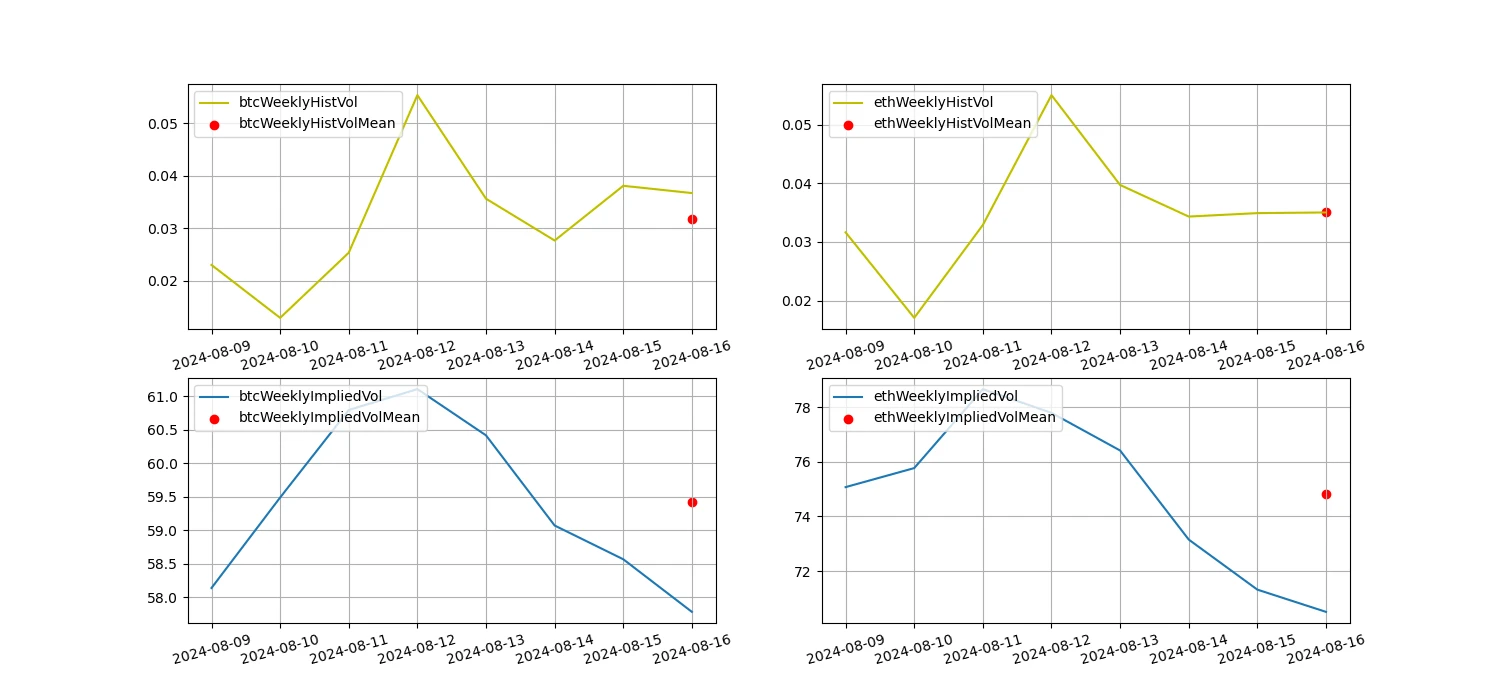
La línea amarilla es la volatilidad histórica, la línea azul es la volatilidad implícita y el punto rojo es su promedio de 7 días.

The PPI and CPI inflation data were released this past week. After the PPI data was released at 20:30 on the evening of the 13th Hong Kong time, the market began to rise, and Bitcoin rose from 59,000 to around 61,500. It was not until 20:30 on the 14th when the CPI data was released that the market began to fall, and Bitcoin fell from 61,500 to around 58,000.
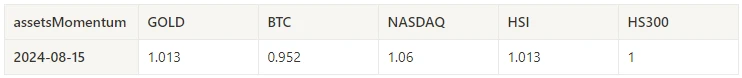
La semana pasada, entre Bitcoin/Oro/Nasdaq/Hang Seng Index/SSE 300, Nasdaq fue el más fuerte, mientras que Bitcoin tuvo el peor desempeño.
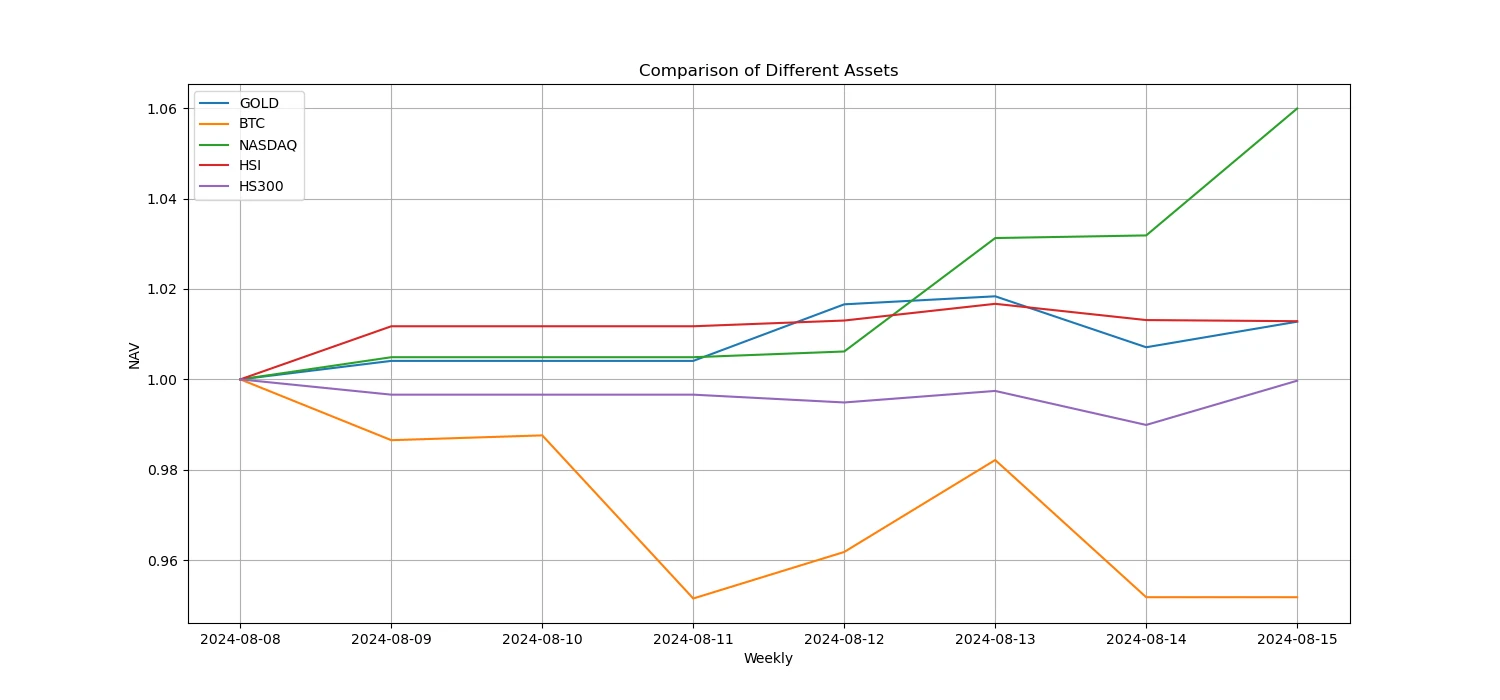
La imagen de arriba muestra la tendencia de diferentes activos durante la semana pasada.
The average annualized return on USD lending over the past week was 8.1%, and short-term interest rates remained at 6.7%.
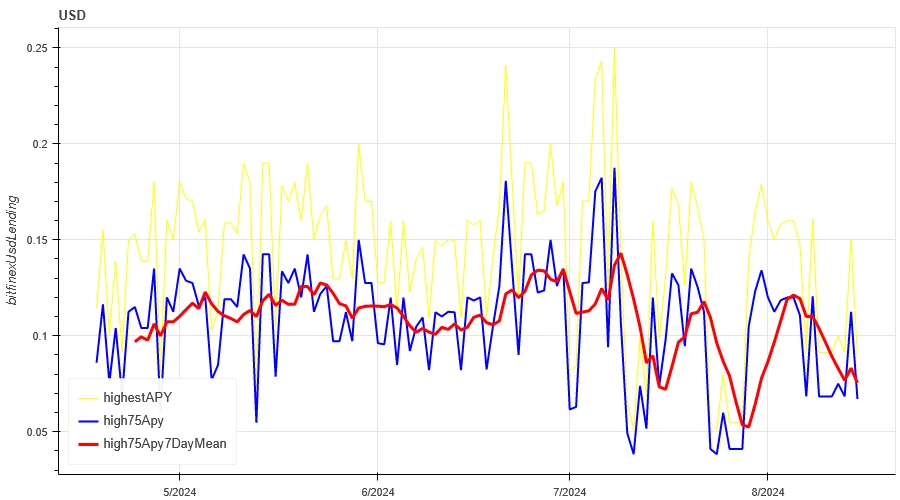
La línea amarilla es el precio más alto de la tasa de interés en USD, la línea azul es 75% del precio más alto y la línea roja es el promedio de 7 días de 75% del precio más alto.
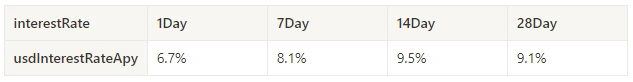
La tabla muestra los rendimientos promedio de las tasas de interés en USD en diferentes días de tenencia en el pasado.
The average annualized return on BTC fees in the past week was 0.2%, and contract leverage sentiment continued to decline.
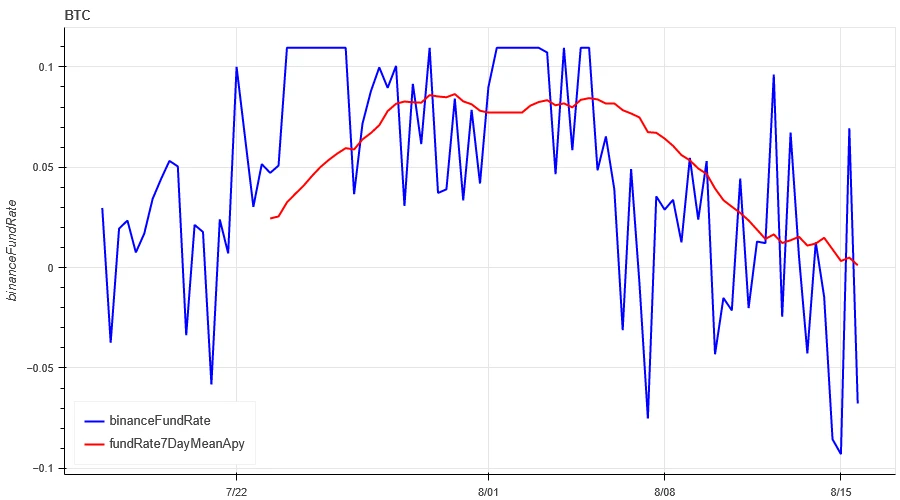
La línea azul es la tasa de financiación de BTC en Binance y la línea roja es su promedio de 7 días.

La tabla muestra el rendimiento promedio de las tarifas de BTC para diferentes días de tenencia en el pasado.
The correlation among the 129 coins selected in the past week was around 0.45, and the consistency between different varieties has dropped from a high level.
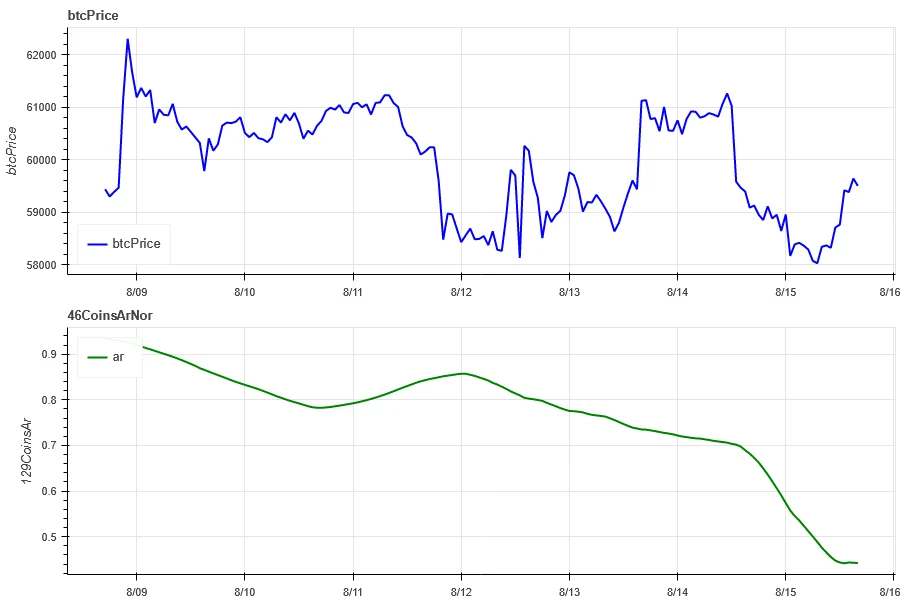
En la imagen de arriba, la línea azul es el precio de Bitcoin, y la línea verde es [1000 floki, 1000 lunc, 1000 pepe, 1000 shib, 100 0x ec, 1inch, aave, ada, agix, algo, ankr, ant, ape, apt, arb, ar, astr, atom, audio, avax, axs, bal, band, bat, bch, bigtime, blur, bnb, btc, celo, cfx, chz, ckb, comp, crv, cvx, cyber, dash, doge, dot, dydx, egld, enj, ens, eos,etc, eth, fet, fil, flow, ftm, fxs, gala, gmt, gmx, grt, hbar, hot, icp, icx, imx, inj, iost, iotx, jazmín, kava, klay, ksm, ldo, enlazar, telar, lpt, lqty, lrc, ltc, luna 2, magia, mana, matic, meme, mina, mkr, cerca, neo, océano, uno, ont, op, pendle, qnt, qtum, rndr, rosa, runa, rvn, arena, sei, sfp, skl, snx , sol, ssv, stg, storj, stx, sui, sushi, sxp, theta, tia, trx, t, uma, uni, vet, olas, wld, woo, xem, xlm, xmr, xrp, xtz, yfi, zec, zen, zil, zrx] correlación general
Among the 129 coins selected in the past week, 4% of them were priced above the 30-day moving average, 24% of them were priced above the 30-day moving average relative to BTC, 6% of them were more than 20% away from the lowest price in the past 30 days, and 7% of them were less than 10% away from the highest price in the past 30 days. The market breadth indicator in the past week showed that most coins in the overall market maintained a downward trend.

La imagen de arriba es [bnb, btc, sol, eth, 1000 floki, 1000 lunc, 1000 pepe, 1000 sats, 1000 shib, 100 0x ec, 1inch, aave, ada, agix, ai, algo, alt, ankr, ape, apto, arb, ar, astr, átomo, avax, hachas, bal, banda, murciélago, bch, bigtime, difuminar, pastel, celo, cfx, chz, ckb, comp, crv, cvx, cyber, guión, dux, punto, dydx, egld, enj, ens, eos, etc. fet, fil, flow, ftm, fxs, gala, gmt, gmx, grt, hbar, hot, icp, icx, idu, imx, inj, iost, iotx, jazmín, jto, saltar, kava, klay, ksm, ldo, enlazar, telar, lpt, lqty, lrc, ltc, luna 2, magia, mana, manta, máscara, matic, meme, mina, mkr, cerca , neo, nfp, océano, uno, ont, op, ordi, pendle, pyth, qnt, qtum, rndr, robin, rosa, runa, rvn, arena, sei, sfp, skl, snx, ssv, stg, storj, stx, sui, sushi, sxp, theta, tia, trx, t, uma, uni, veterinario, olas, wif, wld, woo,xai, xem, xlm, xmr, xrp, xtz, yfi, zec, zen, zil, zrx] Proporción de 30 días de cada indicador de ancho

In the past week, the prices of Bitcoin (BTC) and Ethereum (ETH) showed a volatile downward trend, especially when the historical volatility and trading volume reached a peak during the sharp drop and rebound on August 12. The open interest of BTC increased, while that of ETH decreased. The implied volatility decreased. Bitcoin performed the worst in comparison with gold, Nasdaq, Hang Seng Index and CSI 300, while Nasdaq performed the strongest. Bitcoins funding rate continued to decline, reflecting the continued decline in market participants interest in its leveraged trading. The correlation between the selected 129 currencies remained at around 0.45, showing that the consistency between different varieties has declined from a high level. The market breadth indicator shows that most cryptocurrencies in the overall market are still in a downward trend. The market began to rise after the PPI data was released on the 13th, and then the market began to fall after the CPI data was released on the 14th.
Gorjeo: @ https://x.com/CTA_ChannelCmt
Sitio web: canalcmt.com
This article is sourced from the internet: Crypto Market Sentiment Research Report (2024.08.09-08.16): Mild Inflation Data Price Range Fluctuation
Related: When live streaming happens in Web3: Will Pump.fun create a “live streaming magic”?
Pump.fun is the most special product in this cycle. Since its launch more than 4 months ago, more than 1.17 million tokens have been issued on Pump.fun, and the cumulative revenue has exceeded 50 million US dollars. How to understand this number? Compared with Uniswap, the top traffic product in the previous bull market, it is estimated that Uniswap Labs annual revenue is about 25 million to 30 million US dollars. It can be said that Pump.fun is not a typical Web3 project. It does not have a complex token economics model or a DAO governance mechanism. However, with its precise market positioning, Pump.fun has created a business market that is sure to make money. Under the dominance of the attention economy, many people will interpret the continued prosperity of…


