11 gráficos para interpretar el mercado de criptomonedas de julio: el esperado repunte finalmente está aquí
Autor original: Lars, head of research at The Block
Original translation: Jordan, PANews
In July, with the approval and successful listing of the US spot Ethereum ETF, most indicators in the cryptocurrency market finally saw a long-awaited rebound. This article will use 11 charts to interpret the status of the crypto market in the past month.
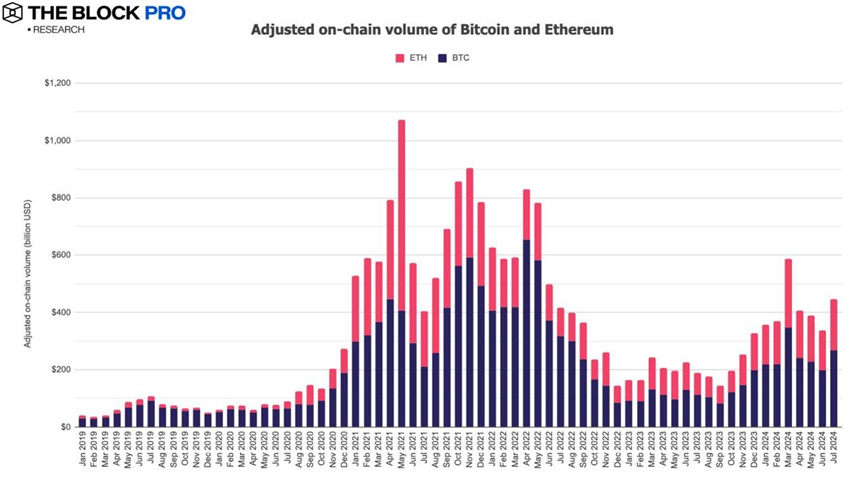
1. In July, the total transaction volume of Bitcoin and Ethereum after adjustment increased by 31.8% to US$445 billion, of which Bitcoin’s adjusted transaction volume increased by 34.7% and Ethereum’s increased by 27.7%.
2. The adjusted on-chain transaction volume of stablecoins in July increased by 18.8% to US$997.4 billion, and the supply of stablecoins issued increased by 1.2% to US$144.3 billion, of which USDT and USDC had market shares of 78.9% and 17.1%, respectively.
3. Bitcoin miners’ revenue reached $950.2 million in July, a slight decrease of 1.2%. In addition, Ethereum staking revenue also fell by 6.6% to $270.2 million.
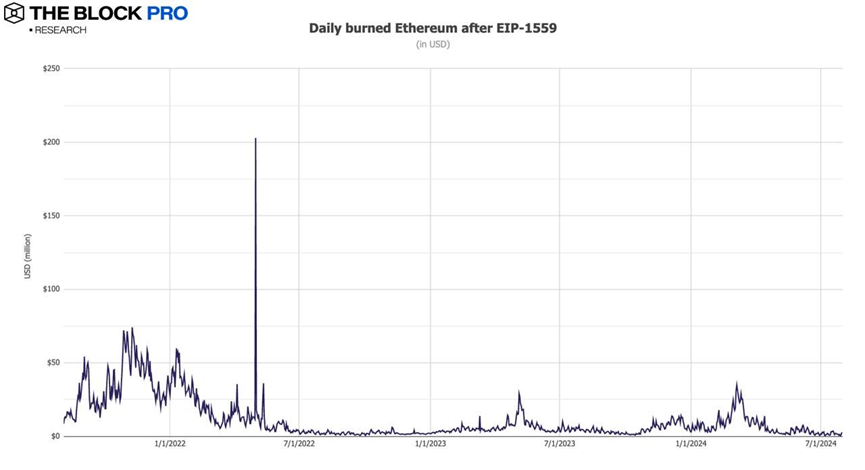
4. In July, the Ethereum network destroyed a total of 17,114 ETH, equivalent to $56.4 million. Data shows that since the implementation of EIP-1559 in early August 2021, Ethereum has destroyed a total of about 4.35 million ETH, worth about $12.3 billion.
5. In July, the transaction volume of the NFT market on the Ethereum chain continued to decline significantly, falling by 49.6%, further falling to approximately US$140.3 million.
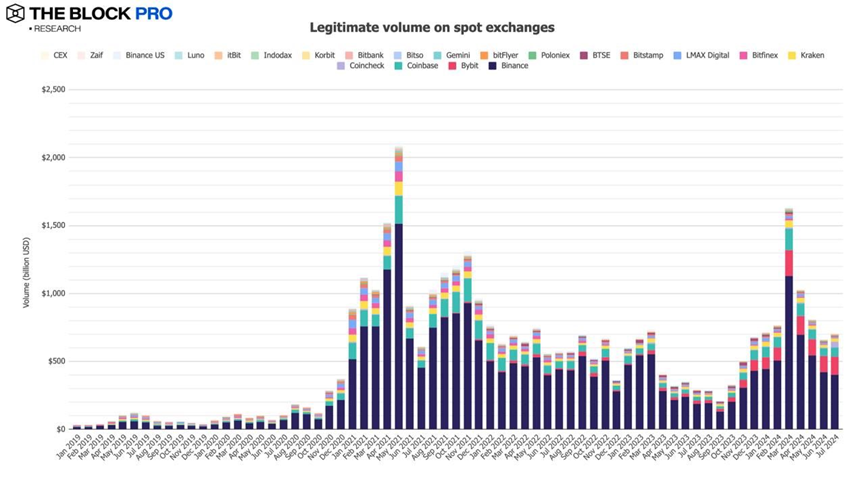
6. The spot trading volume of compliant centralized exchanges (CEX) rebounded in July, increasing by 6.7% to US$702.7 billion.
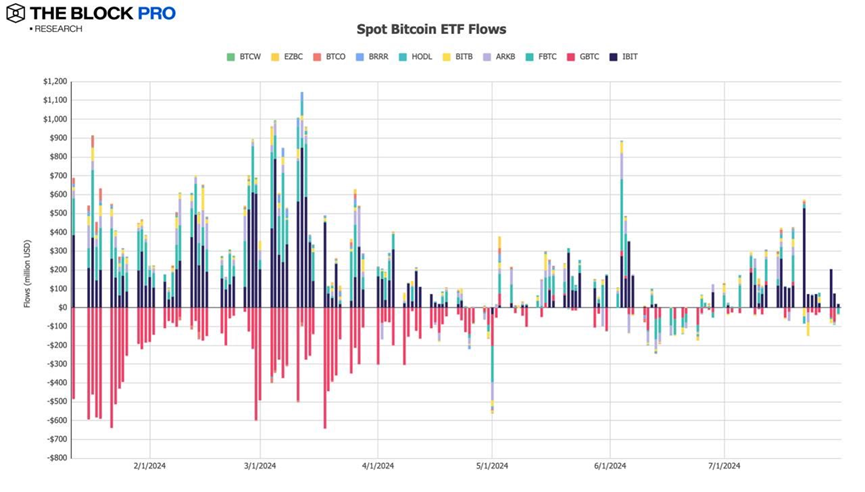
7. Net inflows into spot Bitcoin ETFs increased 473% in July to $3.15 billion;
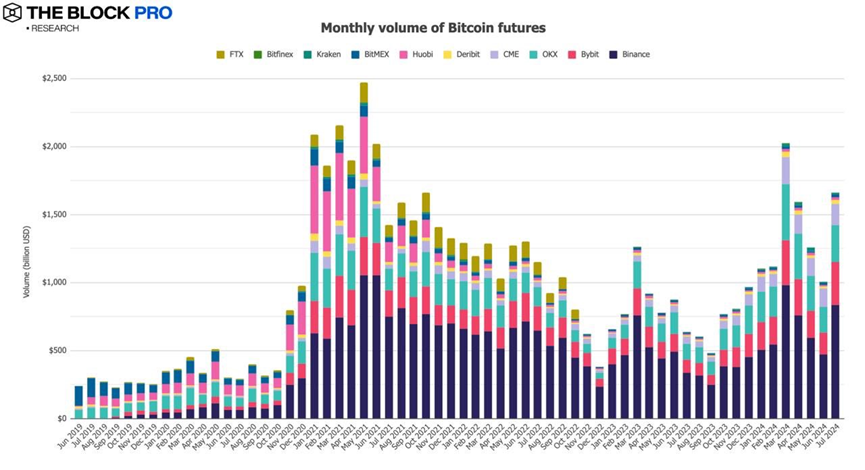
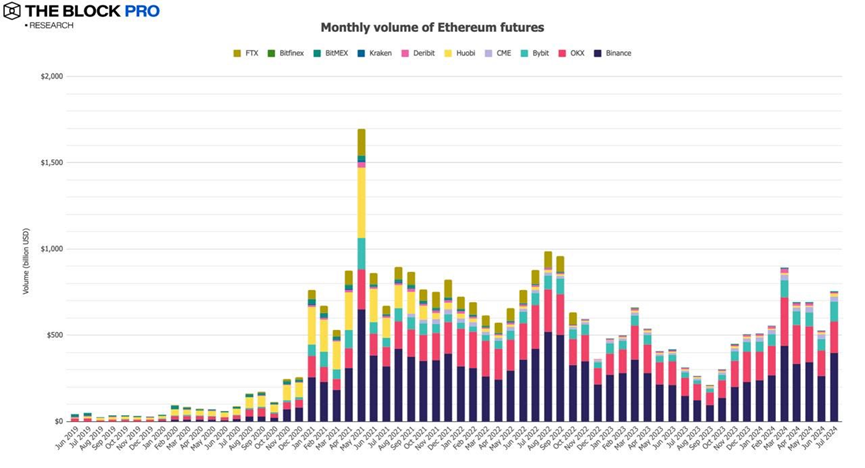
8. In terms of crypto futures, the open interest of Bitcoin futures increased by 15.6% in July; the open interest of Ethereum futures fell by 5.6%; in terms of futures trading volume, Bitcoin futures trading volume increased by 65% in July, falling to US$1.66 trillion, and Ethereum futures trading volume increased by 43.1%.
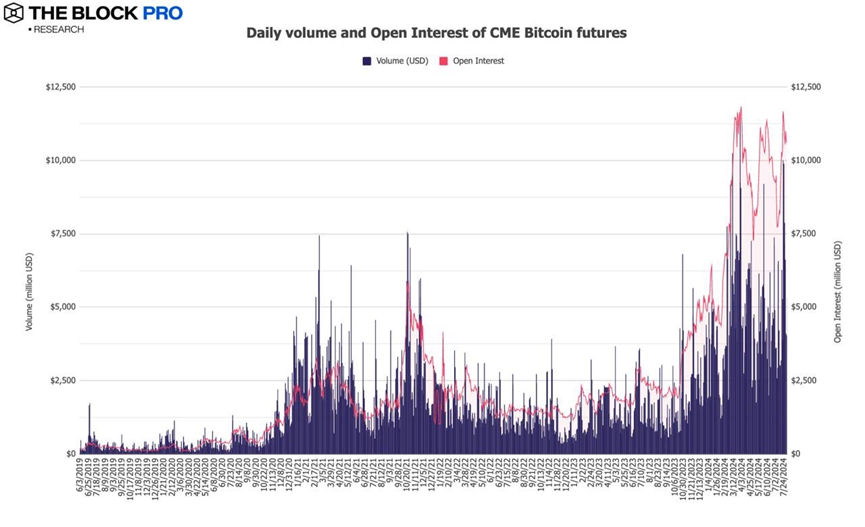
9. In July, the open interest of CME Bitcoin futures increased by 13.5%, rebounding to $10.6 billion, and the daily avg volume increased by 12.3% to approximately $5.05 billion.
10. In July, the average monthly trading volume of Ethereum futures increased significantly to US$755.5 billion, an increase of 43.1%.
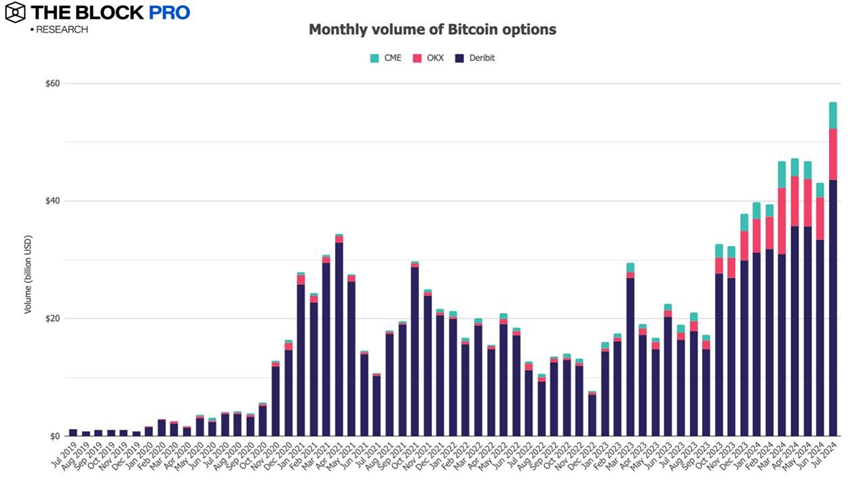
11. In terms of cryptocurrency options, the open interest of Bitcoin options increased by 35.9% in July, and the open interest of Ethereum options also increased by 7.1%. In addition, in terms of Bitcoin and Ethereum options trading volume, the monthly Bitcoin options trading volume reached US$56.9 billion, an increase of 31.9%; the Ethereum options trading volume fell by 8.1% to US$15.5 billion.
This article is sourced from the internet: 11 charts to interpret the July crypto market: the long-awaited rebound is finally here
Relacionado: 10 finalistas del hackathon ETHGlobal de Bruselas
Original | Odaily Planet Daily (@OdailyChina) Autor: Azuma (@azuma_eth) El 14 de julio, uno de los eventos periféricos más populares de EthCC, el hackathon temático ETHGlobal Brussels, llegó oficialmente a su fin. Este hackathon finalmente seleccionó a 10 finalistas, que cubren múltiples campos como IA, DeFi, billeteras, seguridad, Blinks, etc. Estos proyectos compartirán el premio de $475,000 proporcionado por ETHGlobal y otros 44 proyectos, incluidos LayerZero, Uniswap, Filecoin, Polygon, Arbitrum, etc. A continuación, Odaily Planet Daily lo llevará a conocer estos 10 proyectos preseleccionados. Página de inicio del ganador de BananaBets: https://ethglobal.com/showcase/bananabets-w0jbp Palabras clave: DeFi, mercado de predicción BananaBets es un mercado de predicción de juegos en conjunto con ETHGlobal Brussels. Antes de que se anuncien los ganadores del Hackathon, todos los espectadores pueden ver los proyectos presentados por los equipos principales. BananaBets ofrece a los espectadores una plataforma de predicciones donde pueden…
