My XP
0
Acceso
June 28, 2024 Solana cryptocurrency price surged nearly 10% after multiple sources provided verified information about VanEck (VanEck Solana Trust) application for Solana-based spot ETF. VanEck is an asset management company with more than $89 billion in assets under management. This is the first such application filed with the U.S. Securities and Exchange Commission (SEC). Solana immediately rose after the news about the spot ETF application, but soon encountered some resistance and profit-taking. Bitcoin reacted to the news by jumping nearly $1,400 from $60,800 to $62,200, but the price is currently below $62,000 again.
There are about 31 days until the next Federal Reserve interest rate meeting (2024.08.01)
https://hk.investing.com/economic-calendar/interest-rate-decision-168


Componentes del análisis de sentimiento

BTC price fell -4.88% and ETH price fell -1.78% in the past week.
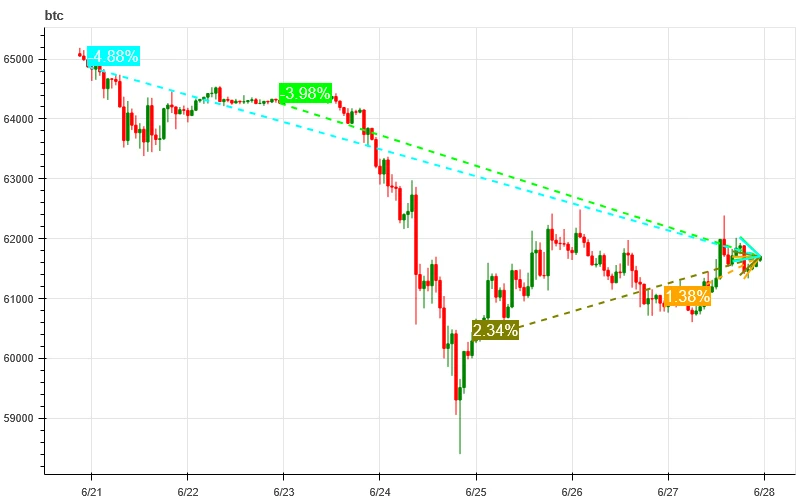
La imagen de arriba es el gráfico de precios de BTC la semana pasada.
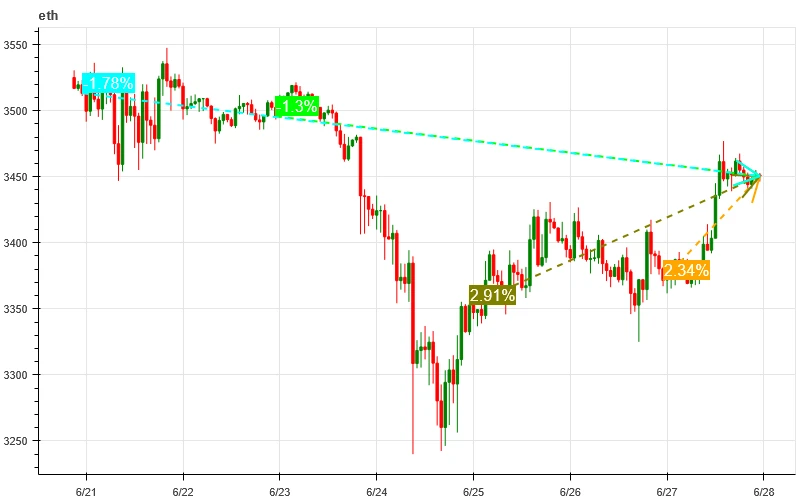
La imagen de arriba es el gráfico de precios de ETH la semana pasada.

La tabla muestra la tasa de cambio de precios durante la última semana.
In the past week, BTC and ETH fell to 6.24 and formed a dense trading area at a low level before fluctuating widely.

La imagen de arriba muestra la distribución de las densas áreas comerciales de BTC durante la semana pasada.

La imagen de arriba muestra la distribución de las densas áreas comerciales de ETH durante la semana pasada.
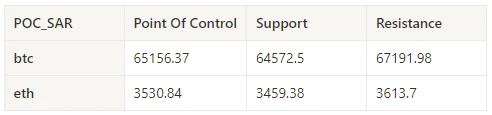
La tabla muestra el rango de negociación intensivo semanal de BTC y ETH durante la semana pasada.
BTC and ETH had the largest trading volume this past week when they fell on June 24; open interest for both BTC and ETH rose slightly.
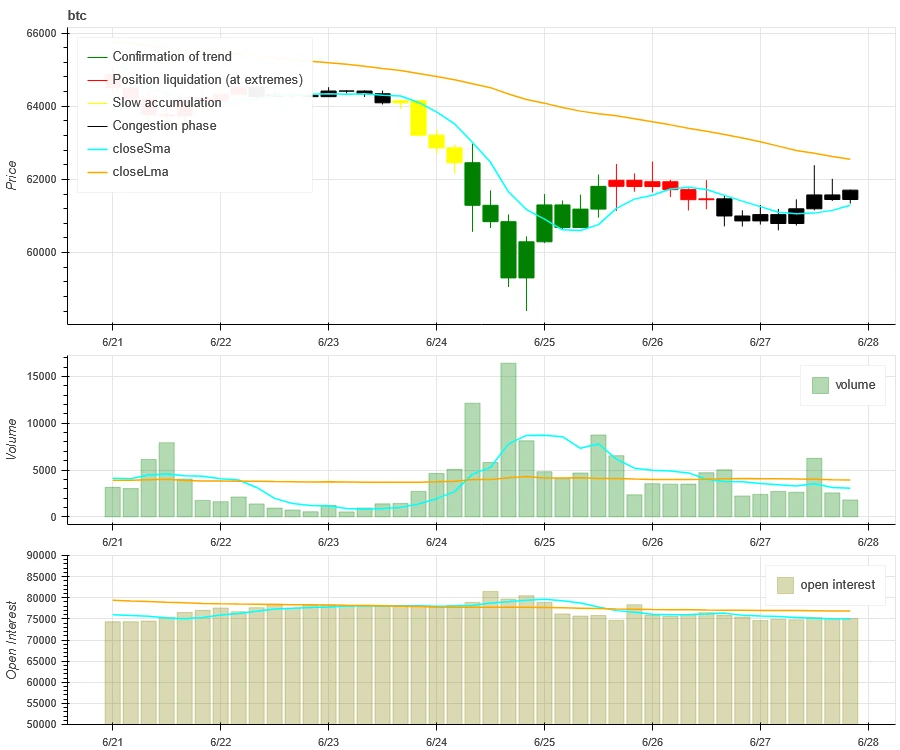
La parte superior de la imagen de arriba muestra la tendencia del precio de BTC, el medio muestra el volumen de operaciones, la parte inferior muestra el interés abierto, el azul claro es el promedio de 1 día y el naranja es el promedio de 7 días. El color de la línea K representa el estado actual, el verde significa que el aumento de precios está respaldado por el volumen de operaciones, el rojo significa cerrar posiciones, el amarillo significa acumular posiciones lentamente y el negro significa estado abarrotado.
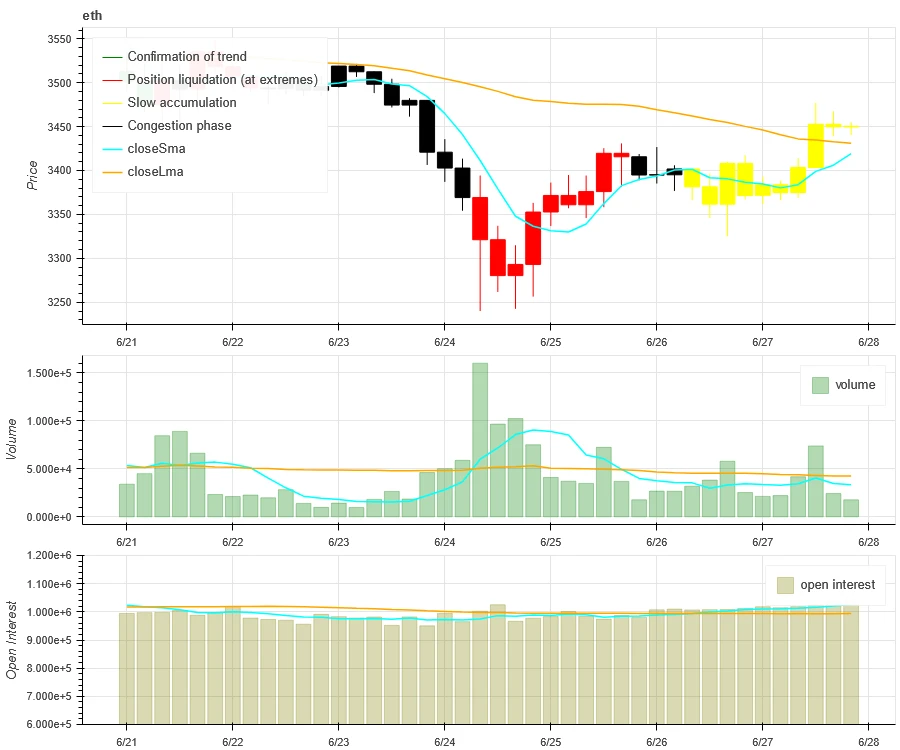
La parte superior de la imagen de arriba muestra la tendencia del precio de ETH, el medio es el volumen de operaciones, la parte inferior es el interés abierto, el azul claro es el promedio de 1 día y el naranja es el promedio de 7 días. El color de la línea K representa el estado actual, el verde significa que el aumento de precios está respaldado por el volumen de operaciones, el rojo significa que se cierran posiciones, el amarillo se acumula lentamente y el negro está abarrotado.
In the past week, historical volatility of BTC and ETH was highest at 6.24; implied volatility of BTC rose slightly while ETH fell slightly.

The yellow line is the historical volatility, the blue line is the implied volatility, and the red dot is its 7-day average.

No data was released in the past week.
La semana pasada, entre Bitcoin/Oro/Nasdaq/Hang Seng Index/SSE 300, Nasdaq fue el más fuerte, mientras que Bitcoin tuvo el peor desempeño.

La imagen de arriba muestra la tendencia de diferentes activos durante la semana pasada.

Over the past week, the average annualized return on USD lending was 13.3%, and short-term interest rates remained around 12.4%.

La línea amarilla es el precio más alto de la tasa de interés en USD, la línea azul es 75% del precio más alto y la línea roja es el promedio de 7 días de 75% del precio más alto.

La tabla muestra los rendimientos promedio de las tasas de interés en USD para diferentes días de tenencia en el pasado.
The average annualized return on BTC fees in the past week was 8.8%, and contract leverage sentiment remained at a low level.
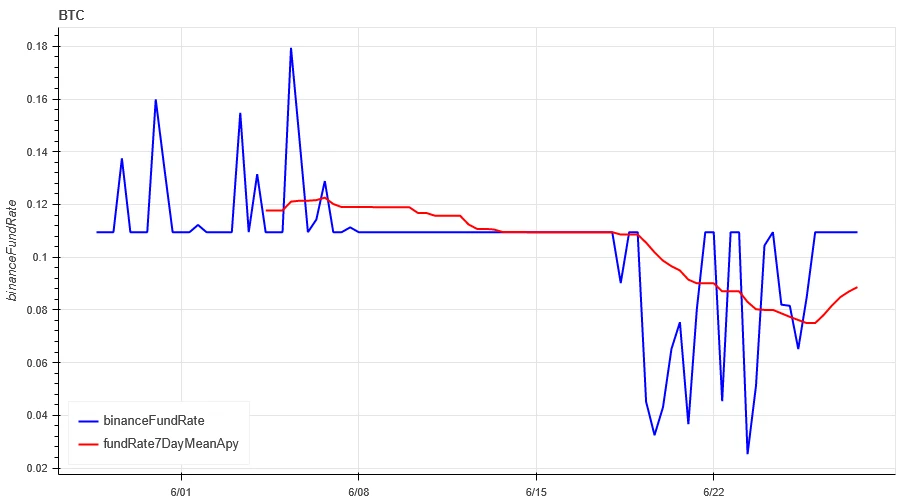
La línea azul es la tasa de financiación de BTC en Binance y la línea roja es su promedio de 7 días.

La tabla muestra el rendimiento promedio de las tarifas de BTC para diferentes días de tenencia en el pasado.
The correlation among the 129 coins selected in the past week dropped to around 0.45, and the consistency between different varieties dropped significantly.

In the above picture, the blue line is the price of Bitcoin, and the green line is [1000 floki, 1000 lunc, 1000 pepe, 1000 shib, 100 0x ec, 1inch, aave, ada, agix, algo, ankr, ant, ape, apt, arb, ar, astr, atom, audio, avax, axs, bal, band, bat, bch, bigtime, blur, bnb, btc, celo, cfx, chz, ckb, comp, crv, cvx, cyber, dash, doge, dot, dydx, egld, enj, ens, eos,etc, eth, fet, fil, flow, ftm, fxs, gala, gmt, gmx, grt, hbar, hot, icp, icx, imx, inj, iost, iotx, jasmy, kava, klay, ksm, ldo, link, loom, lpt, lqty, lrc, ltc, luna 2, magic, mana, matic, meme, mina, mkr, near, neo, ocean, one, ont, op, pendle, qnt, qtum, rndr, rose, rune, rvn, sand, sei, sfp, skl, snx, sol, ssv, stg, storj, stx, sui, sushi, sxp, theta, tia, trx, t, uma, uni, vet, waves, wld, woo, xem, xlm, xmr, xrp, xtz, yfi, zec, zen, zil, zrx] overall correlation
Among the 129 coins selected in the past week, 5.5% of the coins were priced above the 30-day moving average, 25% of the coins were priced above the 30-day moving average relative to BTC, 4% of the coins were more than 20% away from the lowest price in the past 30 days, and 6.3% of the coins were less than 10% away from the highest price in the past 30 days. The market breadth indicator in the past week showed that most coins in the overall market continued to fall.

La imagen de arriba muestra [bnb, btc, sol, eth, 1000 floki, 1000 lunc, 1000 pepe, 1000 sats, 1000 shib, 100 0x ec, 1inch, aave, ada, agix, ai, algo, alt, ankr, ape, apt, arb, ar, astr, atom, avax, axs, bal, band, bat, bch, bigtime, blur, cake, celo, cfx, chz, ckb, comp, crv, cvx, cyber, dash, doge, dot, dydx, egld, enj, ens, eos,etc, fet, fil, flow, ftm, fxs, gala, gmt, gmx, grt, hbar, hot, icp, icx, idu, imx, inj, iost, iotx, jazmín, jto, saltar, kava, klay, ksm, ldo, enlazar, telar, lpt, lqty, lrc, ltc, luna 2, magia, mana, manta, máscara, matic, meme, mina, mkr, cerca, neo, nfp, oceano, uno, ont, op, ordi, pendle, pyth, qnt, qtum, rndr, robin, rosa, rvn, arena, sei, sfp, skl, snx, ssv, stg, storj, stx, sui, sushi, sxp, theta, tia, trx, t, uma, uni, veterinario, olas, wif, wld, woo,xai, xem, xlm, xmr, xrp, xtz, yfi, zec, zen, zil, zrx] Proporción de 30 días de cada indicador de ancho

Over the past week, Bitcoin (BTC) and Ethereum (ETH) prices have experienced wide range fluctuations after the decline, while the volatility and trading volume of these two cryptocurrencies reached the highest level during the decline on June 24. The open interest of Bitcoin and Ethereum has increased slightly. In addition, the implied volatility of Bitcoin has increased slightly, while the implied volatility of Ethereum has decreased slightly. The funding rate of Bitcoin has remained at a low level, which may reflect the continued low leverage sentiment of market participants towards Bitcoin. The market breadth indicator shows that most cryptocurrencies continue to fall, indicating that the overall market has maintained a weak trend over the past week.
Gorjeo: @ https://x.com/CTA_ChannelCmt
Sitio web: canalcmt.com
This article is sourced from the internet: Crypto Market Sentiment Research Report (2024.06.21-06.28): SOL rose 7%, VanEck submitted Solana Trust Fund application
Hong Kong Virtual Asset Spot ETF On April 30, a total of 6 virtual asset spot ETFs under Bosera HashKey, China Asset Management and Harvest Asset Management officially rang the bell and were listed on the Hong Kong Stock Exchange and opened for trading, including Bosera HashKey Bitcoin ETF (3008.HK), Bosera HashKey Ethereum ETF (3009.HK), China Asset Management Bitcoin ETF (3042.HK), China Asset Management Ethereum ETF (3046.HK), Harvest Bitcoin Spot ETF (3439.HK) and Harvest Ethereum Spot ETF (3179.HK). Li Yimei, CEO of China Asset Management, said in an interview with Bloomberg TV that the launch of Hong Kong spot Bitcoin and Ethereum ETFs opens the door for many RMB holders to seek alternative investments. As the opening-up develops, hopefully there will be new opportunities for mainland Chinese investors to participate…


