Informe de investigación sobre el sentimiento del mercado de criptomonedas (del 14 al 21 de junio de 2024): los ETF de Bitcoin se han vendido continuamente en los últimos años
Bitcoin ETFs have been sold off continuously over the past 5 days
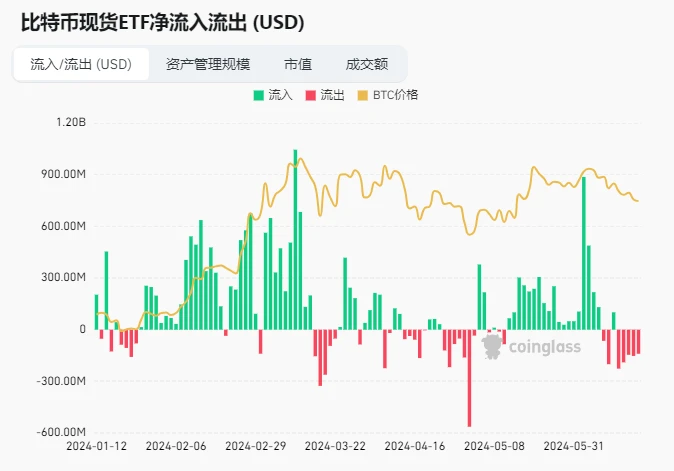
Fuente de datos: https://www.coinglass.com/en/bitcoin-etf
The latest data shows that the US spot Bitcoin ETF set off a selling storm on June 17! A total of 3,169 Bitcoins were sold, worth more than $200 million!
Among them, the well-known institution Fidelity reduced its holdings of 1,224 bitcoins, worth up to $80.34 million, and currently still holds a large amount of bitcoins. Another giant, Grayscale, also reduced its holdings of 936 bitcoins, worth more than $61.4 million. The reduction of holdings by these two giants has undoubtedly brought a lot of shock to the market.
This selling storm has created more uncertainty about the future trend of the Bitcoin market, and more risk management is needed.
There are about 38 days until the next Federal Reserve interest rate meeting (2024.08.01)
https://hk.investing.com/economic-calendar/interest-rate-decision-168
Análisis del entorno técnico y de sentimiento del mercado.

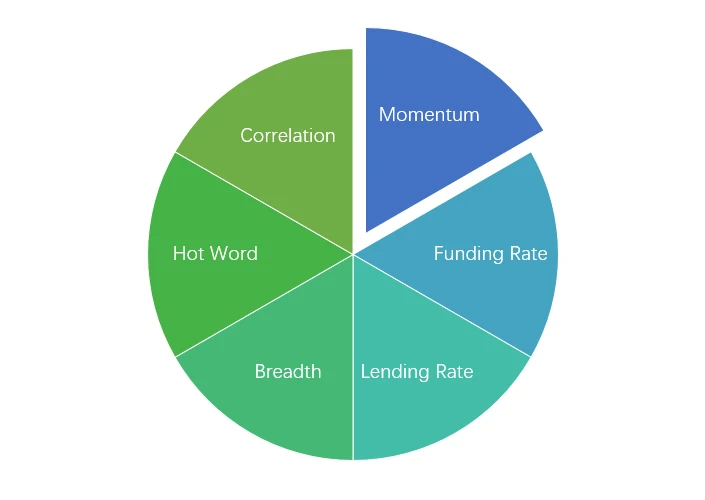
Componentes del análisis de sentimiento

Indicadores técnicos
Tendencia de precios
Over the past week, BTC prices fell -2.85% and ETH prices rose 1.26%.

La imagen de arriba es el gráfico de precios de BTC la semana pasada.
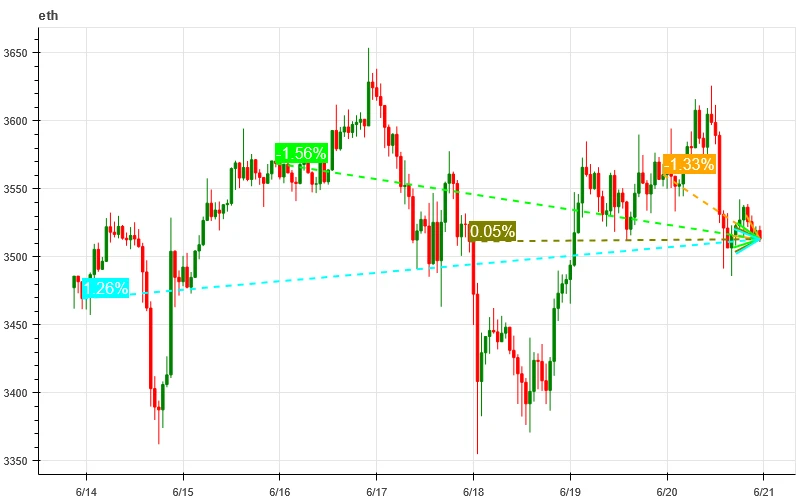
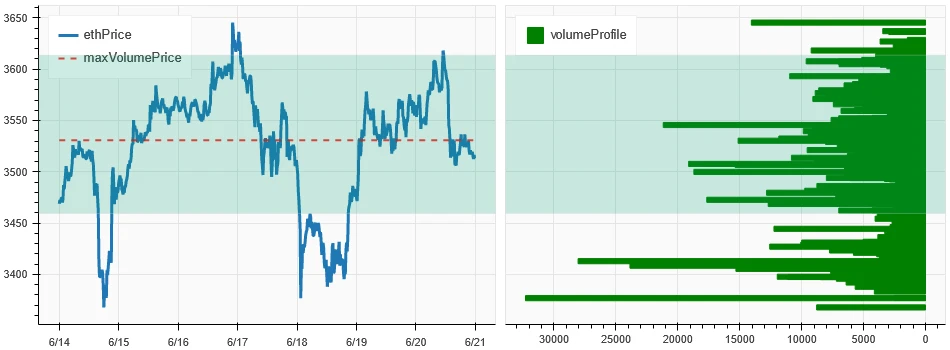
La imagen de arriba es el gráfico de precios de ETH la semana pasada.
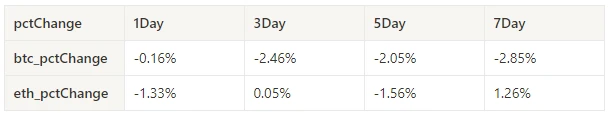
La tabla muestra la tasa de cambio de precios durante la última semana.
Gráfico de distribución de volumen de precios (soporte y resistencia)
In the past week, BTC and ETH have fluctuated widely in the area of intensive trading.
La imagen de arriba muestra la distribución de las densas áreas comerciales de BTC durante la semana pasada.

La imagen de arriba muestra la distribución de las densas áreas comerciales de ETH durante la semana pasada.

La tabla muestra el rango de negociación intensivo semanal de BTC y ETH durante la semana pasada.
Volumen e interés abierto
BTC and ETH saw the largest volume this past week, with the decline on June 18; open interest for BTC fell while ETH rose slightly.
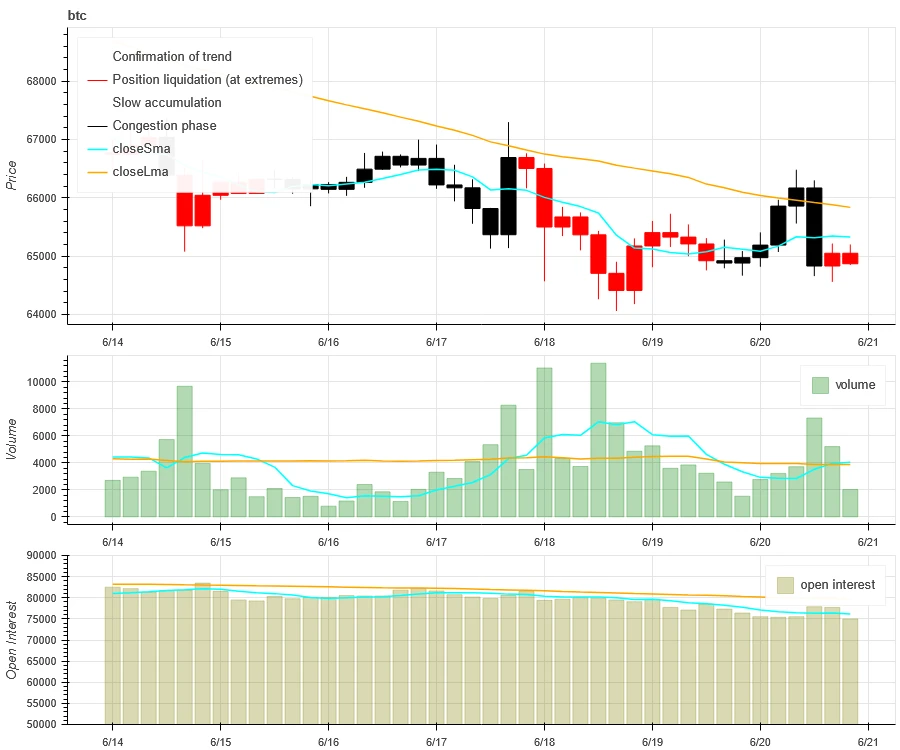
La parte superior de la imagen de arriba muestra la tendencia del precio de BTC, el medio muestra el volumen de operaciones, la parte inferior muestra el interés abierto, el azul claro es el promedio de 1 día y el naranja es el promedio de 7 días. El color de la línea K representa el estado actual, el verde significa que el aumento de precios está respaldado por el volumen de operaciones, el rojo significa cerrar posiciones, el amarillo significa acumular posiciones lentamente y el negro significa estado abarrotado.

La parte superior de la imagen de arriba muestra la tendencia del precio de ETH, el medio es el volumen de operaciones, la parte inferior es el interés abierto, el azul claro es el promedio de 1 día y el naranja es el promedio de 7 días. El color de la línea K representa el estado actual, el verde significa que el aumento de precios está respaldado por el volumen de operaciones, el rojo significa que se cierran posiciones, el amarillo se acumula lentamente y el negro está abarrotado.
Volatilidad histórica versus volatilidad implícita
In the past week, the historical volatility of BTC and ETH was the highest when it fell to 6.14; the implied volatility of BTC and ETH both increased compared to the beginning of the week.

La línea amarilla es la volatilidad histórica, la línea azul es la volatilidad implícita y el punto rojo es su promedio de 7 días.

Evento conducido
No data was released in the past week.
Indicadores de sentimiento
Sentimiento de impulso
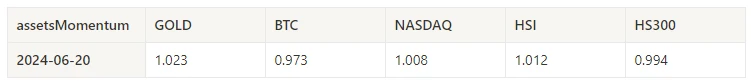
La semana pasada, entre Bitcoin/Oro/Nasdaq/Hang Seng Index/SSE 300, el oro fue el más fuerte, mientras que Bitcoin tuvo el peor desempeño.
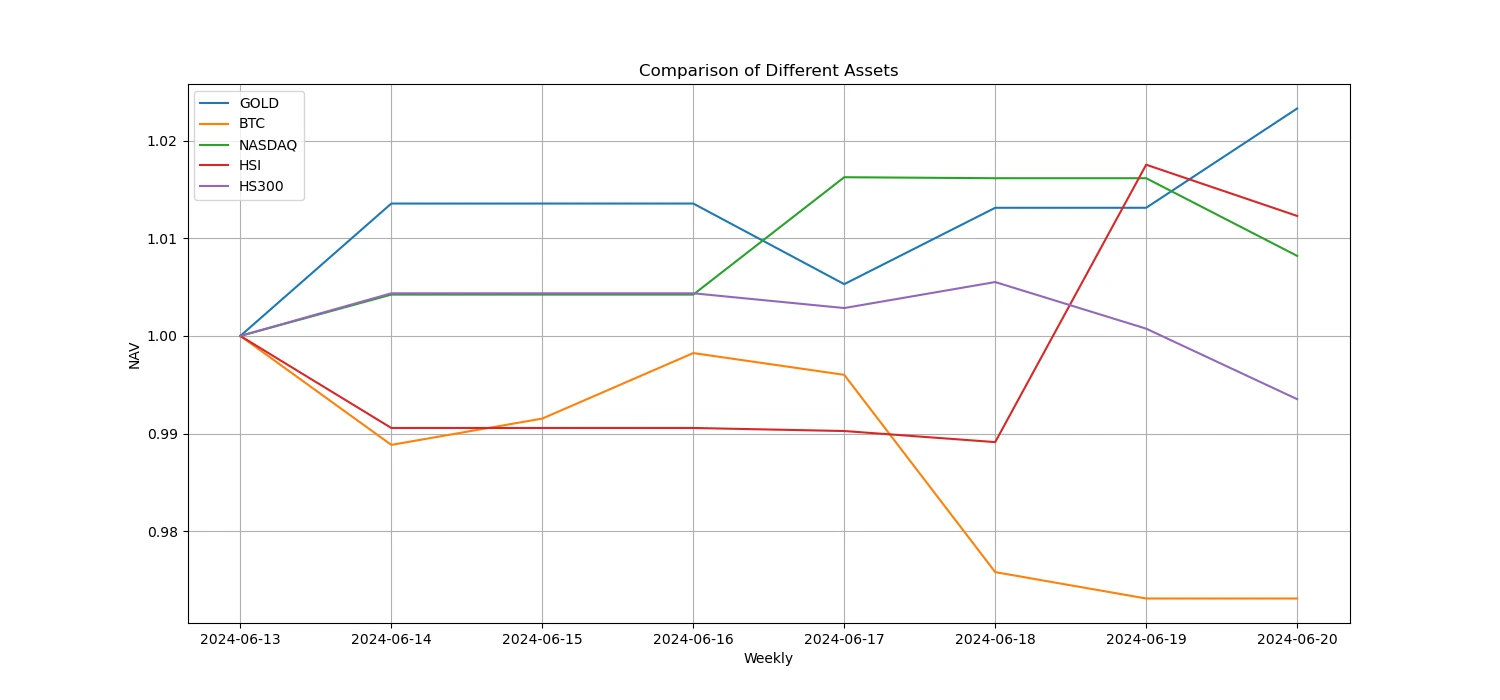
La imagen de arriba muestra la tendencia de diferentes activos durante la semana pasada.
Tasa de préstamo_Sentimiento de préstamo
The average annualized return on USD lending in the past week was 10.8%, and short-term interest rates rebounded to around 12.6%.
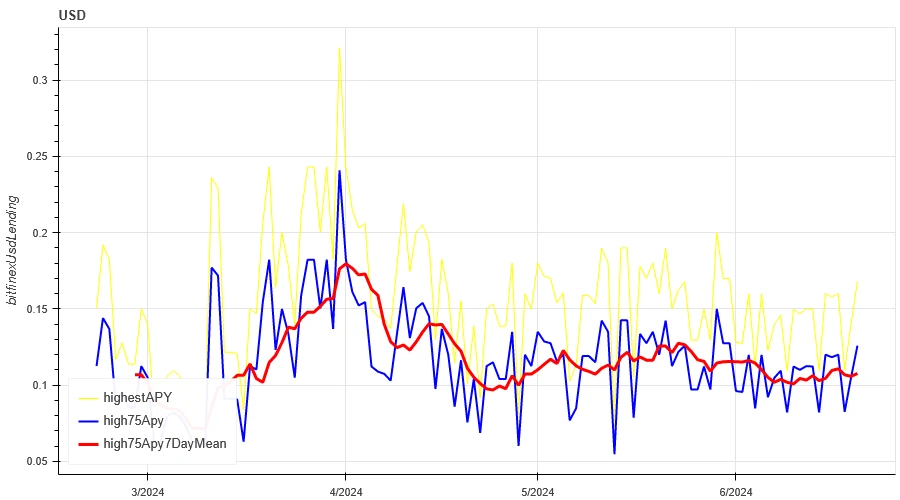
La línea amarilla es el precio más alto de la tasa de interés en USD, la línea azul es 75% del precio más alto y la línea roja es el promedio de 7 días de 75% del precio más alto.

La tabla muestra los rendimientos promedio de las tasas de interés en USD para diferentes días de tenencia en el pasado.
Tasa de financiación_Sentimiento de apalancamiento del contrato
The average annualized return on BTC fees in the past week was 9.6%, and contract leverage sentiment returned to a low level.

La línea azul es la tasa de financiación de BTC en Binance y la línea roja es su promedio de 7 días.
La tabla muestra el rendimiento promedio de las tarifas de BTC para diferentes días de tenencia en el pasado.
Correlación del mercado_Sentimiento de consenso
The correlation among the 129 coins selected in the past week remained at around 0.88, and the consistency between different varieties was at a high level.

In the above picture, the blue line is the price of Bitcoin, and the green line is [1000 floki, 1000 lunc, 1000 pepe, 1000 shib, 100 0x ec, 1inch, aave, ada, agix, algo, ankr, ant, ape, apt, arb, ar, astr, atom, audio, avax, axs, bal, band, bat, bch, bigtime, blur, bnb, btc, celo, cfx, chz, ckb, comp, crv, cvx, cyber, dash, doge, dot, dydx, egld, enj, ens, eos,etc, eth, fet, fil, flow, ftm, fxs, gala, gmt, gmx, grt, hbar, hot, icp, icx, imx, inj, iost, iotx, jasmy, kava, klay, ksm, ldo, link, loom, lpt, lqty, lrc, ltc, luna 2, magic, mana, matic, meme, mina, mkr, near, neo, ocean, one, ont, op, pendle, qnt, qtum, rndr, rose, rune, rvn, sand, sei, sfp, skl, snx, sol, ssv, stg, storj, stx, sui, sushi, sxp, theta, tia, trx, t, uma, uni, vet, waves, wld, woo, xem, xlm, xmr, xrp, xtz, yfi, zec, zen, zil, zrx] overall correlation
Amplitud del mercado_Sentimiento general
Among the 129 coins selected in the past week, 4% of them were priced above the 30-day moving average, 8.6% of them were above the 30-day moving average relative to BTC, 2.4% of them were more than 20% away from the lowest price in the past 30 days, and 4.7% of them were less than 10% away from the highest price in the past 30 days. The market breadth indicator in the past week showed that the overall market was in a continuous decline for most coins.

La imagen de arriba muestra [bnb, btc, sol, eth, 1000 floki, 1000 lunc, 1000 pepe, 1000 sats, 1000 shib, 100 0x ec, 1inch, aave, ada, agix, ai, algo, alt, ankr, ape, apt, arb, ar, astr, atom, avax, axs, bal, band, bat, bch, bigtime, blur, cake, celo, cfx, chz, ckb, comp, crv, cvx, cyber, dash, doge, dot, dydx, egld, enj, ens, eos,etc, fet, fil, flow, ftm, fxs, gala, gmt, gmx, grt, hbar, hot, icp, icx, idu, imx, inj, iost, iotx, jazmín, jto, saltar, kava, klay, ksm, ldo, enlazar, telar, lpt, lqty, lrc, ltc, luna 2, magia, mana, manta, máscara, matic, meme, mina, mkr, cerca, neo, nfp, oceano, uno, ont, op, ordi, pendle, pyth, qnt, qtum, rndr, robin, rosa, rvn, arena, sei, sfp, skl, snx, ssv, stg, storj, stx, sui, sushi, sxp, theta, tia, trx, t, uma, uni, veterinario, olas, wif, wld, woo,xai, xem, xlm, xmr, xrp, xtz, yfi, zec, zen, zil, zrx] Proporción de 30 días de cada indicador de ancho

Resumir
Over the past week, the prices of Bitcoin (BTC) and Ethereum (ETH) experienced wide range declines, reaching the peak of volatility on June 18. At the same time, the trading volume of these two cryptocurrencies also reached the highest level during the decline on June 18. Bitcoins open interest volume has declined, while Ethereums open interest volume has increased slightly. In addition, both implied volatilities have increased slightly. In addition, Bitcoins funding rate has fallen to a low level, which may reflect the decline in leverage sentiment of market participants towards Bitcoin. In addition, the market breadth indicator shows that most currencies continue to fall, which indicates that the entire market has generally shown a weak trend over the past week.
Gorjeo: @ https://x.com/CTA_ChannelCmt
Sitio web: canalcmt.com
This article is sourced from the internet: Crypto Market Sentiment Research Report (2024.06.14-2024.06.21): Bitcoin ETFs have been continuously sold off in the past 5 days
Originales | Odaily Planet Autor diario | Azuma A las 20:00 hora de Beijing del 30 de abril, Kamino, el protocolo DeFi líder en el ecosistema de Solana, abrirá oficialmente aplicaciones de token para el token de gobernanza KMNO. Anteriormente, el 5 de abril, Kamino agregó una página de creación de tokens a su sitio web oficial. Anteriormente, los usuarios podían consultar los recursos compartidos de lanzamiento aéreo de tokens KMNO específicos a través de esta página. El reclamo abierto de esta noche significa que los usuarios podrán reclamar las acciones de KMNO establecidas a través de esta interfaz e intercambiarlas en DEX o algún CEX que admita KMNO. Desglose del modelo de negocio de Kamino El modelo de negocio de Kamino no es complicado y su producto básico es un protocolo de préstamo con el que todos están familiarizados. Según los datos de DeFi Llama, Kamino es actualmente el tercer protocolo DeFi clasificado y el primer protocolo de préstamos...