My XP
0
Login
Originalautor: Crypto Stream
Original translation: Tim, PANews
Is now the best time to buy the dip in Bitcoin?
The market plunged 10% overnight, completely offsetting the rising effect of the US strategic Kryptocurrency reserve. Retail investors are panic selling and market sentiment has dropped to freezing point. But the actual situation may be better than it seems. Here are my market views:
Bitcoin is extremely sensitive to changes in the global money supply. As the most sensitive asset to liquidity changes (a term coined by global liquidity research firm CrossBorder Capital), experts estimate that its correlation with money supply is as high as 40%.
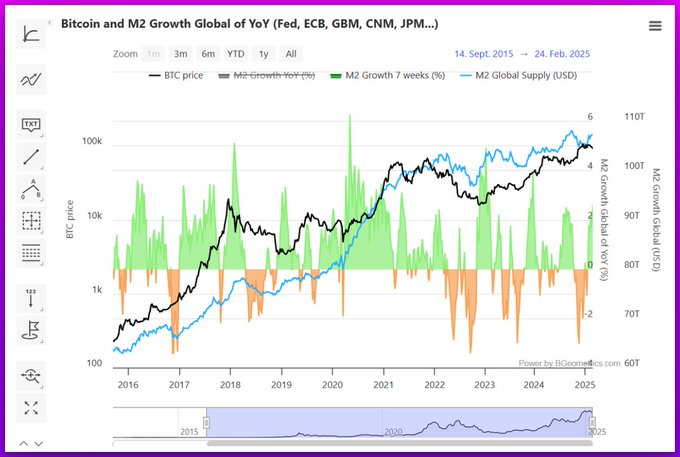
Analysis of the current trend of M2 money supply:
The M2 supply has bottomed out around January this year. Historical data shows that the impact of M2 on Bitcoin prices has a lag effect of 40-70 days. This means that its bottoming-out liquidity will most likely drive Bitcoin up in the medium term, and this transmission mechanism may take effect as soon as 20 days later.

Trade war fears are hitting the market, and the decline in US risk appetite is a significant negative for risk assets. But I think the impact of tariffs has been fully digested by the market, and the primary verification indicator is ETF fund flows:
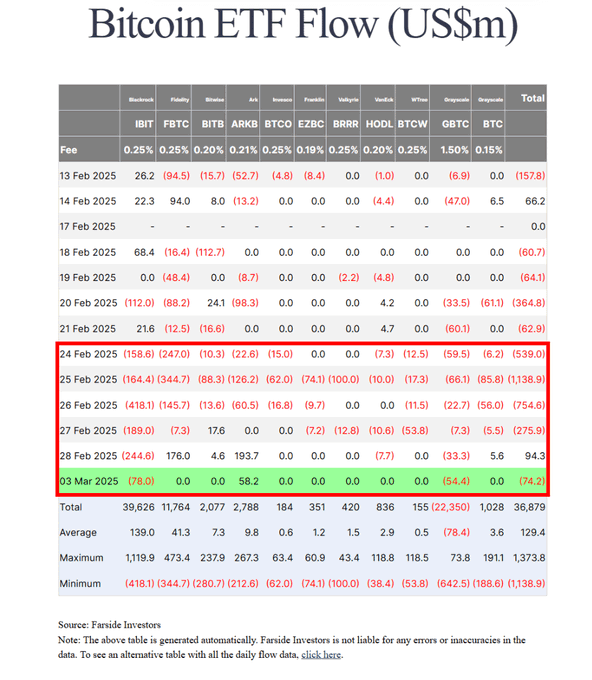
ETF fund flows and changes in market expectations
The outflow of ETF funds has slowed down significantly. Institutional investors have basically completed pricing in the impact of tariffs last week, and it is expected that there will be no larger-scale withdrawal of funds this week. It is worth noting that there are signs of bargain-hunting inflows in the market.
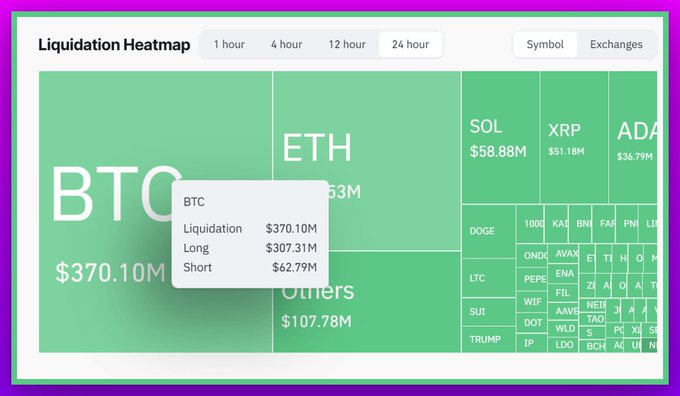
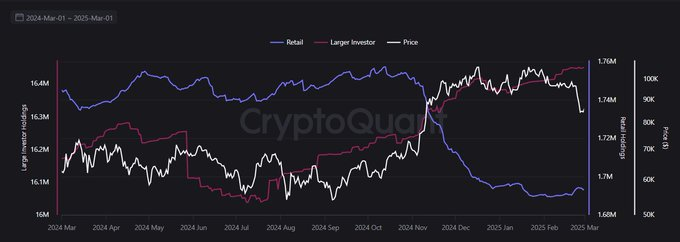
The current selling pressure mainly comes from two groups: retail investors who sell in panic, and institutional players who are well prepared. It is worth noting that retail investors may have misjudged expectations of policy delays.
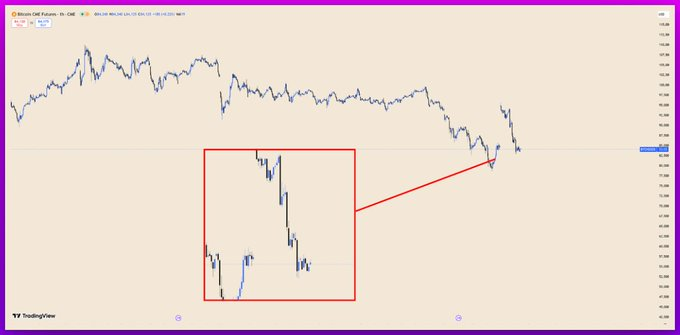
Another potential negative factor is the CME Bitcoin futures gap. This phenomenon refers to the gap between the Bitcoin spot price and the futures opening price when the CME exchange is closed for the weekend. Although the gap does not necessarily trigger an immediate sell-off, the common psychological expectation of gaps must be filled among traders will increase short-term selling pressure. It is worth noting that the technical gap was filled on March 4, and this influencing factor has been eliminated from the current price equation.
Based on the above analysis, we can summarize the three core driving factors that led to yesterdays price fluctuations:
• Insiders shorted after the announcement
• Long positions are forced to close
• A large influx of new short positions
Finally, I think there are not many negative factors left at the moment, and we can focus on the positive news that may come on March 7.
BTC prices have fallen back to pre-announcement levels and I think buying at current levels offers an excellent risk-reward ratio.
This article is sourced from the internet: Data interpretation of the current market: Has the opportunity to buy the bottom of Bitcoin arrived?
Related: Cardano (ADA) Drops 15% in a Week As Whales Continue to Sell
Cardano (ADA) has been down almost 34% in the last 30 days and more than 15% in the past week. Its market cap is now at $22 billion. It has been trading below $1 for over a month, reflecting persistent bearish sentiment. Technical indicators show a strong downtrend, with ADX rising to 46.8, signaling intensified selling pressure. However, if key support levels hold, ADA could reverse its trend and potentially break above $1 in March. Cardano ADX Shows the Current Downtrend Is Strong ADA’s ADX is currently at 46.8, rising sharply from 10.3 on February 23. The Average Directional Index (ADX) measures the strength of a trend without indicating its direction. It ranges from 0 to 100, with values above 25 signaling a strong trend and values below 20 suggesting…