Crypto Market Sentiment Research Report (23.08.-30.08.2024): Schockkorrektur im August, abwartende neue Trends
The market fluctuated and corrected in August, and we are waiting to see the new trend of the market
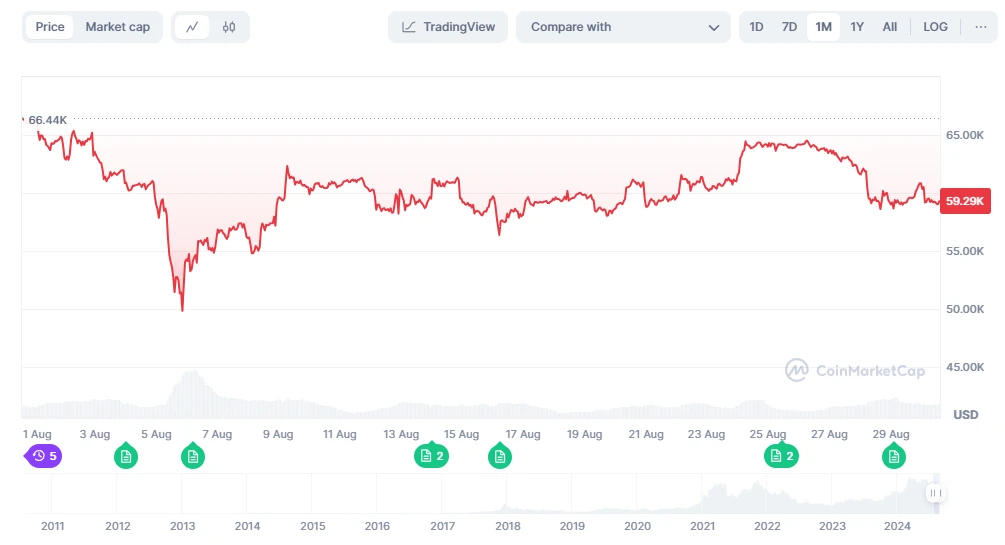
Data source: coinmarketcap
After the release of non-agricultural data in early August, the mainstream currency market experienced a sharp drop in price. Subsequently, the market has repeatedly experienced a trend of rising and falling, and the implied volatility has gradually declined from the highest level on August 5, and the overall market has shown a wide range of fluctuations. The current market urgently needs the guidance of a new round of economic data to promote the development of the next stage of the market.
The market generally expects the Fed to announce a rate cut at its meeting on September 19. However, the new non-farm payrolls data to be released on September 6 will be key. If the data is strong, it will significantly reduce the probability of the Fed cutting interest rates in mid-September. In addition, the PPI and CPI data to be released on September 11 and September 12 will also be closely watched. If these inflation indicators do not show a significant decline, it will also reduce the possibility of the Fed cutting interest rates. Therefore, investors need to pay close attention to the upcoming economic data to judge future market trends.
There are about 19 days until the next Federal Reserve interest rate meeting (September 19, 2024)
https://hk.investing.com/economic-calendar/interest-rate-decision-168
Analyse des technischen Marktes und der Stimmungslage

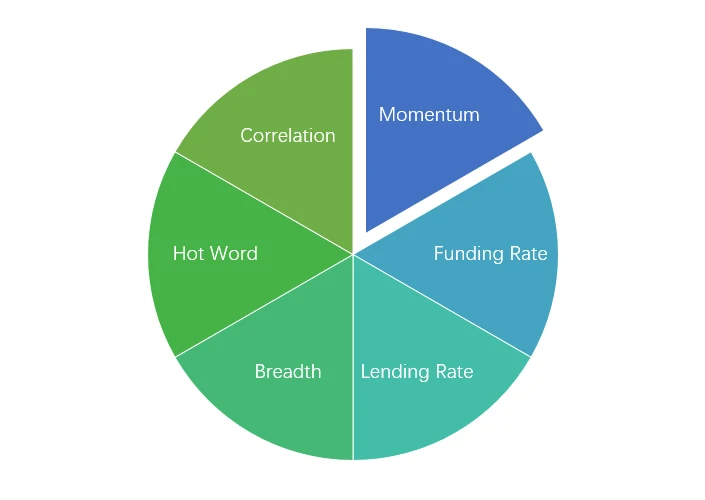
Komponenten der Stimmungsanalyse

Technische Indikatoren
Price Trends
BTC price fell -1.68% and ETH price fell -3.63% over the past week.
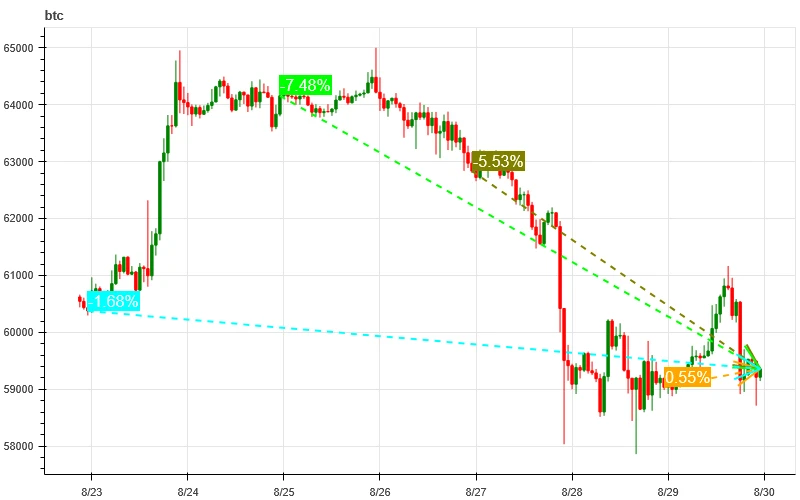
Das obige Bild ist das Preisdiagramm von BTC der letzten Woche.
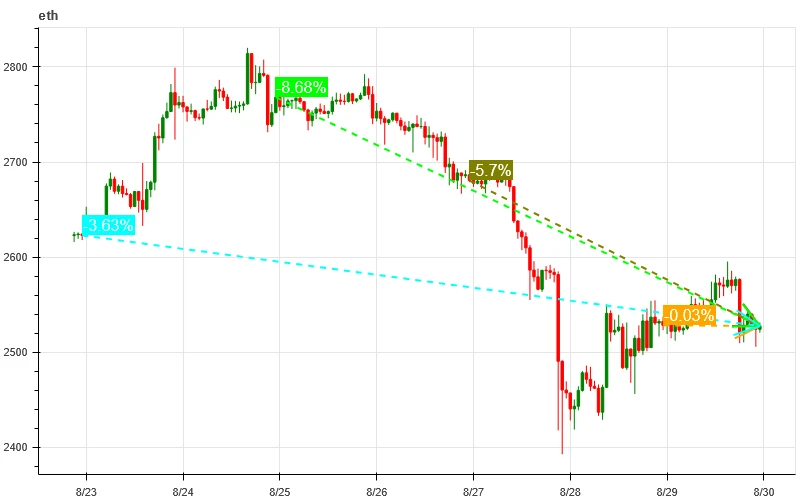
Das obige Bild ist das Preisdiagramm von ETH der letzten Woche.

Die Tabelle zeigt die Preisänderungsrate der letzten Woche.
pctChange1Day3Day5Day7Daybtc_pctChange0.55% -5.53% -7.48% -1.68% eth_pctChange-0.03% -5.7% -8.68% -3.63%
Preis-Volumen-Verteilungsdiagramm (Unterstützung und Widerstand)
In the past week, both BTC and ETH hit a high point and then fell back to a high-volume trading area.
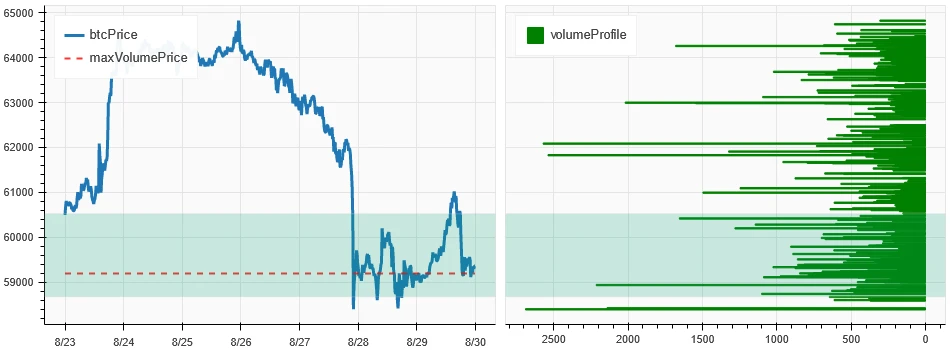
Das obige Bild zeigt die Verteilung der BTC-Handelsgebiete mit hoher Dichte in der vergangenen Woche.
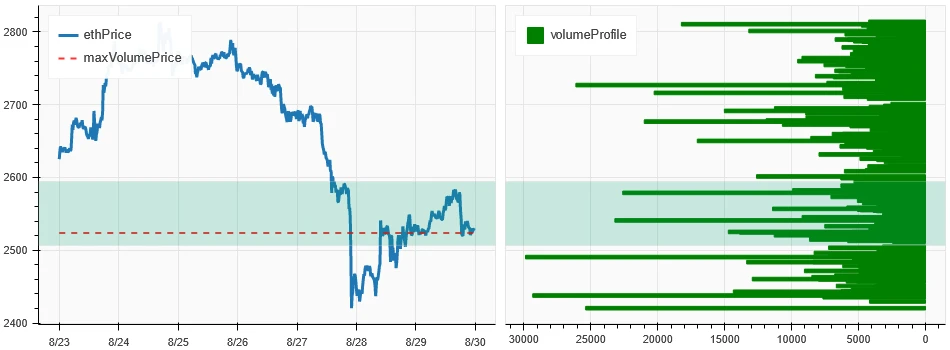
Das obige Bild zeigt die Verteilung der ETH-Handelsgebiete mit hoher Dichte in der vergangenen Woche.

Die Tabelle zeigt die wöchentliche intensive Handelsspanne von BTC und ETH in der vergangenen Woche.
Volumen und offenes Interesse
In the past week, the trading volume of BTC and ETH was the largest when they plummeted to 8.27; the open interest of BTC and ETH did not change significantly.

Oben im obigen Bild ist der Preistrend von BTC dargestellt, in der Mitte das Handelsvolumen, unten das offene Interesse, hellblau ist der 1-Tages-Durchschnitt und orange der 7-Tages-Durchschnitt. Die Farbe der K-Linie stellt den aktuellen Zustand dar, grün bedeutet, dass der Preisanstieg durch das Handelsvolumen unterstützt wird, rot bedeutet, dass Positionen geschlossen werden, gelb bedeutet, dass Positionen langsam akkumuliert werden und schwarz bedeutet, dass der Zustand überfüllt ist.
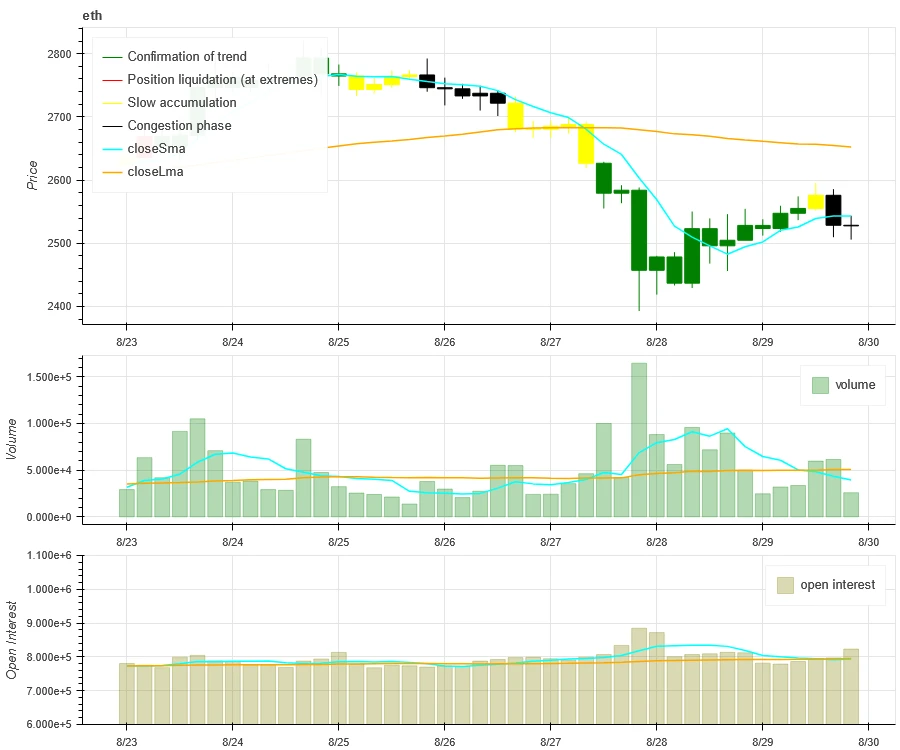
Oben im obigen Bild ist der Preistrend von ETH dargestellt, in der Mitte das Handelsvolumen, unten das offene Interesse, hellblau der 1-Tages-Durchschnitt und orange der 7-Tages-Durchschnitt. Die Farbe der K-Linie stellt den aktuellen Zustand dar, grün bedeutet, dass der Preisanstieg durch das Handelsvolumen unterstützt wird, rot bedeutet, dass Positionen geschlossen werden, gelb bedeutet, dass Positionen langsam angesammelt werden und schwarz bedeutet, dass Positionen überfüllt sind.
Historische Volatilität vs. implizite Volatilität
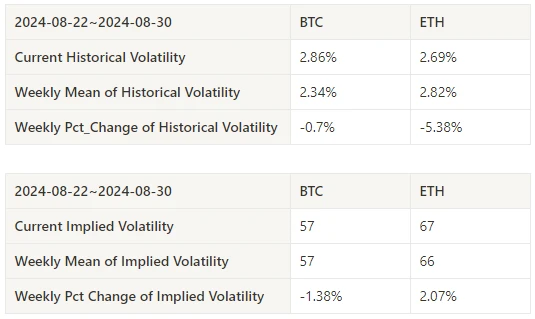
Historical volatility for BTC and ETH was highest this past week at 8.27; implied volatility for BTC fell while ETH rose.
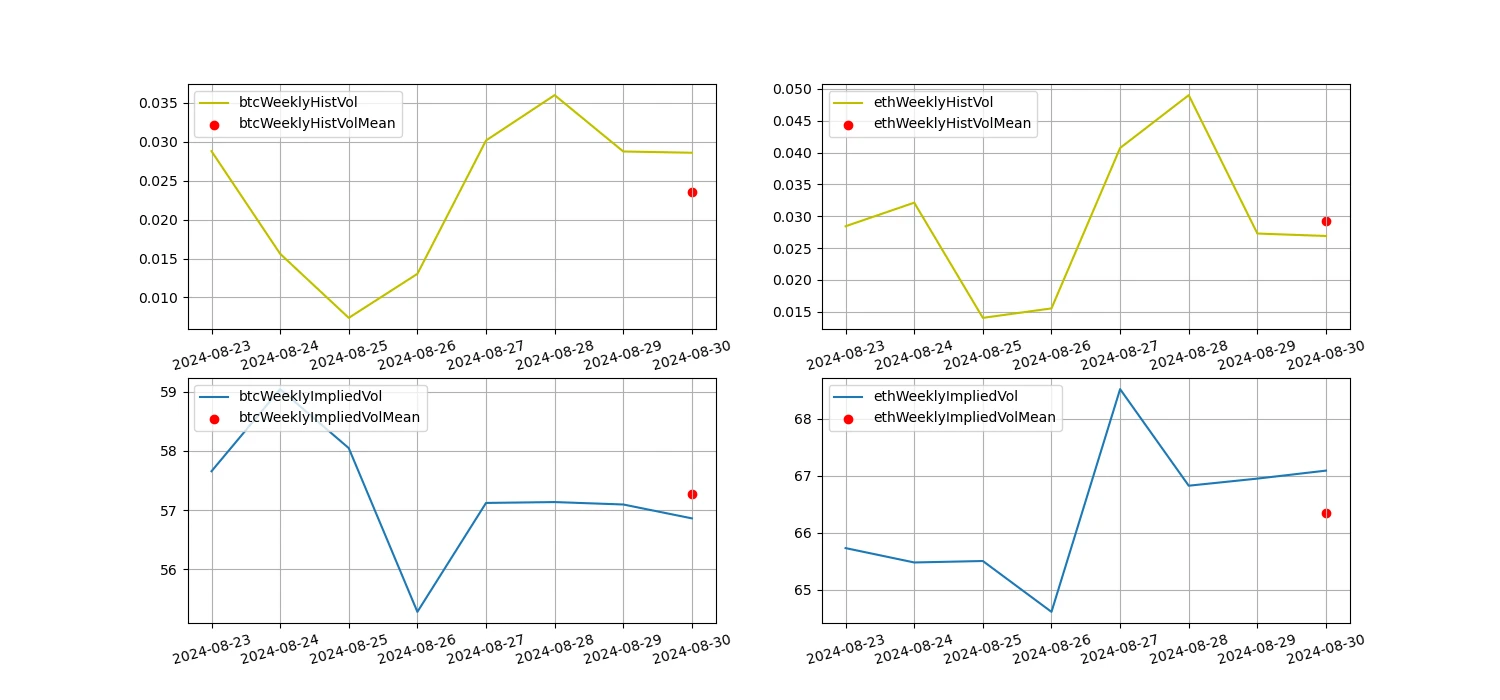
Die gelbe Linie ist die historische Volatilität, die blaue Linie die implizite Volatilität und der rote Punkt ist der 7-Tage-Durchschnitt.
Ereignisgesteuert
No major data was released in the past week, and we are waiting for the release of non-farm data on 09.06.
Emotional indicators
Momentum-Stimmung
In the past week, among Bitcoin/Gold/Nasdaq/Hang Seng Index/SSE 300, gold was the strongest, while Bitcoin performed the worst.
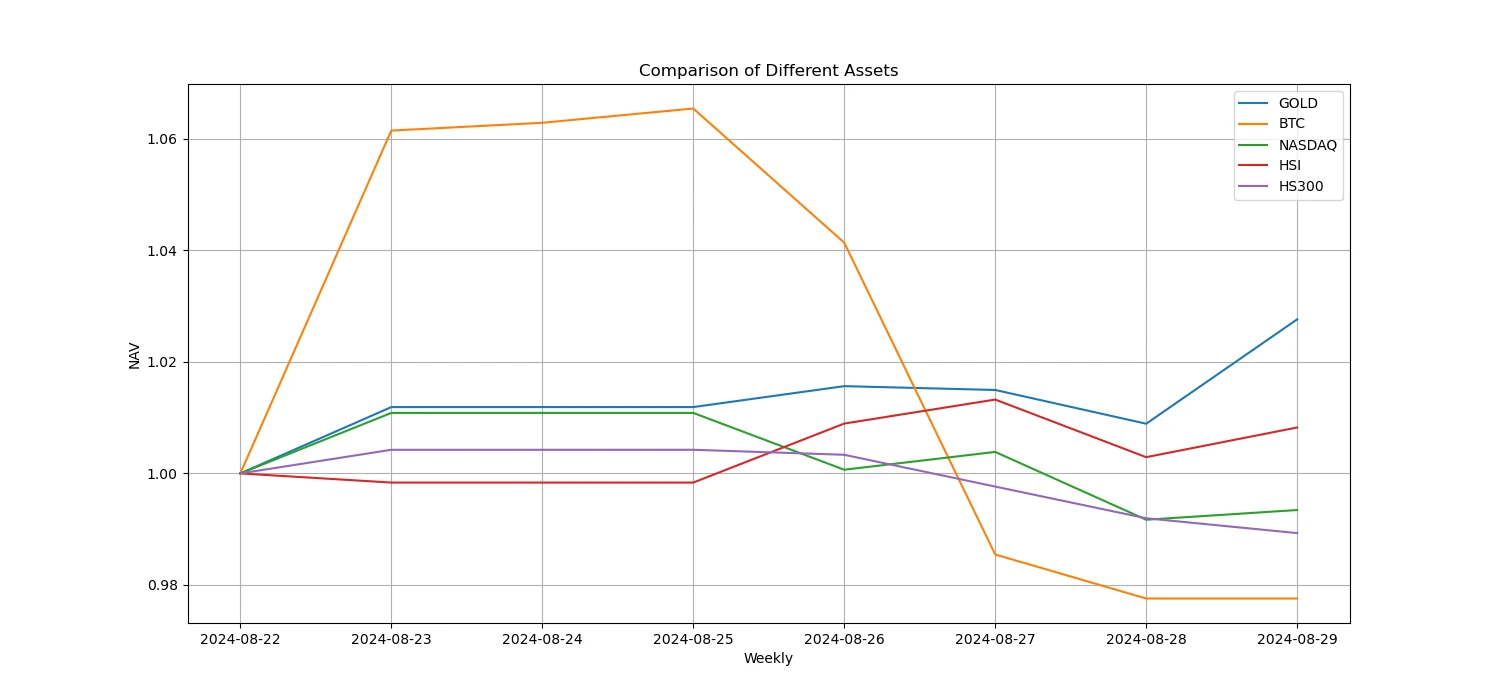
Das obige Bild zeigt den Trend verschiedener Vermögenswerte in der vergangenen Woche.

Kreditzins_Kreditstimmung
The average annualized return on USD lending over the past week was 9.9%, and short-term interest rates rose to 12%.
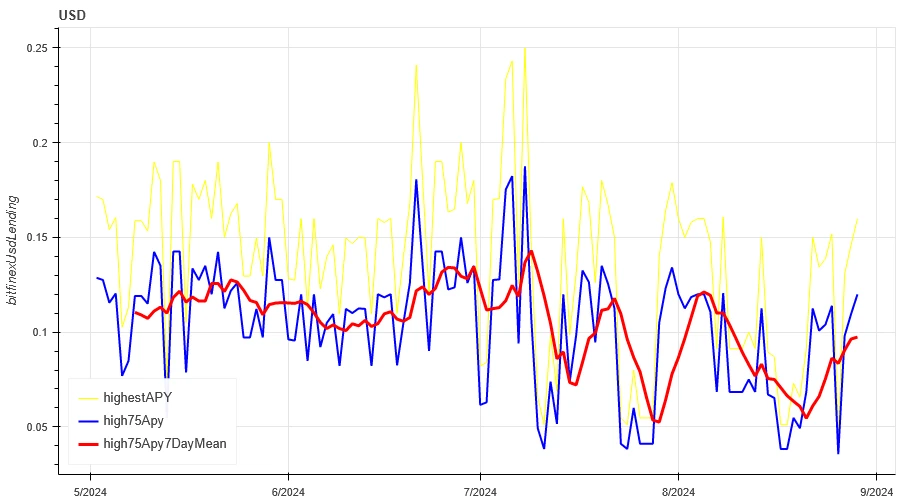
Die gelbe Linie stellt den höchsten Preis des USD-Zinssatzes dar, die blaue Linie entspricht 75% des höchsten Preises und die rote Linie ist der 7-Tage-Durchschnitt von 75% des höchsten Preises.

Die Tabelle zeigt die durchschnittlichen Renditen der USD-Zinssätze an verschiedenen Haltetagen in der Vergangenheit
Finanzierungsrate_Vertragshebelstimmung
The average annualized return on BTC fees in the past week was 0.3%, and contract leverage sentiment remained low.
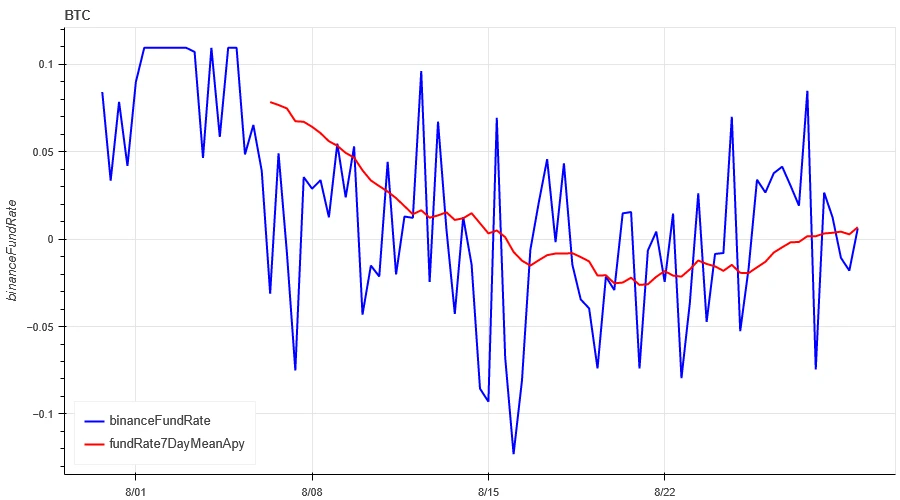
Die blaue Linie ist die Finanzierungsrate von BTC auf Binance und die rote Linie ist der 7-Tage-Durchschnitt

Die Tabelle zeigt die durchschnittliche Rendite der BTC-Gebühren für verschiedene Haltetage in der Vergangenheit.
Marktkorrelation_Konsensstimmung
The correlation among the 129 coins selected in the past week was around 0.8, and the consistency between different varieties was high.

In the above picture, the blue line is the price of Bitcoin, and the green line is [1000 floki, 1000 lunc, 1000 pepe, 1000 shib, 100 0x ec, 1inch, aave, ada, agix, algo, ankr, ant, ape, apt, arb, ar, astr, atom, audio, avax, axs, bal, band, bat, bch, bigtime, blur, bnb, btc, celo, cfx, chz, ckb, comp, crv, cvx, cyber, dash, doge, dot, dydx, egld, enj, ens, eos,etc, eth, fet, fil, flow, ftm, fxs, gala, gmt, gmx, grt, hbar, hot, icp, icx , imx, inj, iost, iotx, jasmy, kava, klay, ksm, ldo, link, loom, lpt, lqty, lrc, ltc, luna 2, magic, mana, matic, meme, mina, mkr, near, neo, ocean, one, ont, op, pendle, qnt, qtum, rndr, rose, rune, rvn, sand, sei, sfp, skl, snx , sol, ssv, stg, storj, stx, sui, sushi, sxp, theta, tia, trx, t, uma, uni, vet, waves, wld, woo, xem, xlm, xmr, xrp, xtz, yfi, zec, zen, zil, zrx] overall correlation
Marktbreite_Gesamtstimmung
Among the 129 coins selected in the past week, 41% of the coins were priced above the 30-day moving average, 48% of the coins were priced above the 30-day moving average relative to BTC, 18% of the coins were more than 20% away from the lowest price in the past 30 days, and 10% of the coins were less than 10% away from the highest price in the past 30 days. The market breadth indicator in the past week showed that most coins in the overall market returned to a downward trend.

The picture above is [bnb, btc, sol, eth, 1000 floki, 1000 lunc, 1000 pepe, 1000 sats, 1000 shib, 100 0x ec, 1inch, aave, ada, agix, ai, algo, alt, ankr, ape, apt, arb, ar, astr, atom, avax, axs, bal, band, bat, bch, bigtime, blur, cake, celo, cfx, chz, ckb, comp, crv, cvx, cyber, dash, doge, dot, dydx, egld, enj, ens, eos,etc, fet, fil, flow, ftm, fxs, gala, gmt, gmx, grt, hbar, hot , icp, icx, idu, imx, inj, iost, iotx, jasmy, jto, jup, kava, klay, ksm, ldo, link, loom, lpt, lqty, lrc, ltc, luna 2, magic, mana, manta, mask, matic, meme, mina, mkr, near, neo, nfp, ocean, one, ont, op, ordi, pendle, pyth, qnt, qtum, rndr, robin, rose, rune, rvn, sand, sei, sfp, skl, snx, ssv, stg, storj, stx, sui, sushi, sxp, theta, tia, trx, t, uma, uni, vet, waves, wif, wld, woo,xai, xem, xlm, xmr, xrp, xtz, yfi, zec, zen, zil, zrx ] 30-day proportion of each width indicator

Zusammenfassen
In the past week, the prices of Bitcoin (BTC) and Ethereum (ETH) fell by -1.68% and -3.63% after a short-term surge. After a short-term surge, the prices of both fell back to a low-level dense trading area. On August 27, the prices of both fell sharply, and the trading volume on that day reached a peak, while the open interest did not change significantly. In terms of volatility, the historical volatility reached its highest point on the decline on August 27, however, the implied volatility performance was differentiated: BTC implied volatility fell, while ETH rose. In the performance comparison of different assets, gold was the strongest among Bitcoin, Nasdaq, Hang Seng Index and CSI 300, while Bitcoin performed the weakest. The average annualized yield of USD lending is 9.9%. The average annualized return of BTC funding rate is 0.3%, indicating that the leverage sentiment of the contract is still low. The correlation between the selected 129 currencies remains around 0.8, showing a high consistency between different varieties. Market breadth indicators show that most cryptocurrencies in the overall market have returned to a downward trend.
Twitter: @ https://x.com/CTA_ChannelCmt
Webseite: kanalcmt.com
This article is sourced from the internet: Crypto Market Sentiment Research Report (2024.08.23-08.30): August shock correction, wait-and-see new trends
Related: Interpreting the new proposal ACP-77, how to unlock Avalanche L1?
Original author: Eden Au , The Block Original translation: Felix, PANews Key points: ACP-77 is a community proposal that will change the validator dynamics for Avalanche L1 (formerly known as subnets). Avalanche L1 validators will no longer need to validate the main network and stake at least 2,000 AVAX. Instead, they will follow the requirements set by the sovereign Avalanche L1. Avalanche L1 validators will pay an ongoing dynamic fee to register information on the P-Chain. The proposal benefits both institutional and retail Avalanche L1 as regulatory compliance and low barriers to entry for validators can be achieved. Avalanche has long been a proponent of horizontal scaling using “subnets,” which are now being rebranded as Avalanche Layer 1 (L1). Avalanche L1s are sovereign, often application-specific blockchains that can be individually…


