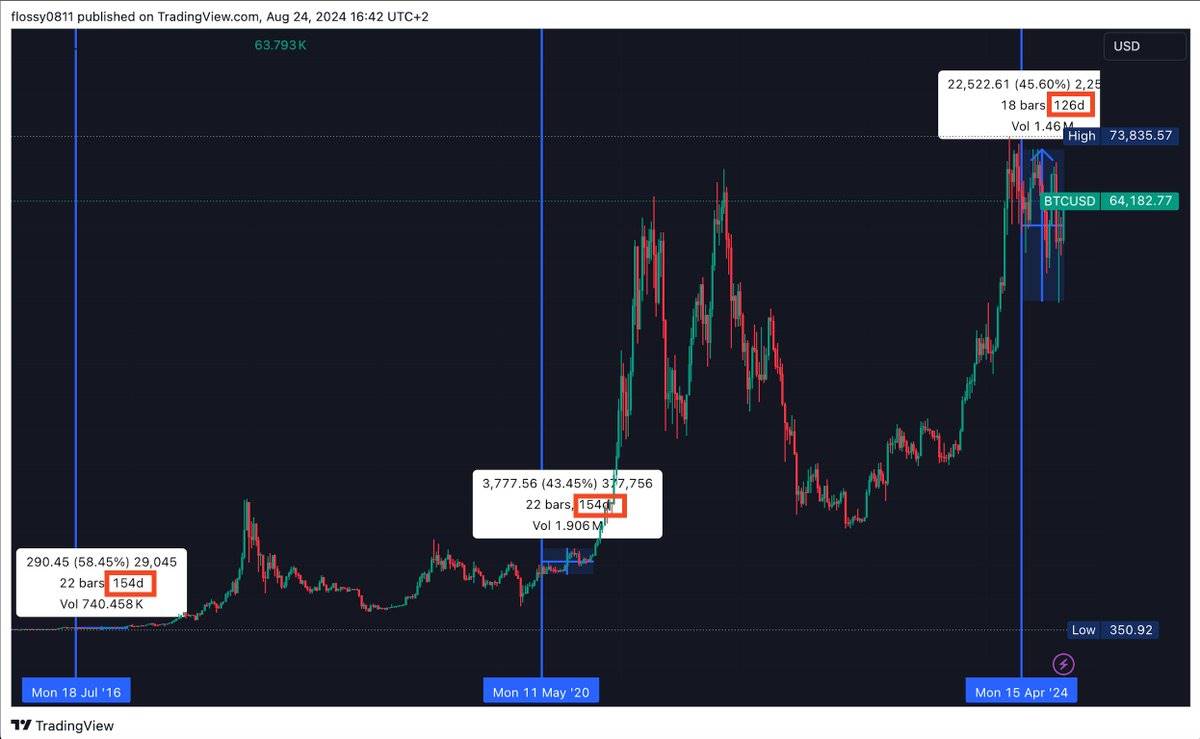
Es ist eine historische Regel geworden, dass der Markt nach der Halbierung seitwärts geht. Wird es dieses Mal anders sein?
Originalautor: Flossy
Originalübersetzung: TechFlow
Einführung
Bitcoin markets are entering an interesting phase after completing their fourth halving in April 2024. This cycle presents unique challenges for analysis, with new factors such as ETF approvals impacting traditional post-halving patterns.
In this post, we will review historical data from previous halvings, assess current market conditions, and explore an idea I have – a long period of consolidation that may define this cycle. While I am not claiming this idea to be completely novel, it is interesting to note that I have seen very little discussion of this idea recently. When I mention this idea, a common response is this cycle is different.
Bitcoin halving: History won’t repeat itself exactly, but there will always be similarities
First, let’s talk about the main character of this idea: the Bitcoin halving. We just completed the fourth halving on April 19, 2024. Here is a review of past halvings and what happened after they occurred:
-
November 28, 2012: Reward dropped to 25 bitcoins
-
July 9, 2016: Dropped to 12.5 Bitcoins
-
May 11, 2020: Cut to 6.25 Bitcoins
-
April 19, 2024: Now down to 3.125 BTC
Now, things get even more fascinating. Let’s look at the price action during previous halvings:
First Halving – November 28, 2012
-
Price at halving: about $12
-
Sideways period: about 1 year
-
Price at the end of sideways trading: About $100
-
Subsequent Bull Run High: ~$1,100 (November 2013)
-
Percentage increase from halving to peak: ~9,000%
Second halving – July 9, 2016
-
Price at halving: about $650
-
Sideways period: about 0.5 – 1.5 years (depending on how you view the bull market)
-
Price at the end of the sideways trend: ~$1,000
-
Subsequent bull run high: ~$19,700 (December 2017)
-
Percentage increase from halving to peak: ~2,930%
Third halving – May 11, 2020
-
Price at halving: ~$8,600
-
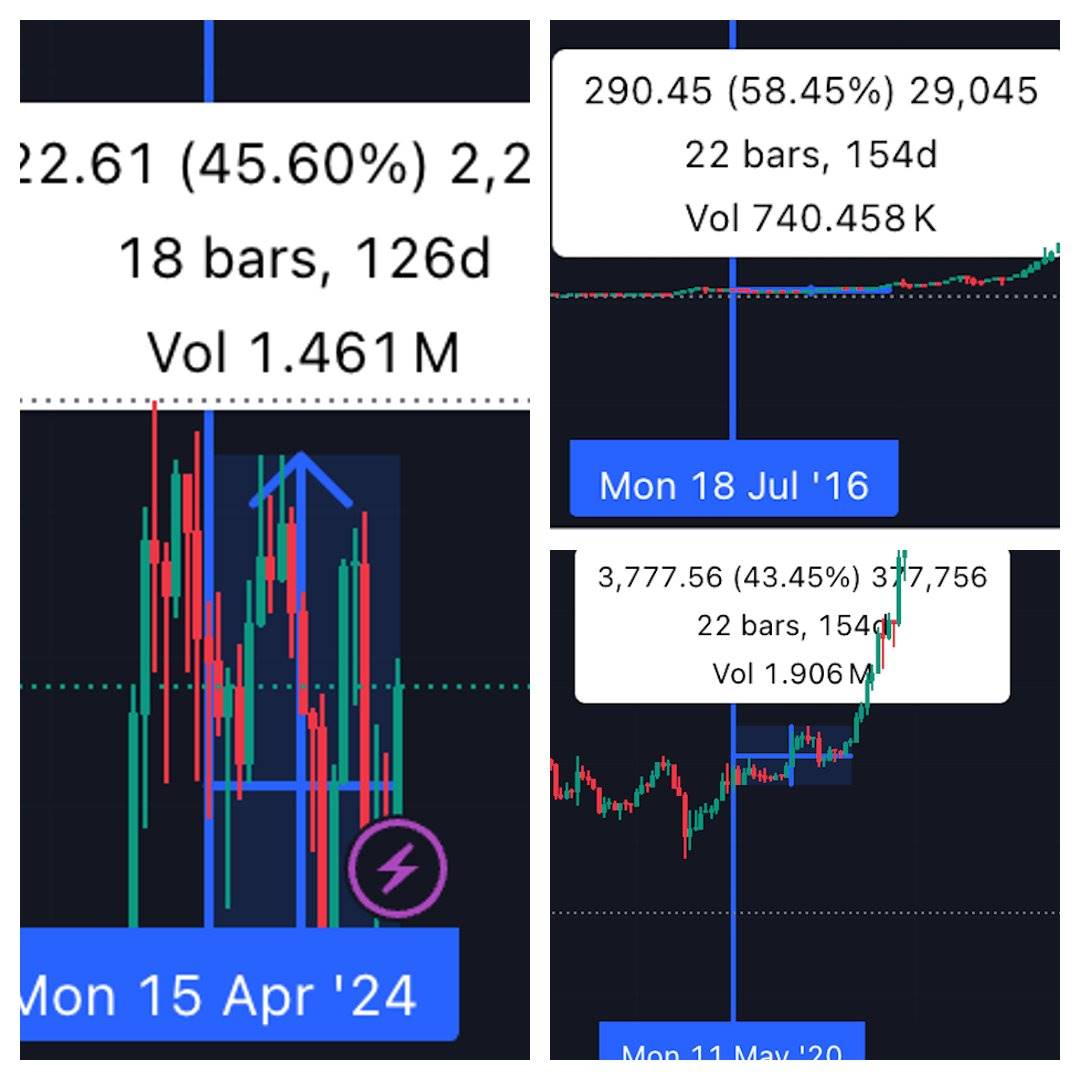
Sideways period: about 6 months
-
Price at the end of sideways trading: ~$10,000
-
Subsequent bull run high: ~$69,000 (November 2021)
-
Percentage increase from halving to peak: ~702%
Current halving – April 19, 2024
-
Price at halving: ~$64,000
-
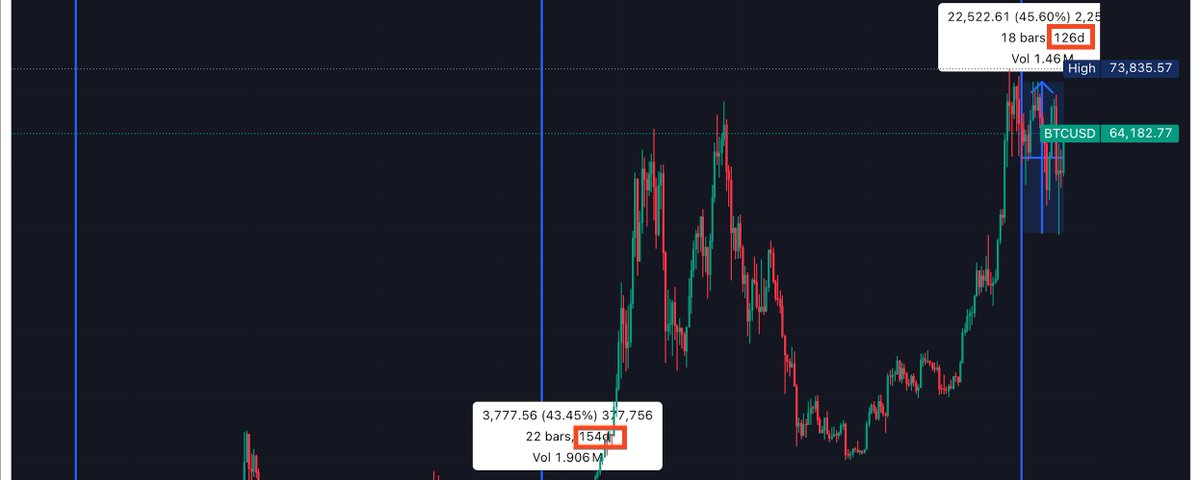
Sideways period: 5 months so far
The Great Sideways Theory: We Are in the Middle of It
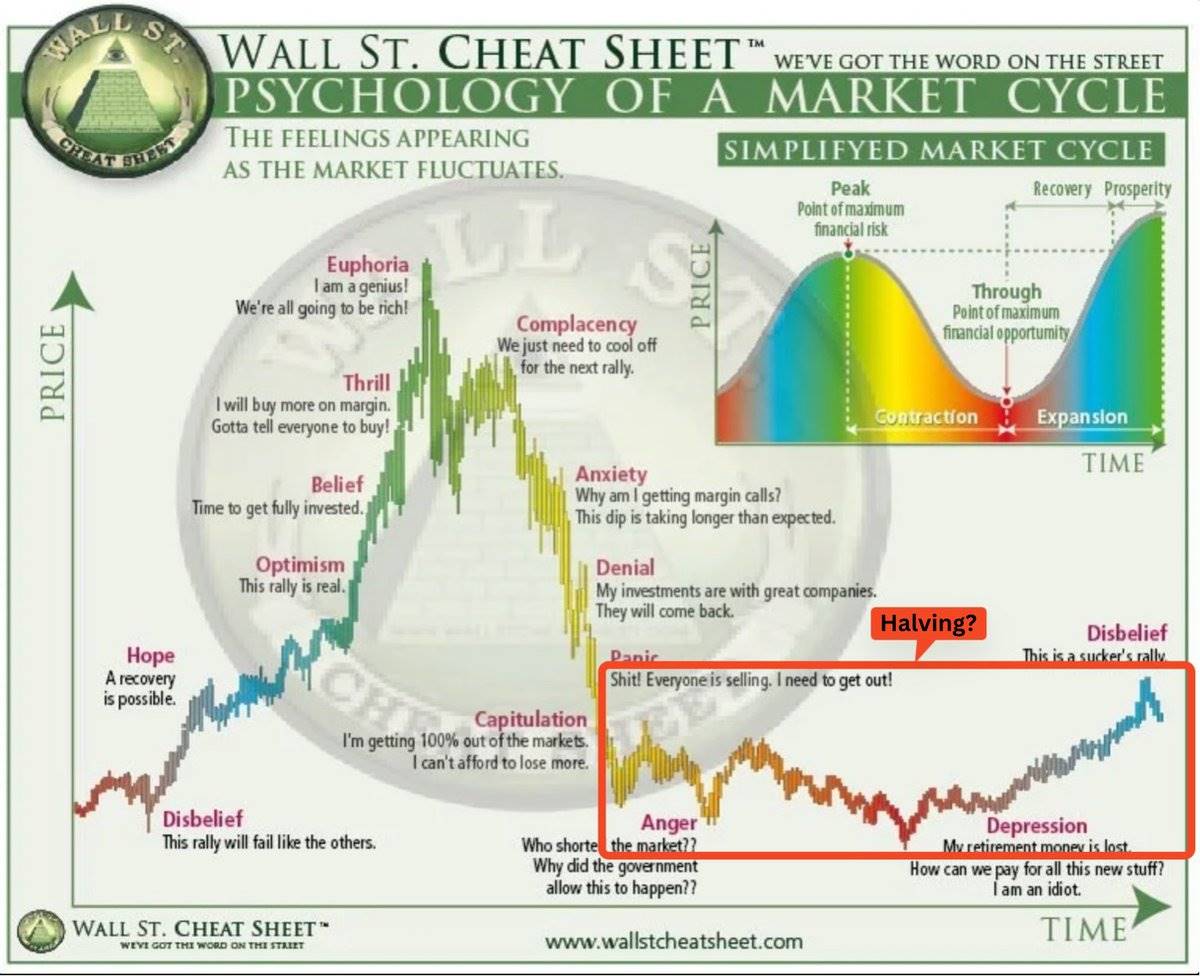
This is where my theory comes in. Because that is exactly what we are seeing right now: a sideways price action that is psychologically challenging for many investors.
Looking at the numbers, the pattern seems clear:
-
Initial Rise: We typically see a surge in price before the halving.
-
The Great Sideways: After the halving, we entered a consolidation period of about 6 months.
-
Breakout: After sideways trading, the real bull run begins, leading to new all-time highs.
Picture: Could this be where we are?
This halving cycle: similar yet different
Now, you might be asking, “Wait, we reached an all-time high before this halving!” You’d be right. The January 2024 ETF approval changes the typical post-halving market landscape, causing prices to rise ahead of time.
The ETF Effect: A New Market Dynamic
The approval and launch of Bitcoin and Ethereum spot ETFs have brought new dynamics to the crypto market. Let’s analyze:
1. Bitcoin ETF Approval (January 2024): This leads to a significant increase in price and volume. We see Bitcoin reaching new all-time highs before the halving, which is different from previous cycles.
2. Ethereum ETF Approval (May 2024): Hot on the heels of Bitcoin, the Ethereum ETF was also approved and launched. This brought new institutional investor interest and arguably more money into the crypto space.
While these developments have brought new liquidity and attention to the market, they do not necessarily negate the underlying cyclical pattern. A “sideways market” may still be in play, but it is operating on a new scale and with new variables.
Data-backed sideways trading: It’s more than just a theory
Figure: Timeframes and ranges of previous halvings
Even during this pre-halving rally, we are still seeing signs of a sideways market:
1. Declining Volatility: Despite the higher price, Bitcoin’s volatility has been decreasing since the halving.
2. Trading range: Since the halving, we have been trading in a relatively narrow range, with classic sideways behavior of about 25% fluctuations in both directions.
3. Declining Volume: The overall volume has been declining, which is also a sign of a sideways market.
Origin of the theory
It’s worth noting that this isn’t a theory I just came up with. I’ve been sharing elements of this idea on my Telegram channel for some time. I started discussing it as early as April 9th, shortly before the halving. These early posts touched on the core ideas behind the theory — the importance of recognizing post-halving market patterns, the risks of overthinking short-term volatility, and the value of focusing on accumulation during these periods.
Institutional sideways trading: New players in the game
Now, the cycle gets more interesting. We have a new player: institutional investors entering the market through ETFs. These are not your typical “buy high, sell low” retail investors. They move slowly and steadily, accumulating during sideways periods.
ETF data shows that inflows have remained steady even during periods of price stagnation. That’s institutional sideways trading at work, and it’s changing the rules of the game.
What this means for the current cycle
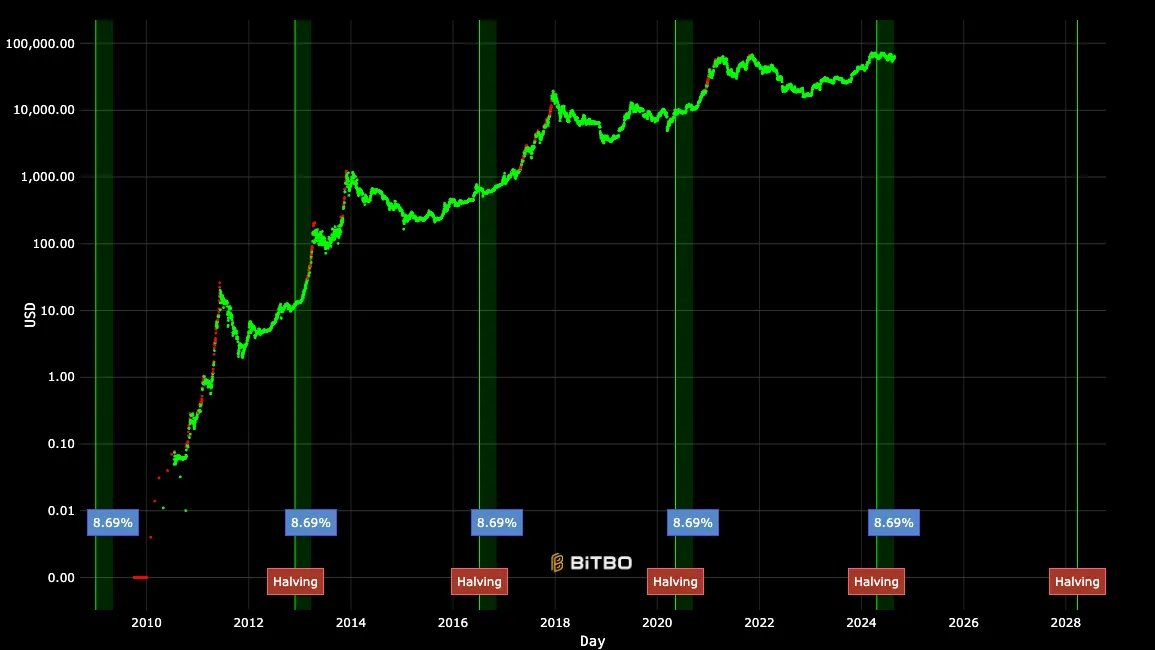
Figure: Historical monthly price trend (Bitcoin)
Based on historical data and current market conditions, we might expect the following:
1. Accumulation Phase: Smart money (institutional, large investors, and savvy retail investors via ETFs) will likely continue to accumulate during this phase.
2. Potential Breakout Time Frame: If historical patterns hold true (as they usually do in crypto markets), we could see a true bull run kick off in Q4 2024 or Q1 2025.
3. Short-term historical patterns: Historical data strongly supports the view that we are at a critical juncture. Take a look at Bitcoin’s monthly returns over the past decade:
The comparison of September and October’s performance almost perfectly matches the typical transition from a “sideways/bearish” to a “bullish” phase after the halving. If this pattern holds true this year, we may see the current consolidation phase end in September, followed by a significant rise in October.
-
The average return for September was -4.78% and the median was -5.58%, making it one of the worst performing months historically.
-
In comparison, October has an average return of 22.90% and a median return of 27.70%, consistently one of the best performing months.
Consistency of Pattern: What is particularly striking is the consistency of this pattern. In the data shown, October has been positive in 9 out of 12 years, with some of these years having very impressive gains (e.g. 60.79% in 2013 and 39.93% in 2021). This consistency lends credence to our view that we are on the verge of a potential market shift.
Conclusion: Patience is still the core of the game
Previous halvings
The data doesn’t lie. Every halving cycle has its sideways phase, and there’s no reason to think this time will be different. Yes, ETFs add new factors, but the fundamental market dynamics remain the same.
So what’s a smart crypto player like you to do? It’s simple:
-
Accumulation: Use this sideways market to build your position (but never invest more than you can afford to lose).
-
Be patient: Remember, the greatest gains come to those who are able to wait.
Patience is more than just a virtue in the crypto markets — it’s a powerful weapon. While others are frustrated by sideways price action, you’ll be accumulating because you know the real moves are yet to come.
Im just an average internet user, though. This is not financial advice. Always do your own research and manage your risks.
This article is sourced from the internet: It has become a historical rule that the market will go sideways after halving. Will it be different this time?
Related: A16z team reading list: 10 excellent books recommended
Original article by: Stacy Muur Original translation: TechFlow Since 2016, @a16z has regularly shared the teams reading lists. Here are their top 10 economics, business, and finance recommendations. Broken Money Author: @LynAldenContact Abstract: Broken Money provides readers with an in-depth understanding of money and its history, covering both theoretical foundations and practical impacts. Who Gets What — and Why Author: @shanesnow Abstract: Who Gets What—and Why reveals the hidden matching market around us and teaches us how to identify good matches so that we can make smarter and more confident decisions. Smartcuts: How Hackers, Innovators, and Icons Accelerate Success Author: @shanesnow Summary: Smartcuts is a narrative journey that debunks old myths about success. It shows how innovators and icons achieve extraordinary things by working smarter, and how the rest of…
