Krypto-Marktstimmungsforschungsbericht (05.07.–12.07.2024): Verbraucherpreisindex sinkt, Preise der Mainstream-Währungen steigen und fallen
CPI data fell, mainstream currency prices rose and fell
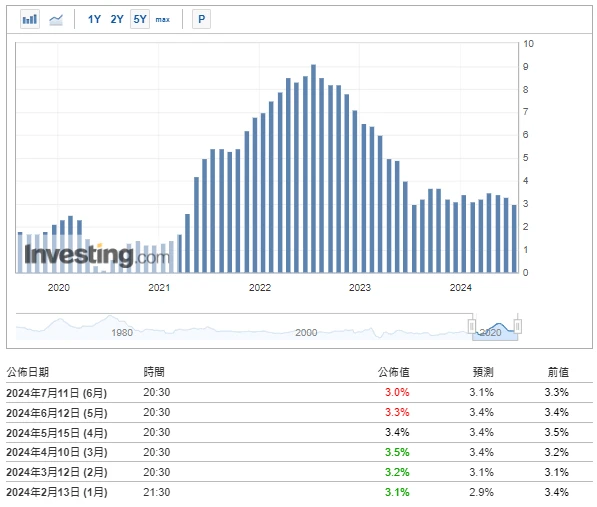
Datenquelle: https://hk.investing.com/economic-calendar/cpi-733
Expectations for interest rate cuts have increased significantly this year, with the probability of the first rate cut in September rising to 80%, and the probability of a rate cut in July reappearing. The prices of Bitcoin and Ethereum continued to rise before the release of CPI data, and then fell back after the data was released. Data released by the U.S. Department of Labor showed that the year-on-year growth rate of the U.S. Consumer Price Index (CPI) slowed from 3.3% in May to 3% in June, the lowest growth rate since June last year; month-on-month, it turned from flat in May to a decline of 0.1% in June, a 0.1 percentage point drop from the previous month, the first negative growth since May 2020, showing signs of continued slowdown in inflation.
There are about 17 days until the next Fed meeting (August 1, 2024)
https://hk.investing.com/economic-calendar/interest-rate-decision-168
Analyse des technischen Marktes und der Stimmungslage


Komponenten der Stimmungsanalyse

Technische Indikatoren
Preisentwicklung
BTC prices rose 0.51% and ETH prices rose 1.3% over the past week.
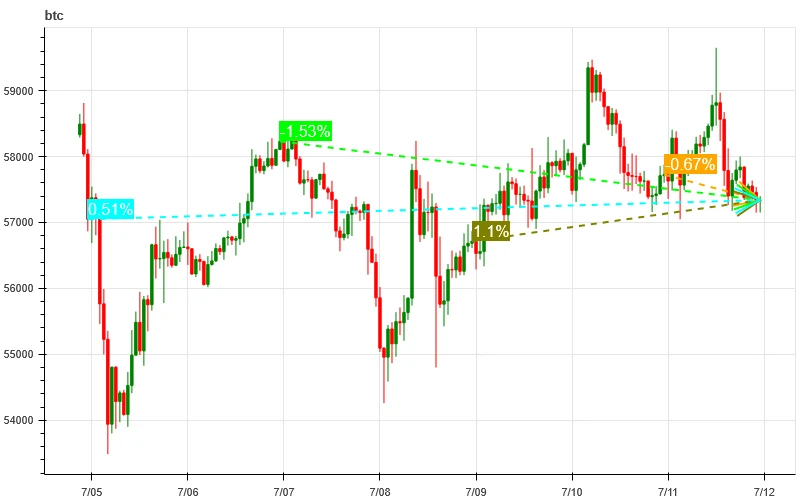
Das obige Bild ist das Preisdiagramm von BTC der letzten Woche.

Das obige Bild ist das Preisdiagramm von ETH der letzten Woche.

Die Tabelle zeigt die Preisänderungsrate der letzten Woche.
Preis-Volumen-Verteilungsdiagramm (Unterstützung und Widerstand)
In the past week, BTC and ETH fluctuated upward after forming a new dense trading area with large volumes at low levels.
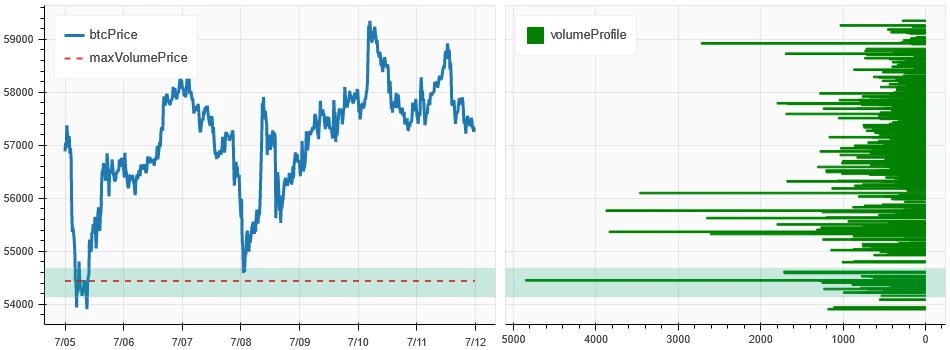
Das obige Bild zeigt die Verteilung der BTC-Handelsgebiete mit hoher Dichte in der vergangenen Woche.

Das obige Bild zeigt die Verteilung der ETH-Handelsgebiete mit hoher Dichte in der vergangenen Woche.

Die Tabelle zeigt die wöchentliche intensive Handelsspanne von BTC und ETH in der vergangenen Woche.
Volumen und offenes Interesse
Over the past week, BTC and ETH had the largest trading volume when they fell on July 5; open interest for both BTC and ETH continued to decline.
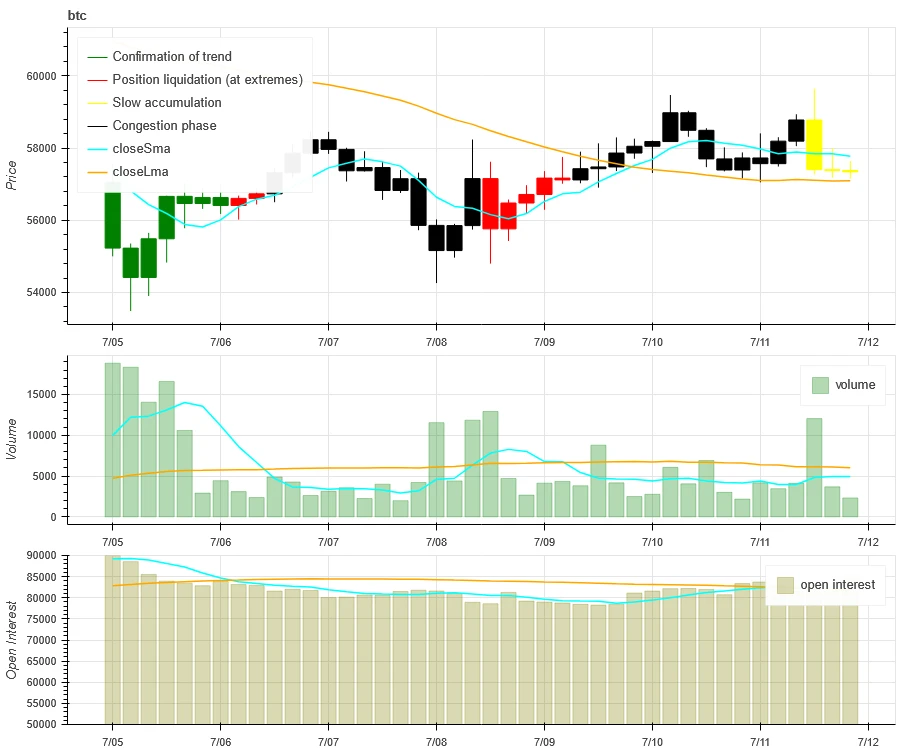
Oben im obigen Bild ist der Preistrend von BTC dargestellt, in der Mitte das Handelsvolumen, unten das offene Interesse, hellblau ist der 1-Tages-Durchschnitt und orange der 7-Tages-Durchschnitt. Die Farbe der K-Linie stellt den aktuellen Zustand dar, grün bedeutet, dass der Preisanstieg durch das Handelsvolumen unterstützt wird, rot bedeutet, dass Positionen geschlossen werden, gelb bedeutet, dass Positionen langsam akkumuliert werden und schwarz bedeutet, dass der Zustand überfüllt ist.
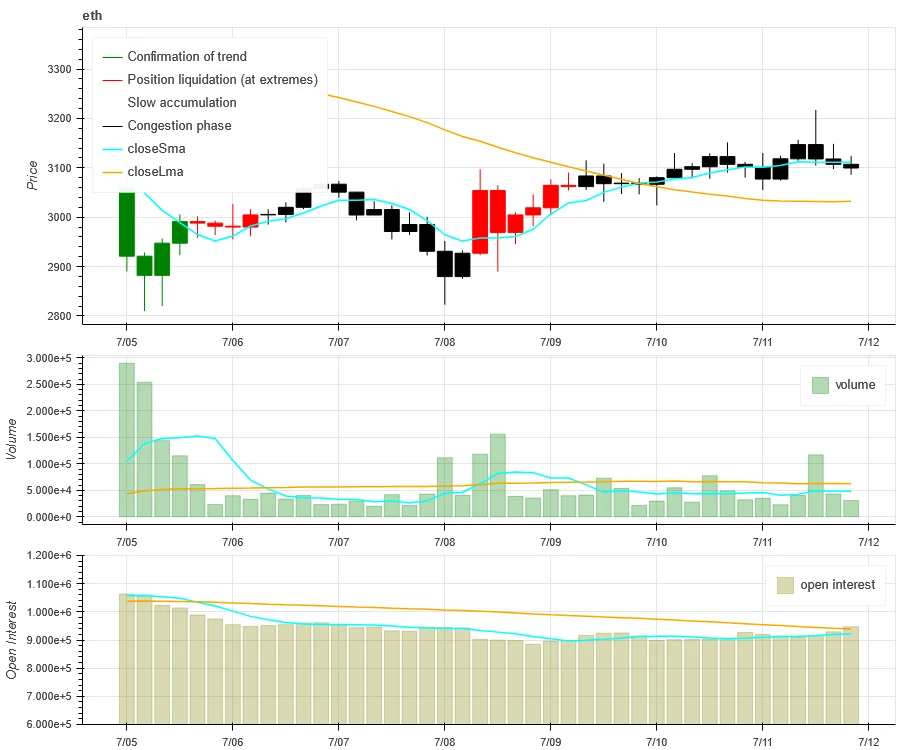
Oben im obigen Bild ist der Preistrend von ETH dargestellt, in der Mitte das Handelsvolumen, unten das offene Interesse, hellblau der 1-Tages-Durchschnitt und orange der 7-Tages-Durchschnitt. Die Farbe der K-Linie stellt den aktuellen Zustand dar, grün bedeutet, dass der Preisanstieg durch das Handelsvolumen unterstützt wird, rot bedeutet, dass Positionen geschlossen werden, gelb bedeutet, dass Positionen langsam angesammelt werden und schwarz bedeutet, dass Positionen überfüllt sind.
Historische Volatilität vs. implizite Volatilität
In the past week, the historical volatility of BTC and ETH was highest when it fell to 7.5; the implied volatility of BTC and ETH fell synchronously.
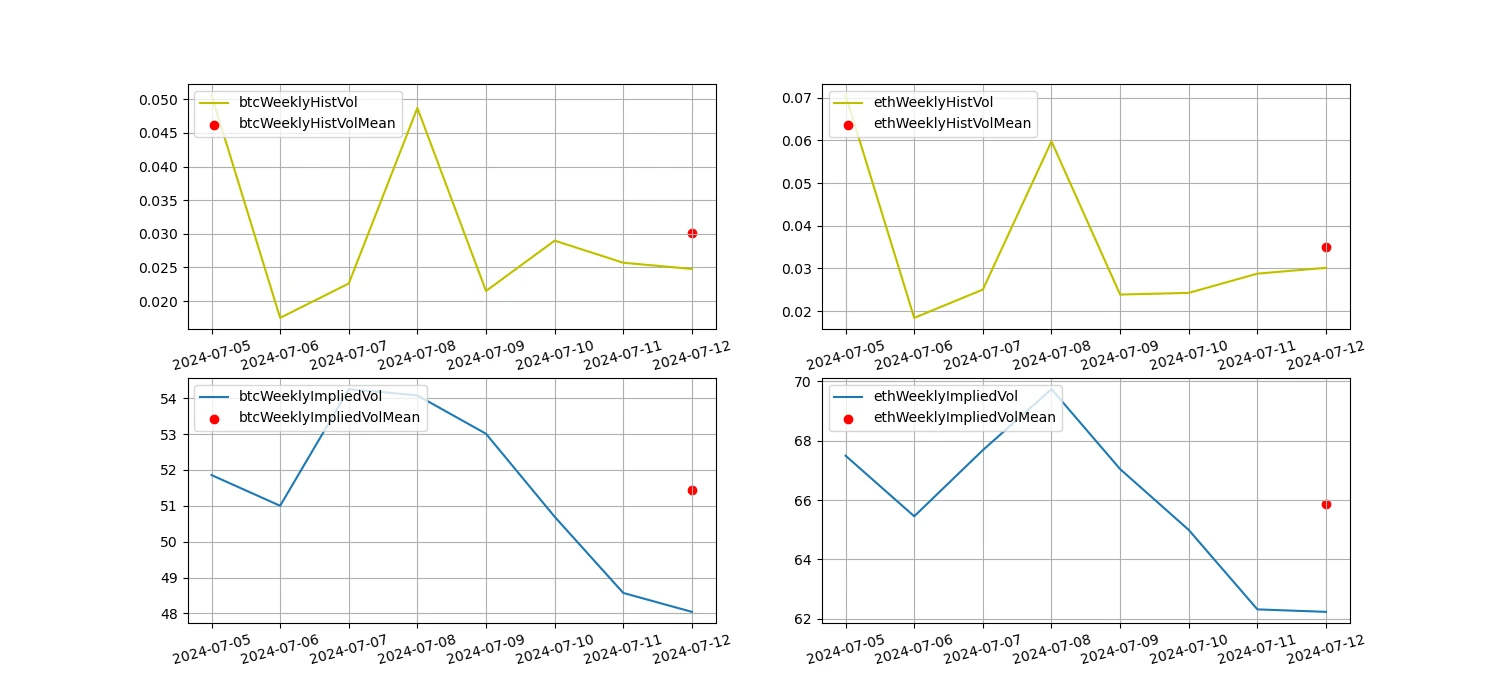
Die gelbe Linie ist die historische Volatilität, die blaue Linie die implizite Volatilität und der rote Punkt ist der 7-Tage-Durchschnitt.

Ereignisgesteuert
Over the past week, the prices of Bitcoin and Ethereum continued to rise before the release of CPI data, and then fell back after the data was released.
Stimmungsindikatoren
Momentum-Stimmung
In the past week, among Bitcoin/gold/Nasdaq/Hang Seng Index/CSI 300, gold was the strongest, while Hang Seng Index performed the worst.
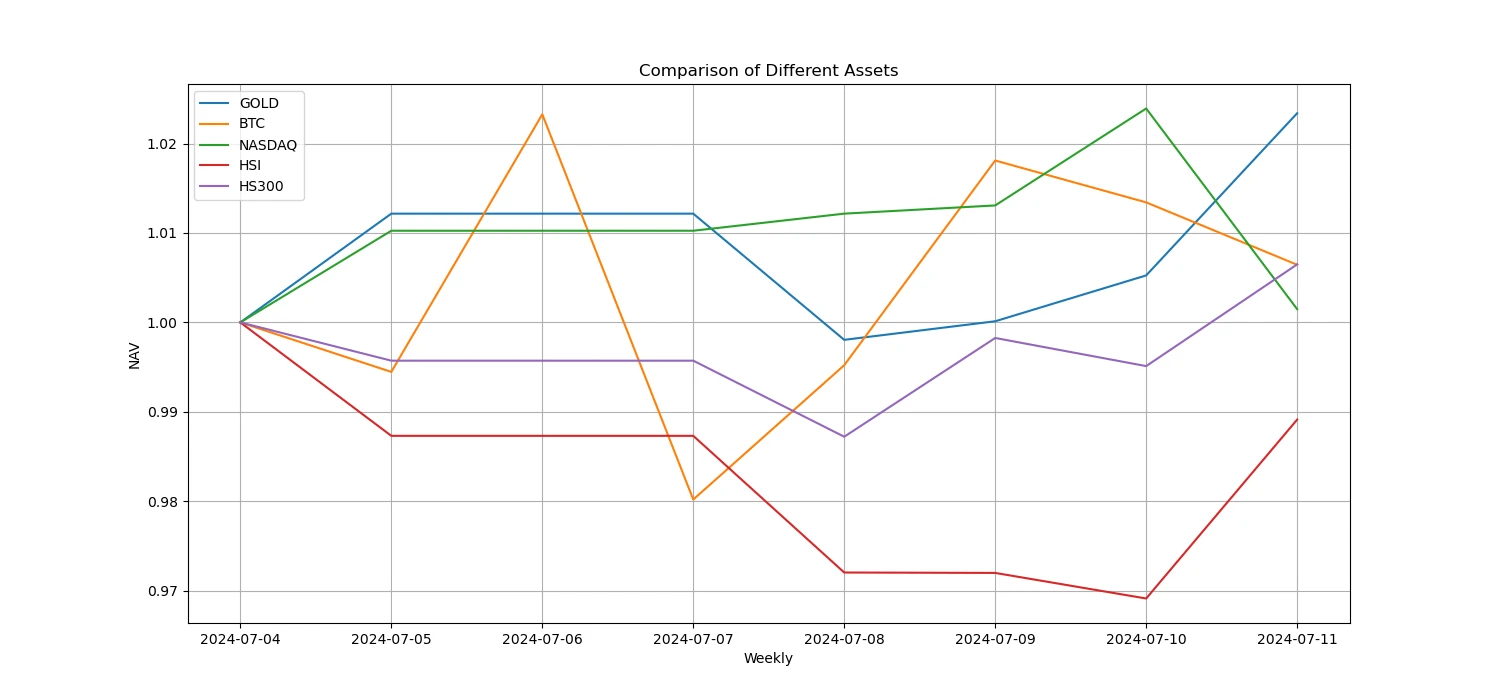
Das obige Bild zeigt den Trend verschiedener Vermögenswerte in der vergangenen Woche.

Kreditzins_Kreditstimmung
The average annualized return on USD lending over the past week was 12%, and short-term interest rates fell to 3.8%.

Die gelbe Linie stellt den höchsten Preis des USD-Zinssatzes dar, die blaue Linie entspricht 75% des höchsten Preises und die rote Linie ist der 7-Tage-Durchschnitt von 75% des höchsten Preises.

Die Tabelle zeigt die durchschnittlichen Renditen der USD-Zinssätze an verschiedenen Haltetagen in der Vergangenheit
Finanzierungsrate_Vertragshebelstimmung
The average annualized return on BTC fees in the past week was 8.8%, and contract leverage sentiment remained at a low level.
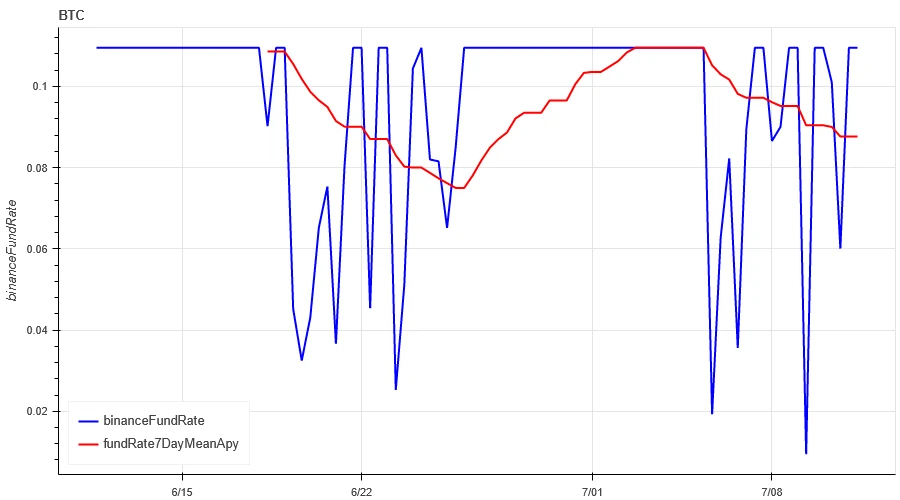
Die blaue Linie ist die Finanzierungsrate von BTC auf Binance und die rote Linie ist der 7-Tage-Durchschnitt

Die Tabelle zeigt die durchschnittliche Rendite der BTC-Gebühren für verschiedene Haltetage in der Vergangenheit.
Marktkorrelation_Konsensstimmung
The correlation among the 129 coins selected in the past week remained at around 0.73, and the consistency between different varieties fell from a high level.
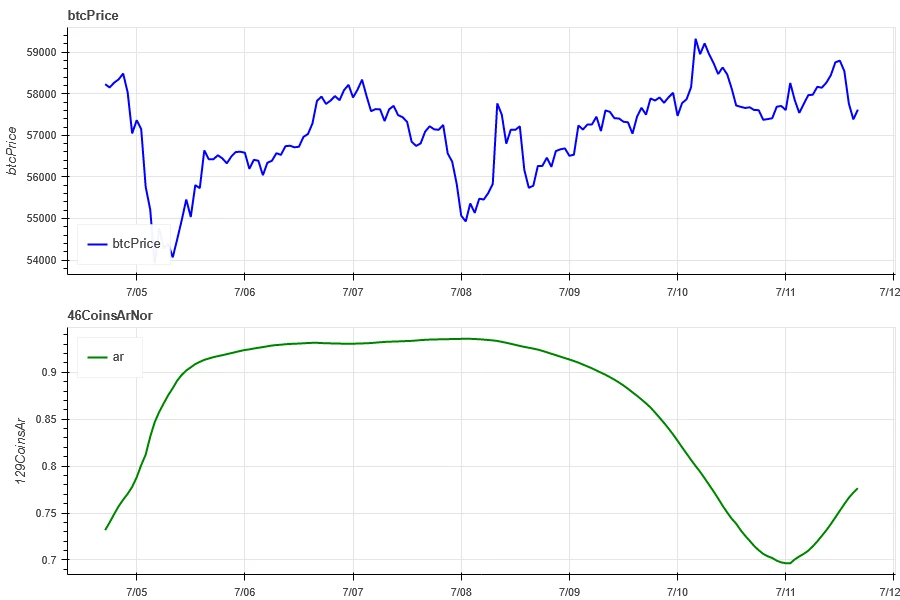
In the above picture, the blue line is the price of Bitcoin, and the green line is [1000 floki, 1000 lunc, 1000 pepe, 1000 shib, 100 0x ec, 1inch, aave, ada, agix, algo, ankr, ant, ape, apt, arb, ar, astr, atom, audio, avax, axs, bal, band, bat, bch, bigtime, blur, bnb, btc, celo, cfx, chz, ckb, comp, crv, cvx, cyber, dash, doge, dot, dydx, egld, enj, ens, eos,etc, eth, fet, fil, flow, ftm, fxs, gala, gmt, gmx, grt, hbar, hot, icp, icx, imx, inj, iost, iotx, jasmy, kava, klay, ksm, ldo, link, loom, lpt, lqty, lrc, ltc, luna 2, magic, mana, matic, meme, mina, mkr, near, neo, ocean, one, ont, op, pendle, qnt, qtum, rndr, rose, rune, rvn, sand, sei, sfp, skl, snx, sol, ssv, stg, storj, stx, sui, sushi, sxp, theta, tia, trx, t, uma, uni, vet, waves, wld, woo, xem, xlm, xmr, xrp, xtz, yfi, zec, zen, zil, zrx] overall correlation
Marktbreite_Gesamtstimmung
Among the 129 coins selected in the past week, 9.4% of the coins were priced above the 30-day moving average, 33.8% of the coins were priced above the 30-day moving average relative to BTC, 5.5% of the coins were more than 20% away from the lowest price in the past 30 days, and 10% of the coins were less than 10% away from the highest price in the past 30 days. The market breadth indicator in the past week showed that most coins in the overall market continued to fall.

Das obige Bild zeigt [bnb, btc, sol, eth, 1000 floki, 1000 lunc, 1000 pepe, 1000 sats, 1000 shib, 100 0x ec, 1inch, aave, ada, agix, ai, algo, alt, ankr, ape, apt, arb, ar, astr, atom, avax, axs, bal, band, bat, bch, bigtime, blur, cake, celo, cfx, chz, ckb, comp, crv, cvx, cyber, dash, doge, dot, dydx, egld, enj, ens, eos,etc, fet, fil, flow, ftm, fxs, gala, gmt, gmx, grt, hbar, hot, icp, icx, idu, imx, inj, iost, iotx, jasmy, jto, jup, kava, klay, ksm, ldo, link, loom, lpt, lqty, lrc, ltc, luna 2, magie, mana, manta, maske, matic, meme, mina, mkr, near, neo, nfp, ozean, eins, ont, op, ordi, pendle, pyth, qnt, qtum, rndr, robin, rose, rune, rvn, sand, sei, sfp, skl, snx, ssv, stg, storj, stx, sui, sushi, sxp, theta, tia, trx, t, uma, uni, vet, wellen, wif, wld, woo,xai, xem, xlm, xmr, xrp, xtz, yfi, zec, zen, zil, zrx ] 30-Tage-Anteil jedes Breitenindikators

Zusammenfassen
In the past week, the prices of Bitcoin (BTC) and Ethereum (ETH) fluctuated upward after heavy volume at low levels, while the volatility and trading volume of these two cryptocurrencies reached their highest levels when they fell to the low point on July 5. The open interest of Bitcoin and Ethereum is declining. In addition, the implied volatility of Bitcoin and Ethereum also fell simultaneously. Bitcoins funding rate remains at a low level, which may reflect the continued low leverage sentiment of market participants towards Bitcoin. The market breadth indicator shows that most cryptocurrencies continue to fall, indicating that the entire market has maintained a weak trend in the past week. CPI data fell, and the prices of mainstream currencies rose and fell when the data was released.
Twitter: @ https://x.com/CTA_ChannelCmt
Webseite: kanalcmt.com
This article is sourced from the internet: Crypto Market Sentiment Research Report (2024.07.05–07.12): CPI declines, mainstream currency prices rise and fall
Original|Odaily Planet Daily Author|LiaoLiao As digital gold, Bitcoins value storage attribute is widely recognized by the market, but its market application scenarios have never been expanded. More projects are still being developed on a large scale on blockchains such as Ethereum and Solana and launched into the market. Although last years inscriptions and the runes that emerged after the halving this year have brought some attention to the issuance of assets on the Bitcoin chain, it is limited to meme culture. The current asset protocol of the Bitcoin ecosystem is difficult to meet the more complex functions and requirements proposed by developers and creators, which is also the core reason why the Bitcoin chain ecosystem has not exploded on a large scale. Giants Protocol came into being and is bringing…


