Crypto Market Sentiment Research Report (14.06.2024-21.06.2024): Bitcoin-ETFs wurden in der Vergangenheit kontinuierlich ausverkauft
Bitcoin ETFs have been sold off continuously over the past 5 days
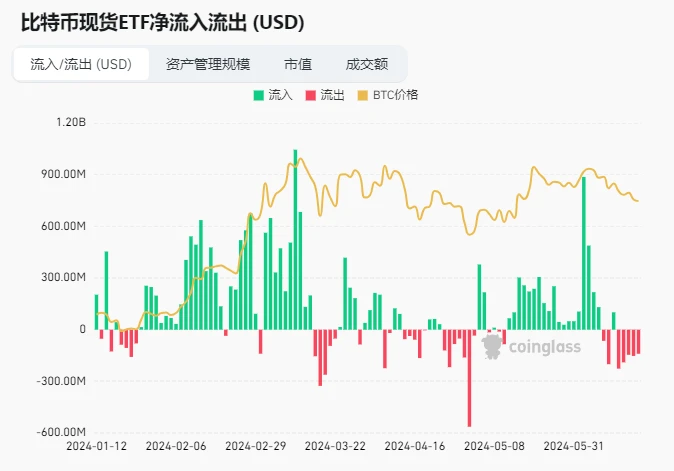
Datenquelle: https://www.coinglass.com/en/bitcoin-etf
The latest data shows that the US spot Bitcoin ETF set off a selling storm on June 17! A total of 3,169 Bitcoins were sold, worth more than $200 million!
Among them, the well-known institution Fidelity reduced its holdings of 1,224 bitcoins, worth up to $80.34 million, and currently still holds a large amount of bitcoins. Another giant, Grayscale, also reduced its holdings of 936 bitcoins, worth more than $61.4 million. The reduction of holdings by these two giants has undoubtedly brought a lot of shock to the market.
This selling storm has created more uncertainty about the future trend of the Bitcoin market, and more risk management is needed.
There are about 38 days until the next Federal Reserve interest rate meeting (2024.08.01)
https://hk.investing.com/economic-calendar/interest-rate-decision-168
Analyse des technischen Marktes und der Stimmungslage

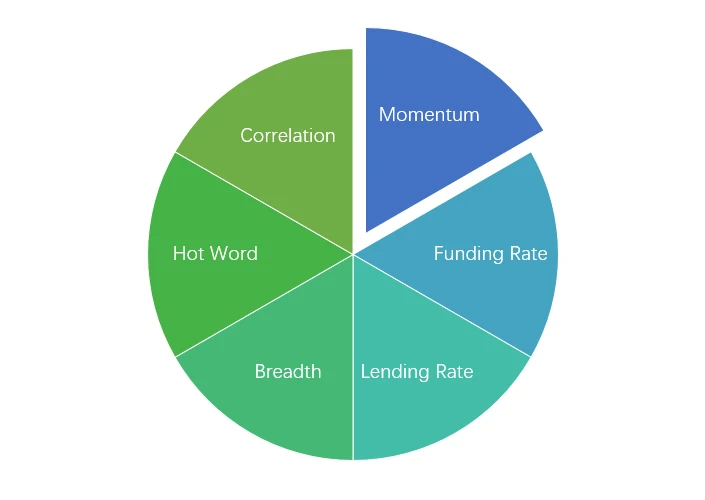
Komponenten der Stimmungsanalyse

Technische Indikatoren
Preisentwicklung
Over the past week, BTC prices fell -2.85% and ETH prices rose 1.26%.

Das obige Bild ist das Preisdiagramm von BTC der letzten Woche.
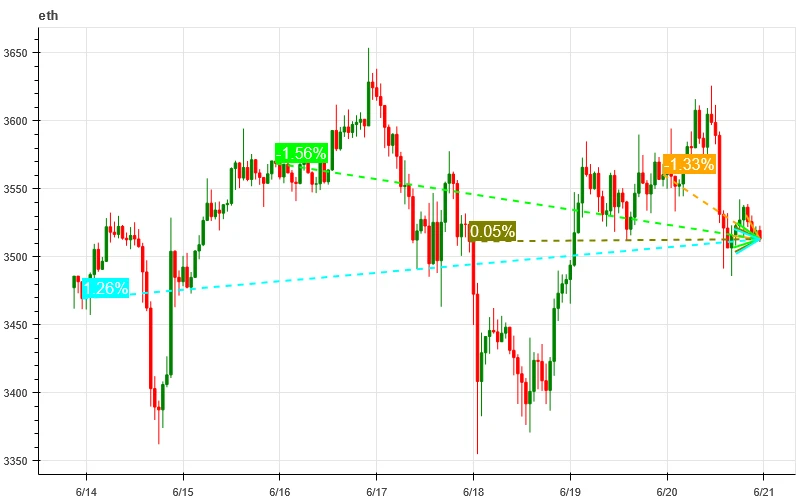
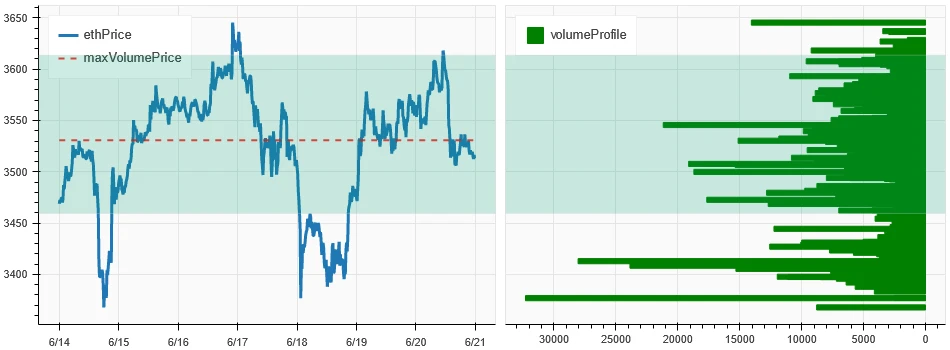
Das obige Bild ist das Preisdiagramm von ETH der letzten Woche.
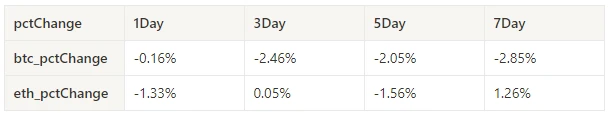
Die Tabelle zeigt die Preisänderungsrate der letzten Woche.
Preis-Volumen-Verteilungsdiagramm (Unterstützung und Widerstand)
In the past week, BTC and ETH have fluctuated widely in the area of intensive trading.
Das obige Bild zeigt die Verteilung der BTC-Handelsgebiete mit hoher Dichte in der vergangenen Woche.

Das obige Bild zeigt die Verteilung der ETH-Handelsgebiete mit hoher Dichte in der vergangenen Woche.

Die Tabelle zeigt die wöchentliche intensive Handelsspanne von BTC und ETH in der vergangenen Woche.
Volumen und offenes Interesse
BTC and ETH saw the largest volume this past week, with the decline on June 18; open interest for BTC fell while ETH rose slightly.
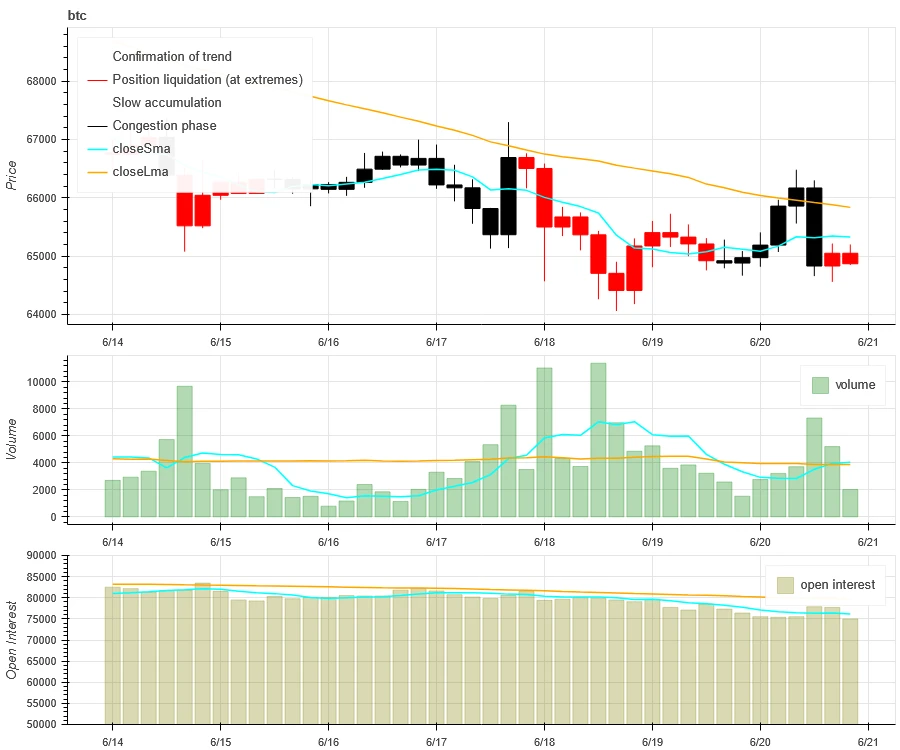
Oben im obigen Bild ist der Preistrend von BTC dargestellt, in der Mitte das Handelsvolumen, unten das offene Interesse, hellblau ist der 1-Tages-Durchschnitt und orange der 7-Tages-Durchschnitt. Die Farbe der K-Linie stellt den aktuellen Zustand dar, grün bedeutet, dass der Preisanstieg durch das Handelsvolumen unterstützt wird, rot bedeutet, dass Positionen geschlossen werden, gelb bedeutet, dass Positionen langsam akkumuliert werden und schwarz bedeutet, dass der Zustand überfüllt ist.

Oben im obigen Bild ist der Preistrend von ETH dargestellt, in der Mitte das Handelsvolumen, unten das offene Interesse, hellblau der 1-Tages-Durchschnitt und orange der 7-Tages-Durchschnitt. Die Farbe der K-Linie stellt den aktuellen Zustand dar, grün bedeutet, dass der Preisanstieg durch das Handelsvolumen unterstützt wird, rot bedeutet, dass Positionen geschlossen werden, gelb bedeutet, dass Positionen langsam angesammelt werden und schwarz bedeutet, dass Positionen überfüllt sind.
Historische Volatilität vs. implizite Volatilität
In the past week, the historical volatility of BTC and ETH was the highest when it fell to 6.14; the implied volatility of BTC and ETH both increased compared to the beginning of the week.

Die gelbe Linie ist die historische Volatilität, die blaue Linie die implizite Volatilität und der rote Punkt ist der 7-Tage-Durchschnitt.

Ereignisgesteuert
No data was released in the past week.
Stimmungsindikatoren
Momentum-Stimmung
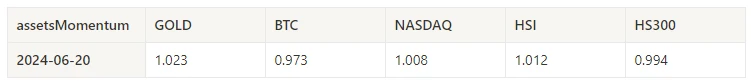
In the past week, among Bitcoin/Gold/Nasdaq/Hang Seng Index/SSE 300, gold was the strongest, while Bitcoin performed the worst.
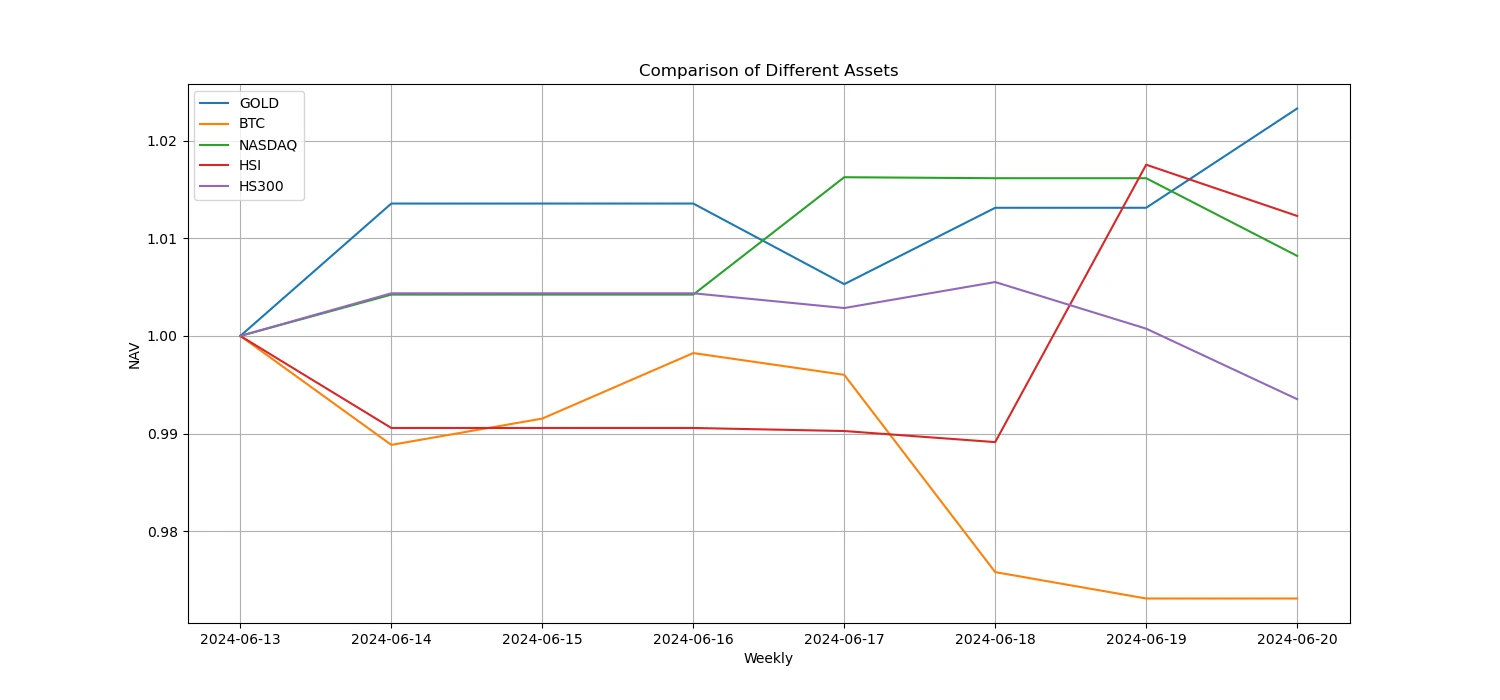
Das obige Bild zeigt den Trend verschiedener Vermögenswerte in der vergangenen Woche.
Kreditzins_Kreditstimmung
The average annualized return on USD lending in the past week was 10.8%, and short-term interest rates rebounded to around 12.6%.
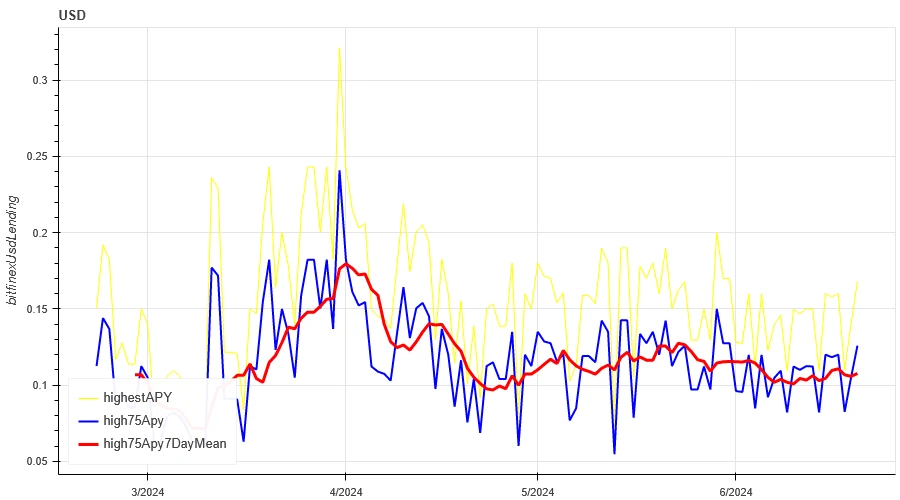
Die gelbe Linie stellt den höchsten Preis des USD-Zinssatzes dar, die blaue Linie entspricht 75% des höchsten Preises und die rote Linie ist der 7-Tage-Durchschnitt von 75% des höchsten Preises.

Die Tabelle zeigt die durchschnittlichen Renditen der USD-Zinssätze für verschiedene Haltetage in der Vergangenheit
Finanzierungsrate_Vertragshebelstimmung
The average annualized return on BTC fees in the past week was 9.6%, and contract leverage sentiment returned to a low level.

Die blaue Linie ist die Finanzierungsrate von BTC auf Binance und die rote Linie ist der 7-Tage-Durchschnitt
Die Tabelle zeigt die durchschnittliche Rendite der BTC-Gebühren für verschiedene Haltetage in der Vergangenheit.
Marktkorrelation_Konsensstimmung
The correlation among the 129 coins selected in the past week remained at around 0.88, and the consistency between different varieties was at a high level.

In the above picture, the blue line is the price of Bitcoin, and the green line is [1000 floki, 1000 lunc, 1000 pepe, 1000 shib, 100 0x ec, 1inch, aave, ada, agix, algo, ankr, ant, ape, apt, arb, ar, astr, atom, audio, avax, axs, bal, band, bat, bch, bigtime, blur, bnb, btc, celo, cfx, chz, ckb, comp, crv, cvx, cyber, dash, doge, dot, dydx, egld, enj, ens, eos,etc, eth, fet, fil, flow, ftm, fxs, gala, gmt, gmx, grt, hbar, hot, icp, icx, imx, inj, iost, iotx, jasmy, kava, klay, ksm, ldo, link, loom, lpt, lqty, lrc, ltc, luna 2, magic, mana, matic, meme, mina, mkr, near, neo, ocean, one, ont, op, pendle, qnt, qtum, rndr, rose, rune, rvn, sand, sei, sfp, skl, snx, sol, ssv, stg, storj, stx, sui, sushi, sxp, theta, tia, trx, t, uma, uni, vet, waves, wld, woo, xem, xlm, xmr, xrp, xtz, yfi, zec, zen, zil, zrx] overall correlation
Marktbreite_Gesamtstimmung
Among the 129 coins selected in the past week, 4% of them were priced above the 30-day moving average, 8.6% of them were above the 30-day moving average relative to BTC, 2.4% of them were more than 20% away from the lowest price in the past 30 days, and 4.7% of them were less than 10% away from the highest price in the past 30 days. The market breadth indicator in the past week showed that the overall market was in a continuous decline for most coins.

Das obige Bild zeigt [bnb, btc, sol, eth, 1000 floki, 1000 lunc, 1000 pepe, 1000 sats, 1000 shib, 100 0x ec, 1inch, aave, ada, agix, ai, algo, alt, ankr, ape, apt, arb, ar, astr, atom, avax, axs, bal, band, bat, bch, bigtime, blur, cake, celo, cfx, chz, ckb, comp, crv, cvx, cyber, dash, doge, dot, dydx, egld, enj, ens, eos,etc, fet, fil, flow, ftm, fxs, gala, gmt, gmx, grt, hbar, hot, icp, icx, idu, imx, inj, iost, iotx, jasmy, jto, jup, kava, klay, ksm, ldo, link, loom, lpt, lqty, lrc, ltc, luna 2, magie, mana, manta, maske, matic, meme, mina, mkr, near, neo, nfp, ozean, eins, ont, op, ordi, pendle, pyth, qnt, qtum, rndr, robin, rose, rune, rvn, sand, sei, sfp, skl, snx, ssv, stg, storj, stx, sui, sushi, sxp, theta, tia, trx, t, uma, uni, vet, wellen, wif, wld, woo,xai, xem, xlm, xmr, xrp, xtz, yfi, zec, zen, zil, zrx ] 30-Tage-Anteil jedes Breitenindikators

Zusammenfassen
Over the past week, the prices of Bitcoin (BTC) and Ethereum (ETH) experienced wide range declines, reaching the peak of volatility on June 18. At the same time, the trading volume of these two cryptocurrencies also reached the highest level during the decline on June 18. Bitcoins open interest volume has declined, while Ethereums open interest volume has increased slightly. In addition, both implied volatilities have increased slightly. In addition, Bitcoins funding rate has fallen to a low level, which may reflect the decline in leverage sentiment of market participants towards Bitcoin. In addition, the market breadth indicator shows that most currencies continue to fall, which indicates that the entire market has generally shown a weak trend over the past week.
Twitter: @ https://x.com/CTA_ChannelCmt
Webseite: kanalcmt.com
This article is sourced from the internet: Crypto Market Sentiment Research Report (2024.06.14-2024.06.21): Bitcoin ETFs have been continuously sold off in the past 5 days
Original | Odaily Planet Daily Autor | Azuma Am 30. April um 20:00 Uhr Pekinger Zeit wird Kamino, das führende DeFi-Protokoll im Solana-Ökosystem, offiziell Token-Anwendungen für den Governance-Token KMNO eröffnen. Zuvor hatte Kamino am 5. April seiner offiziellen Website eine Seite zur Token-Erstellung hinzugefügt. Benutzer konnten zuvor die spezifischen KMNO-Token-Airdrop-Anteile über diese Seite abfragen. Der offene Anspruch heute Abend bedeutet, dass Benutzer die erstellten KMNO-Anteile über diese Schnittstelle beanspruchen und sie auf DEX oder einer CEX handeln können, die KMNO unterstützt. Aufschlüsselung des Geschäftsmodells von Kamino Das Geschäftsmodell von Kamino ist nicht kompliziert und sein grundlegendes Produkt ist ein Kreditprotokoll, mit dem jeder vertraut ist. Laut DeFi Llama-Daten ist Kamino derzeit das drittplatzierte DeFi-Protokoll und das erstplatzierte Kreditprotokoll…