Crypto Market Sentiment Research Report (31.05.-07.06.2024): BNB bricht Allzeithoch mit Marktwert von über 100 Milliarden
Binance Coin BNB is the first to break the historical high market value of over 100 billion US dollars

Binance Coin (BNB) has surpassed $100 billion in market capitalization, marking an important achievement and recognition for the cryptocurrency in the market. This makes BNB one of the few cryptocurrencies with a market capitalization of over $100 billion, highlighting the importance of Binance Exchange and BNB in the cryptocurrency industry.
Compared to giants in the traditional financial industry, such as JP Morgan and Goldman Sachs, whose market capitalizations are $500 billion and $150 billion respectively, Binance鈥檚 market capitalization has not yet reached the level of these traditional financial institutions, but it is approaching and growing rapidly. This shows the potential of the cryptocurrency market and Binance鈥檚 leading position in it.
In addition, Binance鈥檚 market capitalization has also surpassed that of the Commodity Exchange (CME), a major commodity futures exchange that plays an important role in global commodity trading. Binance鈥檚 surpassing is indicative of the growing influence that the cryptocurrency industry is gaining.
In general, Binances market capitalization exceeding $100 billion represents the cryptocurrency markets high recognition of the project and the increase in investor confidence. This achievement marks Binances important position in the cryptocurrency industry and lays a solid foundation for its future development.
Currently, BNB has taken the lead in breaking through its historical high, and mainstream currencies are still fluctuating near the new high, and are expected to break through the new high to drive a new round of rise.
There are about 7 days until the next Fed meeting (2024.06.13)
https://hk.investing.com/economic-calendar/interest-rate-decision-168
Analyse des technischen Marktes und der Stimmungslage

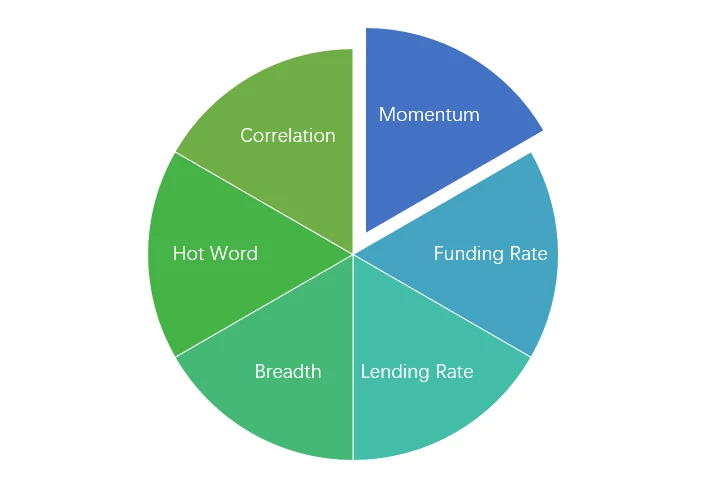
Komponenten der Stimmungsanalyse

Technische Indikatoren
Preisentwicklung
Over the past week, BTC prices have risen 3.58% and ETH prices have risen 1.75%.
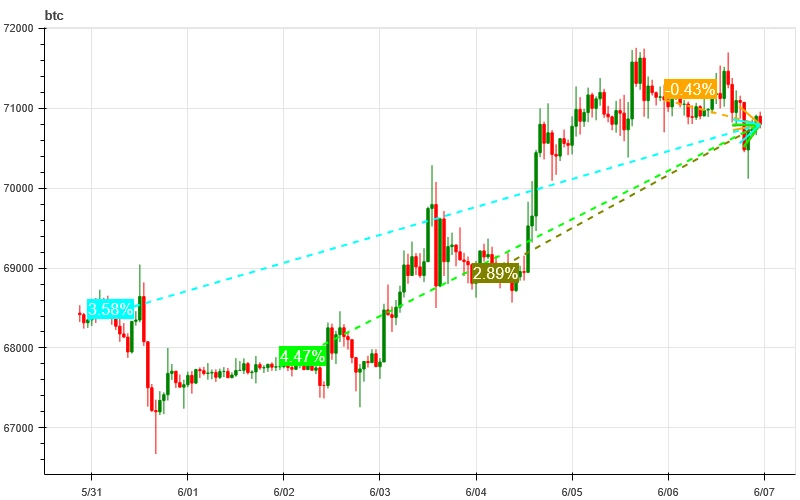
Das obige Bild ist das Preisdiagramm von BTC der letzten Woche.

Das obige Bild ist das Preisdiagramm von ETH der letzten Woche.

Die Tabelle zeigt die Preisänderungsrate der letzten Woche.
Preis-Volumen-Verteilungsdiagramm (Unterstützung und Widerstand)
In the past week, BTC broke through the concentrated trading area upward, while the price of ETH as a whole fluctuated widely within the concentrated trading area.

Das obige Bild zeigt die Verteilung der BTC-Handelsgebiete mit hoher Dichte in der vergangenen Woche.

Das obige Bild zeigt die Verteilung der ETH-Handelsgebiete mit hoher Dichte in der vergangenen Woche.

Die Tabelle zeigt die wöchentliche intensive Handelsspanne von BTC und ETH in der vergangenen Woche.
POC_SARPoint Of ControlSupportResistancebtc67733.2367200.9570106.38 eth 3780.773742.853867.12
Volumen und offenes Interesse
In the past week, BTCs trading volume began to increase after the rise on June 3, while ETHs trading volume was generally sluggish; the open interest of both BTC and ETH increased.

Oben im obigen Bild ist der Preistrend von BTC dargestellt, in der Mitte das Handelsvolumen, unten das offene Interesse, hellblau ist der 1-Tages-Durchschnitt und orange der 7-Tages-Durchschnitt. Die Farbe der K-Linie stellt den aktuellen Zustand dar, grün bedeutet, dass der Preisanstieg durch das Handelsvolumen unterstützt wird, rot bedeutet, dass Positionen geschlossen werden, gelb bedeutet, dass Positionen langsam akkumuliert werden und schwarz bedeutet, dass der Zustand überfüllt ist.
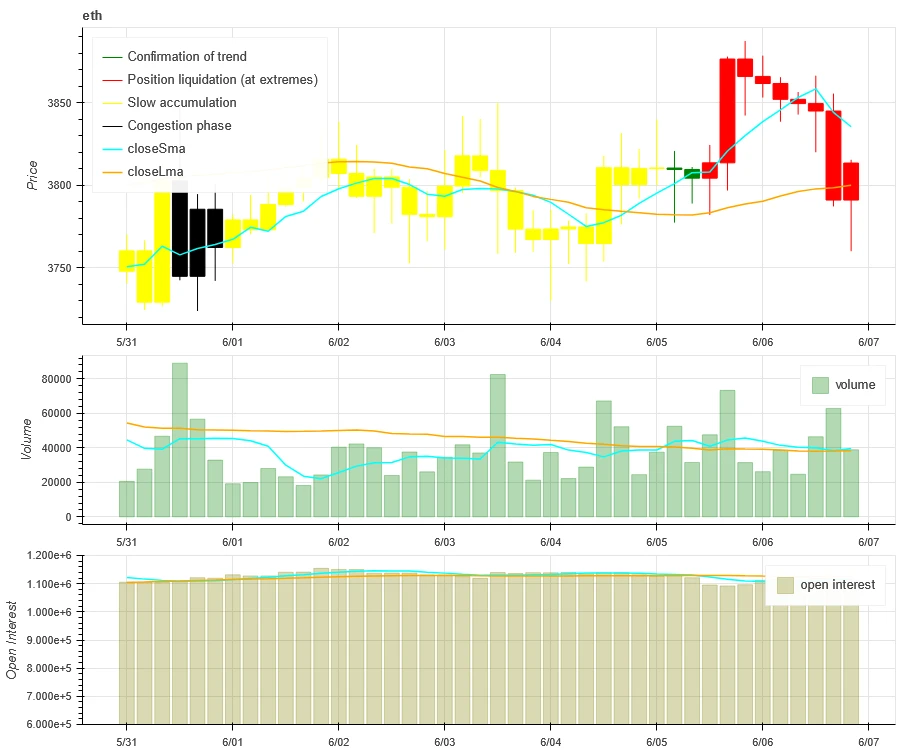
The top of the above picture shows the price trend of ETH, the middle is the trading volume, the bottom is the open interest, the light blue is the 1-day average, and the orange is the 7-day average. The color of the K-line represents the current state, green means the price rise is supported by trading volume, red is closing positions, yellow is slowly accumulating positions, and black is crowded.
Historische Volatilität vs. implizite Volatilität
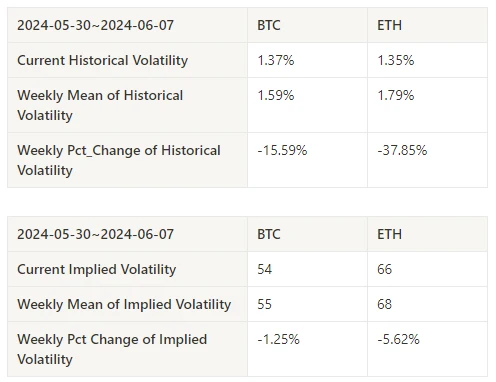
Historical volatility of BTC and ETH remained at a low level over the past week; implied volatility of BTC and ETH declined.
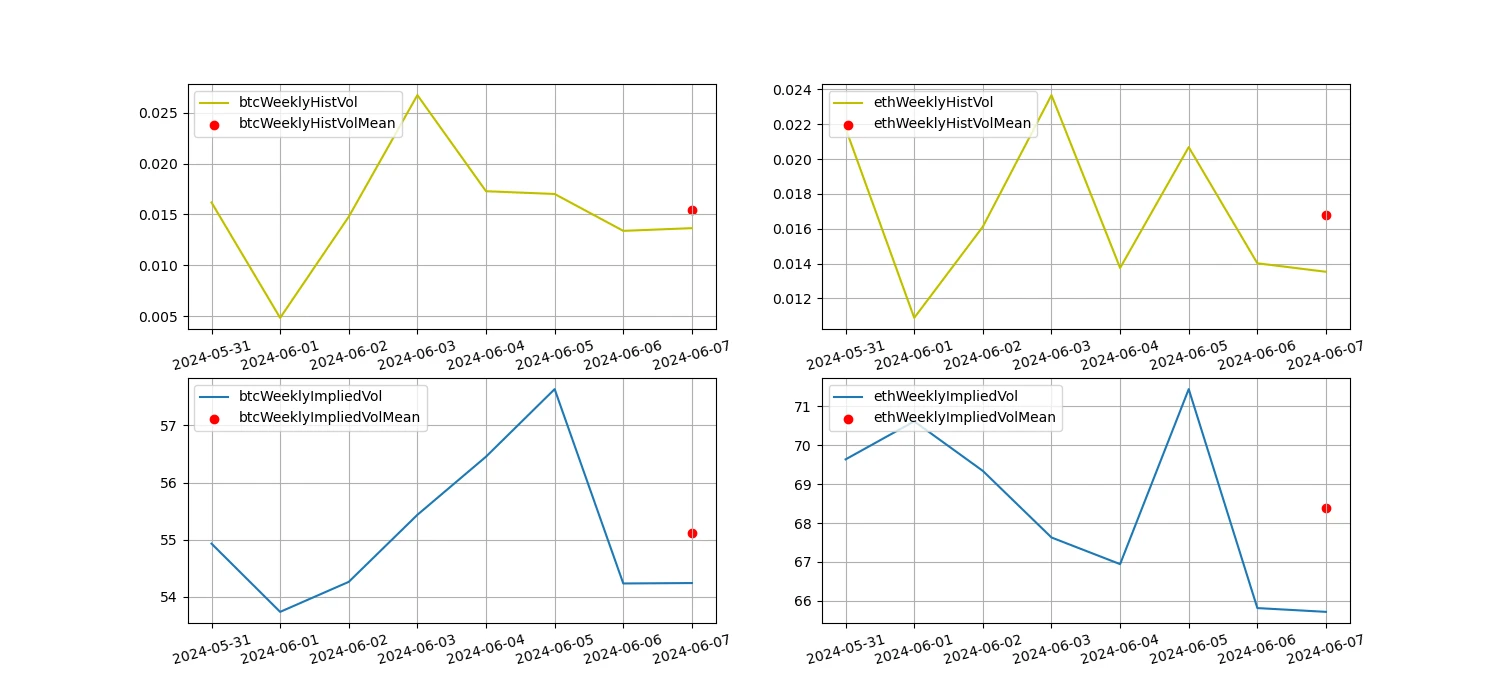
Die gelbe Linie ist die historische Volatilität, die blaue Linie die implizite Volatilität und der rote Punkt ist der 7-Tage-Durchschnitt.
Ereignisgesteuert
In terms of events, on June 7, 2024 at 20:30, the U.S. non-farm data was significantly better than expected, and the prices of mainstream currencies fell sharply and then rebounded.
Stimmungsindikatoren
Momentum-Stimmung
In the past week, among Bitcoin/Gold/Nasdaq/Hang Seng Index/CSI 300, Bitcoin was the strongest, while CSI 300 performed the worst.
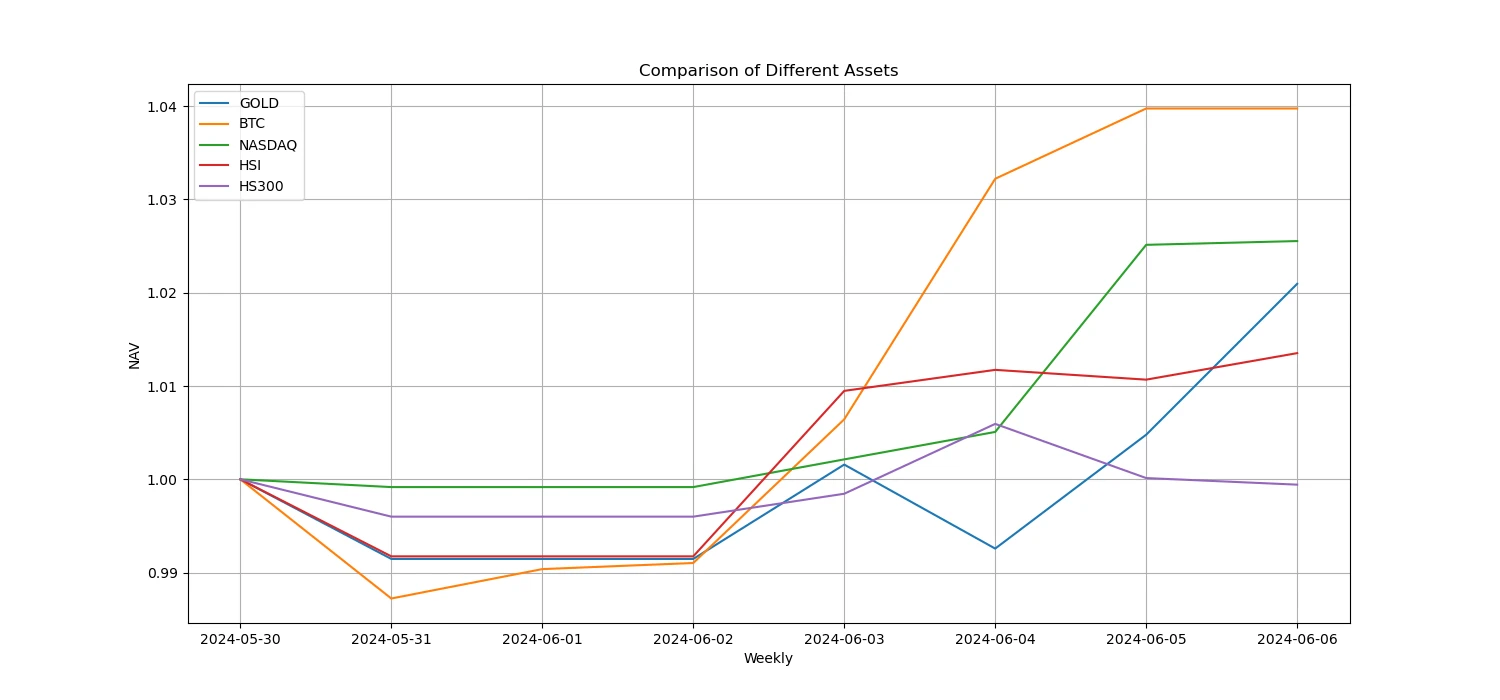
Das obige Bild zeigt den Trend verschiedener Vermögenswerte in der vergangenen Woche.

Kreditzins_Kreditstimmung
The average annualized return on USD lending over the past week was 10.8%, and short-term interest rates fell to around 9.2%.
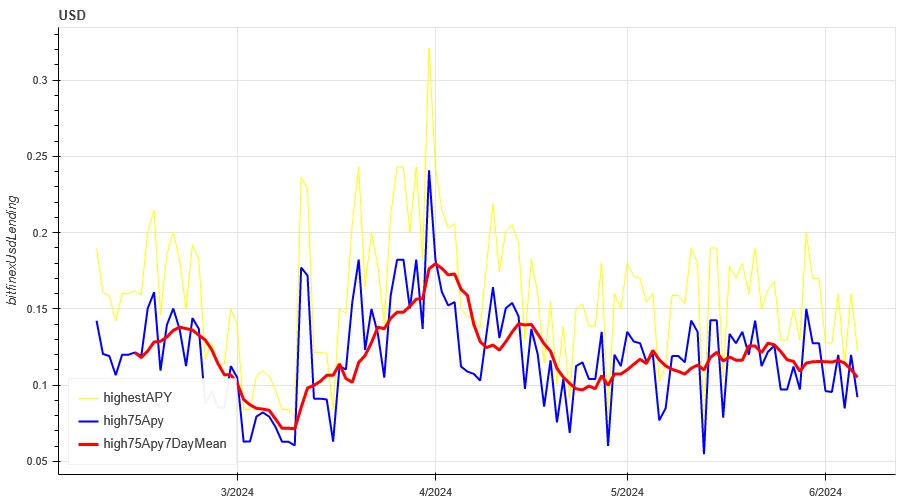
Die gelbe Linie stellt den höchsten Preis des USD-Zinssatzes dar, die blaue Linie entspricht 75% des höchsten Preises und die rote Linie ist der 7-Tage-Durchschnitt von 75% des höchsten Preises.

Die Tabelle zeigt die durchschnittlichen Renditen der USD-Zinssätze für verschiedene Haltetage in der Vergangenheit
Finanzierungsrate_Vertragshebelstimmung
The average annualized return on BTC fees in the past week was 12.2%, and contract leverage sentiment remained at a normal level.

Die blaue Linie ist die Finanzierungsrate von BTC auf Binance und die rote Linie ist der 7-Tage-Durchschnitt

Die Tabelle zeigt die durchschnittliche Rendite der BTC-Gebühren für verschiedene Haltetage in der Vergangenheit.
Marktkorrelation_Konsensstimmung
The correlation among the 129 coins selected in the past week rose to around 0.75, and the consistency between different varieties increased significantly.
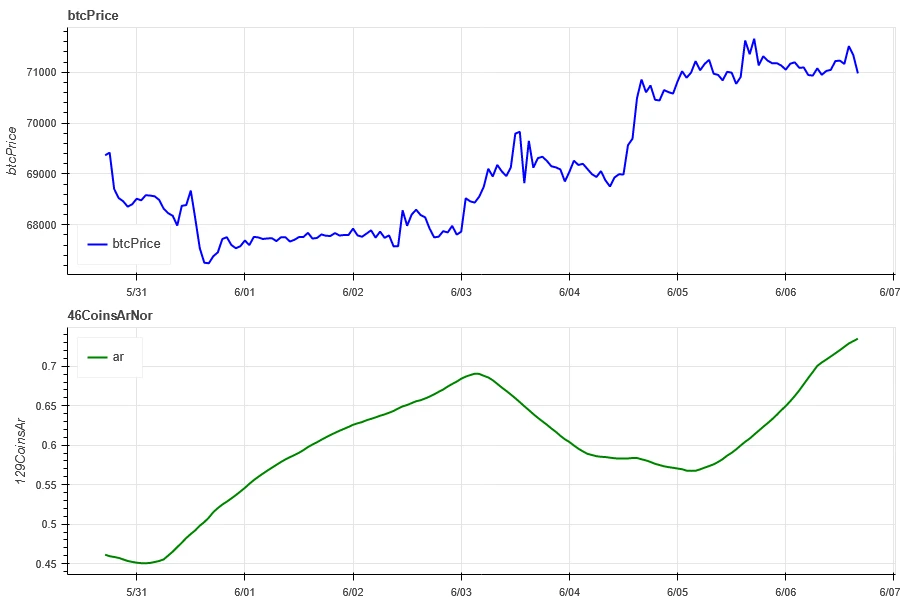
In der obigen Abbildung ist die blaue Linie der Preis von Bitcoin und die grüne Linie ist [1000 Floki, 1000 Lunc, 1000 Pepe, 1000 Shib, 100 0x EC, 1 Zoll, Aave, Ada, Agix, Algo, Ankr, Ant, Ape, Apt, Arb, Ar, Astr, Atom, Audio, Avax, Axs, Bal, Band, Bat, Bch, Bigtime, Blur, Bnb, BTC, Celo, CFX, Chz, CKB, Comp, CRV, CVX, Cyber, Dash, Doge, Dot, Dydx, Egld, Enj, Ens, Eos, usw., Eth, Fet, Fil, Flow, Ftm, FXS, Gala, GMT, GMX, Grt, Hbar, Hot, ICP, ICX, IMX, Inj, iost, iotx, jasmy, kava, klay, ksm, ldo, link, loom, lpt, lqty, lrc, ltc, luna 2, magic, mana, matic, meme, mina, mkr, near, neo, ocean, one, ont, op, pendle, qnt, qtum, rndr, rose, rune, rvn, sand, sei, sfp, skl, snx, sol, ssv, stg, storj, stx, sui, sushi, sxp, theta, tia, trx, t, uma, uni, vet, waves, wld, woo, xem, xlm, xmr, xrp, xtz, yfi, zec, zen, zil, zrx] Gesamtkorrelation
Marktbreite_Gesamtstimmung
Among the 129 coins selected in the past week, 65% of them were priced above the 30-day moving average, 35% of them were above the 30-day moving average relative to BTC, 26% of them were more than 20% away from the lowest price in the past 30 days, and 64% of them were less than 10% away from the highest price in the past 30 days. The market breadth indicator in the past week showed that the overall market was in a stage where most coins resumed their upward trend.

Das obige Bild zeigt [bnb, btc, sol, eth, 1000 floki, 1000 lunc, 1000 pepe, 1000 sats, 1000 shib, 100 0x ec, 1inch, aave, ada, agix, ai, algo, alt, ankr, ape, apt, arb, ar, astr, atom, avax, axs, bal, band, bat, bch, bigtime, blur, cake, celo, cfx, chz, ckb, comp, crv, cvx, cyber, dash, doge, dot, dydx, egld, enj, ens, eos,etc, fet, fil, flow, ftm, fxs, gala, gmt, gmx, grt, hbar, hot, icp, icx, idu, imx, inj, iost, iotx, jasmy, jto, jup, kava, klay, ksm, ldo, link, loom, lpt, lqty, lrc, ltc, luna 2, magie, mana, manta, maske, matic, meme, mina, mkr, near, neo, nfp, ozean, eins, ont, op, ordi, pendle, pyth, qnt, qtum, rndr, robin, rose, rune, rvn, sand, sei, sfp, skl, snx, ssv, stg, storj, stx, sui, sushi, sxp, theta, tia, trx, t, uma, uni, vet, wellen, wif, wld, woo,xai, xem, xlm, xmr, xrp, xtz, yfi, zec, zen, zil, zrx ] 30-Tage-Anteil jedes Breitenindikators

Zusammenfassen
In the past week, Bitcoin (BTC) rose 3.58% to a record high, while Ethereum (ETH) fluctuated near its previous high. At the same time, their historical volatility remained low. Bitcoins trading volume increased after the rise on June 3, while Ethereums trading volume was generally sluggish. The open interest of Bitcoin and Ethereum increased slightly, and the implied volatility decreased. In addition, Bitcoins funding rate remained at a normal level, and the market breadth indicator showed that the overall market was in a stage where most currencies resumed their upward trend. 2024.6.7 20:30 The US non-farm data was significantly better than expected, and the price rebounded after a sharp drop.
Twitter: @ https://x.com/CTA_ChannelCmt
Webseite: kanalcmt.com
This article is sourced from the internet: Crypto Market Sentiment Research Report (2024.05.31-06.07): BNB breaks all-time high with market value exceeding 100 billion US dollars
On June 6, according to official news, Robinhood announced that it would acquire the global cryptocurrency trading platform Bitstamp. As a result, Robinhoods stock price rose 2.27% before the market opened. Johann Kerbrat, head of crypto at Robinhood, expressed his views on the acquisition of Bitstamp, saying that the acquisition of Bitstamp is an important step for Robinhood to develop its cryptocurrency business. The acquisition aims to better expand its business outside the United States and welcome institutional clients to join Robinhood. 13 years of hard work, $200 million in revenue For this acquisition, Robinhood expects the final transaction price to be approximately $200 million in cash, subject to customary adjustments to the purchase price. The acquisition is subject to customary closing conditions, including regulatory approvals, and is expected to…


